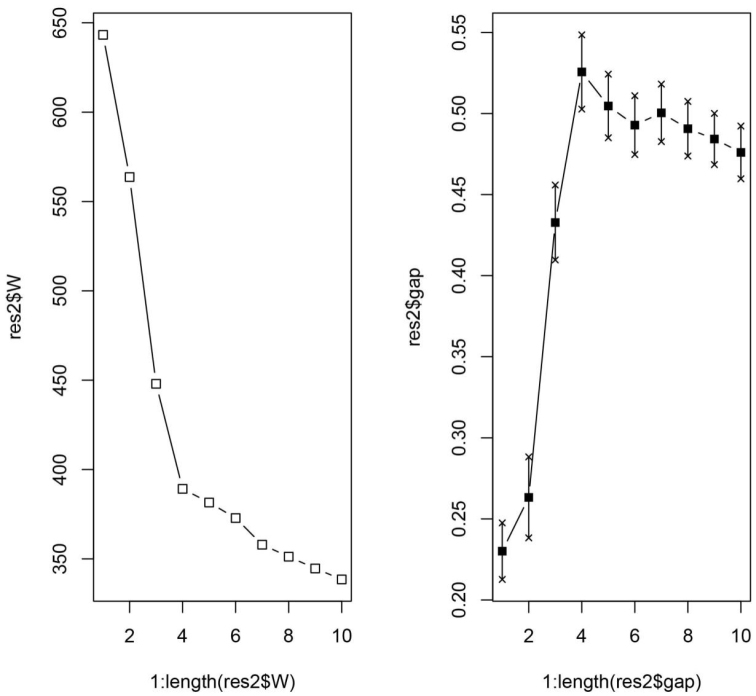
Figure 12.
Gap statistic for dataset of hafahafa species-group. Four-cluster solution is highly supported by the elbow at 4 components by the dispersion curve (left) and by the peak at cluster number four by the gap curve (right). Number of clusters in the data (X axis), the total within-cluster dispersion for each evaluated partition (Y axis for the left plot) and the vector of length Kmax giving the Gap statistic for each evaluated partition (Y axix for the right plot) is illustrated.

