Abstract
The mammalian clock system is composed of a master clock and peripheral clocks. At the molecular level, the rhythm-generating mechanism is controlled by a molecular clock composed of positive and negative feedback loops. However, the underlying mechanisms for molecular clock regulation that affect circadian clock function remain unclear. Here, we show that Egr1 (early growth response 1), an early growth response gene, is expressed in mouse liver in a circadian manner. Consistently, Egr1 is transactivated by the CLOCK/BMAL1 heterodimer through a conserved E-box response element. In hepatocytes, EGR1 regulates the transcription of several core clock genes, including Bmal1, Per1, Per2, Rev-erbα and Rev-erbβ, and the rhythm amplitude of their expression is dependent on EGR1’s transcriptional function. Further mechanistic studies indicated that EGR1 binds to the proximal region of the Per1 promoter to activate its transcription directly. When the peripheral clock is altered by light or feeding behavior transposition in Egr1-deficient mice, the expression phase of hepatic clock genes shifts normally, but the amplitude is also altered. Our data reveal a critical role for EGR1 in the regulation of hepatic clock circuitry, which may contribute to the rhythm stability of peripheral clock oscillators.
Most living organisms exhibit behavioral and physiological rhythms, including sleep-wake, rest-activity, blood pressure, hormone secretion and energy metabolism1,2,3,4,5,6. This diurnal oscillation is regulated by circadian clocks, which respond to light and feeding cycles. In mammals, a master clock that generates circadian rhythms is located in the suprachiasmatic nucleus (SCN) and drives the slave oscillators that are distributed in various peripheral tissues using autonomic innervation and behavioral and neuroendocrine signals6,7,8. In addition, behavioral and neuroendocrine signals are innervated by the autonomous nervous system8. The SCN synchronizes peripheral oscillators by secreting cyclical neuroendocrine signals or imposing rest-activity rhythms and feeding-fasting cycles7,9. Feeding behavior regulates the peripheral oscillators through signaling metabolites such as glucose and hormones7,9.
The central and peripheral clocks are controlled by a common transcriptional circuitry that generates rhythmic patterns of gene expression. The molecular components of the clock oscillator have been elegantly elucidated over the past two decades. At the molecular level, CLOCK and BMAL1 are two basic helix-loop-helix transcription factors that initiate the transcription of target genes that contain E-box cis-regulatory enhancer sequences, including Per and Cry10. PER and CRY proteins form heterodimers that translocate back to the nucleus to repress their own expression by repressing CLOCK/BMAL1 complex activity, which forms the critical negative feedback loop within the clock circuitry11,12. In addition, Bmal1 transcription is regulated both positively and negatively by the orphan nuclear receptors RORs and REV-ERBs13,14. This core feedback loop requires approximately 24 h to complete a cycle and constitutes a circadian oscillation of the molecular clock. The proper phases and amplitudes of the endogenous molecular clocks are crucial for the operation of the body’s biological rhythm. However, the significance of amplitude in the function of the circadian pacemaker is not well understood. Previous reports have shown that a robust circadian oscillator might be more resistant to phase perturbation15,16. The degradation of circadian rhythms in old age is normally accompanied by both loss of amplitude and fragmentation of output rhythms17. The reduction in the circadian amplitude may contribute to the instability of circadian rhythms and other homeostatic processes18.
Egr1 is a member of the immediate early response gene family and recognizes a highly conserved GC-rich promoter consensus motif19,20. Egr1 can be transiently activated by many cytokines, growth factors, hormones and DNA-damaging agents. In addition, as a transcription factor, EGR1 binds to target sequences and regulates the expression of many genes such as TNF-α, PTEN and SOCS-121–23. EGR1 expression is highly responsive to nutrition signaling under both fasting and feeding conditions. In the liver, fasting induces EGR1 expression, which promotes hepatic gluconeogenesis by activating C/EBPα transcription24. EGR1 also activates cholesterol biosynthetic gene expression to promote cholesterol biosynthesis under feeding conditions25. Previous reports have also shown that EGR1 can regulate the expression of certain clock genes in cell lines26,27,28. Based on these findings, we hypothesize that EGR1 may play a potential role in the regulation of the hepatic circadian clock in response to feeding/fasting or other signals.
Here, we show that EGR1 is rhythmically expressed in mouse liver and is required for defining some of the circadian expression patterns of several core clock genes in liver. Moreover, we clarify that EGR1 regulates the circadian amplitude of the hepatic clock gene rhythms by activating Per1 transcription.
Results
Egr1 is rhythmically expressed in mouse liver
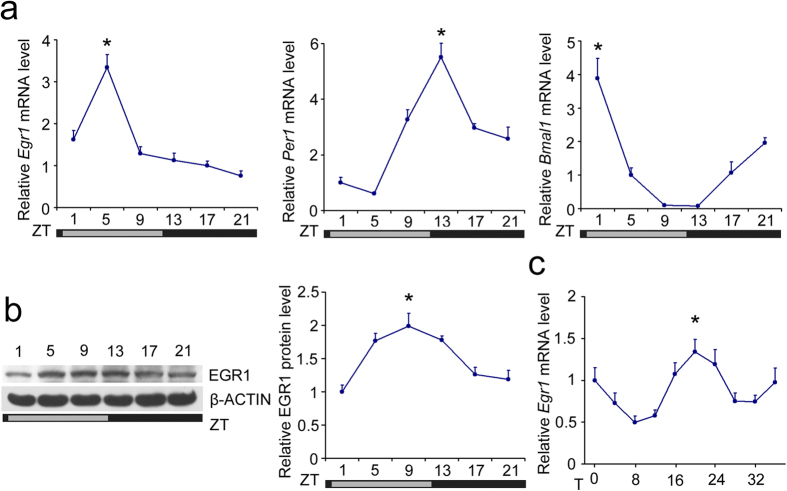
Thousands of genes are rhythmically expressed either cell-autonomously or in response to the clockwork of the body. Previous microarray analysis and meta-analysis have shown that Egr1 is expressed in mouse liver in a circadian manner29,30,31,32. At the mRNA level, we also found that Egr1 expression had a diurnal rhythm that peaked at ZT5 (ZT0 is the onset at hour 0 of the subjective light period), gradually declined thereafter, and reached a nadir at ZT21 in mouse liver (Fig. 1a). The peak of the Per1 oscillation occurred behind that of Egr1 but before that of Bmal1 and other clock genes, implying a potential regulatory relationship between Egr1 and Per1 (Fig. 1a, Supplementary Fig. 1a). Egr1 mRNA was also expressed in a circadian manner in the kidney, skeletal muscle, heart, and epididymal fat; however, the phase differed significantly from the expression pattern observed in the liver (Supplementary Fig. 1b). Immunoblot analysis indicated that EGR1 protein expression was significantly higher at ZT5 to ZT13 and gradually declined to the basal level (Fig. 1b). The rhythmic expression of Egr1 was also confirmed in a serum shock cell model, in which the peak of Egr1 mRNA expression occurred approximately 20 hours after serum shock (Fig. 1c).
Figure 1. Circadian expression of Egr1 in mouse liver.
(a) qRT-PCR analysis of Egr1, Per1 and Bmal1 mRNA expression in the livers from B6 mice entrained to an LD 12:12 cycle. Data are shown as the mean ± s.d. *P < 0.02 peak versus nadir. (b) Protein expression of EGR1 at the indicated time-points. The gels were run under the same experimental conditions. The full-length blots are presented in Supplementary Fig. 5. *P < 0.03 peak versus nadir. (c) Time course expression of Egr1 in mouse AML-12 cells subjected to serum shock. *P < 0.03 peak versus nadir.
Egr1 is regulated under a circadian feedback loop
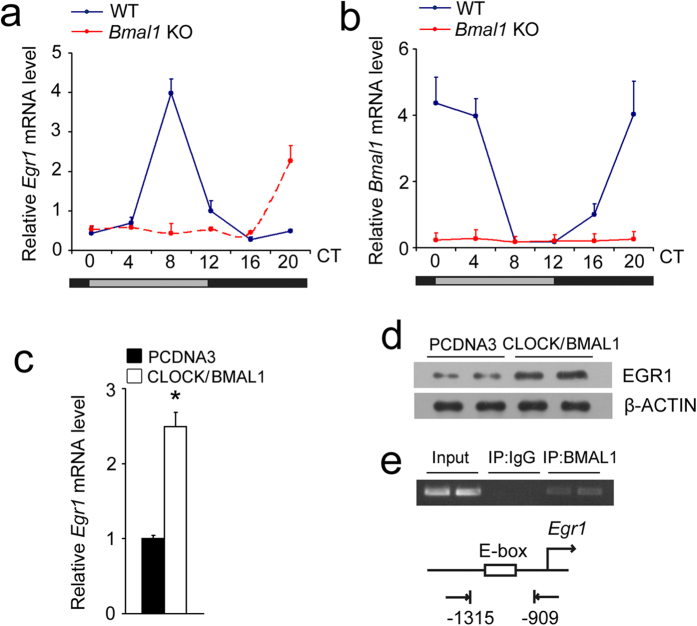
To examine whether the circadian expression of Egr1 in the liver is regulated by an endogenous circadian clock, we monitored the Egr1 mRNA levels in the livers of Bmal1 knockout mice. As shown in Fig. 2a, the phase of the Egr1 rhythm was delayed for 12 hours, and the amplitude was reduced in the Bmal1 KO mice under constant darkness. The Bmal1 expression levels in the livers of Bmal1 KO mice are shown in Fig. 2b. The overexpression of BMAL1/CLOCK heterodimers in a mouse hepatocyte cell line increased EGR1 expression (Fig. 2c,d). ChIP assays in the mouse liver also revealed that BMAL1 was present near an E box on the proximal Egr1 promoter at ZT5 (Fig. 2e). These results indicate that Egr1 is a circadian clock target and is negatively regulated by the circadian feedback loop.
Figure 2. Egr1 is a clock-controlled gene.
(a) qRT-PCR analysis of Egr1 mRNA expression in livers from wild-type and Bmal1 null mice under constant darkness. (b) qRT-PCR analysis of Bmal1 mRNA expression in livers from wild-type and Bmal1 null mice under constant darkness. (c) qRT-PCR analysis of Egr1 expression in AML-12 cells after co-transfection with BMAL1 and CLOCK plasmids for 48 h. (d) Immunoblot analysis of EGR1 expression in AML-12 cells after co-transfection with BMAL1 and CLOCK plasmids for 48 h. The gels were run under the same experimental conditions. The full-length blots are presented in Supplementary Fig. 6. (e) ChIP assays in mouse livers at ZT5. PCR primers amplify a fragment flanking the E box on the Egr1 promoter. Data are shown as the mean ± s.d. *P < 0.01.
EGR1 is responsible for the expression of clock genes
To determine whether EGR1 might influence the clock network, we overexpressed EGR1 in primary hepatocytes and in the mouse AML-12 cell line. qPCR analysis indicated that EGR1 was able to induce the expression of Bmal1, Per1 and Rorα and to decrease the expression of Per2, Rev-erbα and Rev-erbβ in both cell types (Fig. 3a, Supplementary Fig. 2b). However, other clock genes (Clock, Cry1, Cry2 and Rorγ) were not altered, which indicated that EGR1 exerts specific effects on the circadian downstream genes (Supplementary Fig. 2a,b). Consistent with the mRNA expression findings, the BMAL1 and PER1 protein levels were elevated but CLOCK was unaffected upon EGR1 overexpression (Fig. 3b). Our data suggest that EGR1 is expressed autonomously and rhythmically in the liver and regulates the transcription of clock genes.
Figure 3. Regulation of clock genes by EGR1.
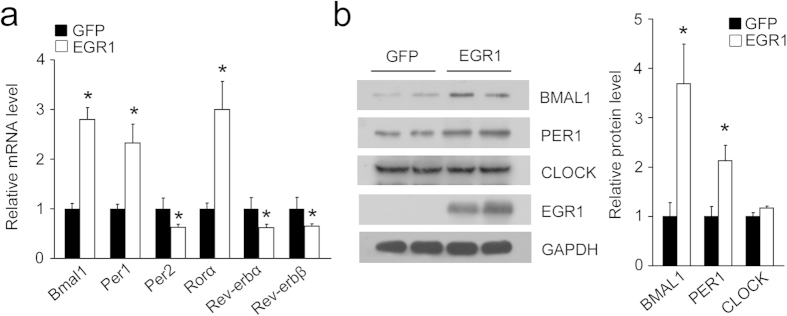
(a) qPCR analysis of clock genes in primary hepatocytes infected with GFP or EGR1 adenoviruses for 48 h. *P < 0.04. (b) Immunoblots of cell lysates of primary hepatocytes using the indicated antibodies. The gels were run under the same experimental conditions. The full-length blots are presented in Supplementary Fig. 7. Data are shown as the mean ± s.d. *P < 0.05.
EGR1 is responsible for the amplitude but not the phase of the rhythmic clock gene expression in cultured hepatocytes
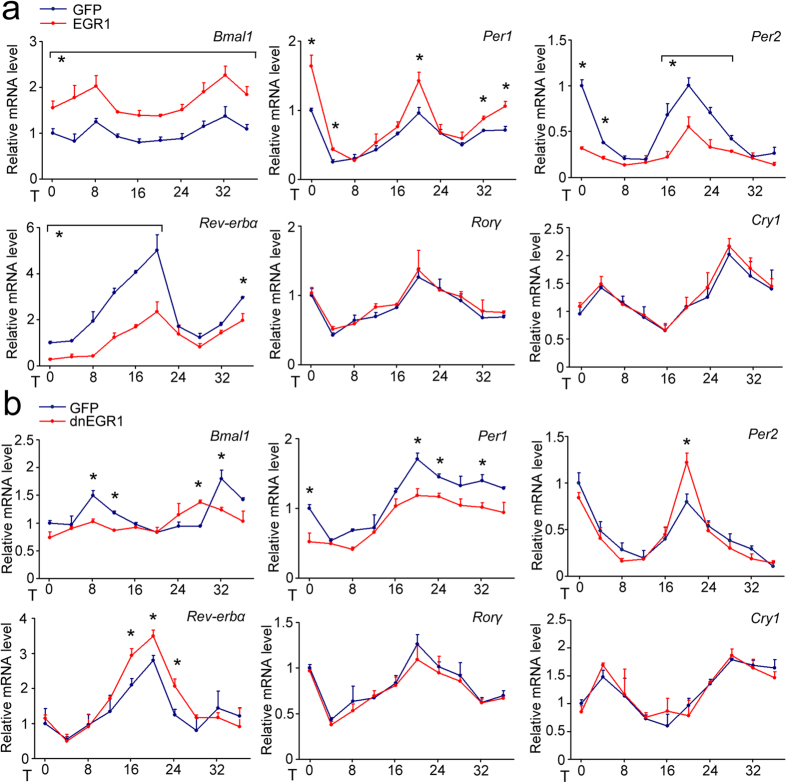
Serum shock has been demonstrated to induce rhythmic clock gene expression in cultured cells and thus provides a useful in vitro model for studying the clock mechanism33. Based on the above results, we further investigated the function of EGR1 in the clock circuit of cultured cells. We overexpressed EGR1 or inhibited the transcriptional activity of EGR1 in mouse AML-12 cells and then exposed these cells to brief serum shock for 2 hours, followed by observation for 36 hours. We found that the phase of the rhythmic clock gene expression was not altered but that the amplitudes of the Bmal1 and Per1 rhythms were elevated significantly after EGR1 overexpression, whereas the amplitudes of the Per2 and Rev-erbα rhythms were reduced (Fig. 4a). The inhibition of EGR1 transcriptional activity using dnEGR1 adenovirus reduced the amplitudes of the Bmal1 and Per1 rhythms and elevated those of the Per2 and Rev-erbα rhythms (Fig. 4b). Overexpressed EGR1 or transcriptionally repressed EGR1 did not affect the rhythmic expression of Rorγ or Cry1 (Fig. 4a,b). These in vitro data suggest that EGR1 dominantly affects the amplitude rather than the phase of rhythmic clock gene expression. Based on the above observations, our results suggest that EGR1 may activate Per1 transcription. The accumulation of PER1 leads to the repression of Per2 and Rev-erbs by inhibiting BMAL1/CLOCK activity. Repression of REV-ERBs possibly leads to the robust oscillation of Bmal1.
Figure 4. Cell-autonomous role of EGR1 in clock regulation in vitro.
(a) Time course expression of clock genes in mouse AML-12 cells infected with GFP or EGR1 adenoviruses following serum shock. Data are shown as the mean ± s.d. *P < 0.05, EGR1 versus control. (b) Time course expression of clock genes in mouse AML-12 cells infected with GFP or dnEGR1 adenoviruses following serum shock. *P < 0.05, dnEGR1 versus control.
EGR1 is responsible for the amplitude of clock gene rhythms in vivo
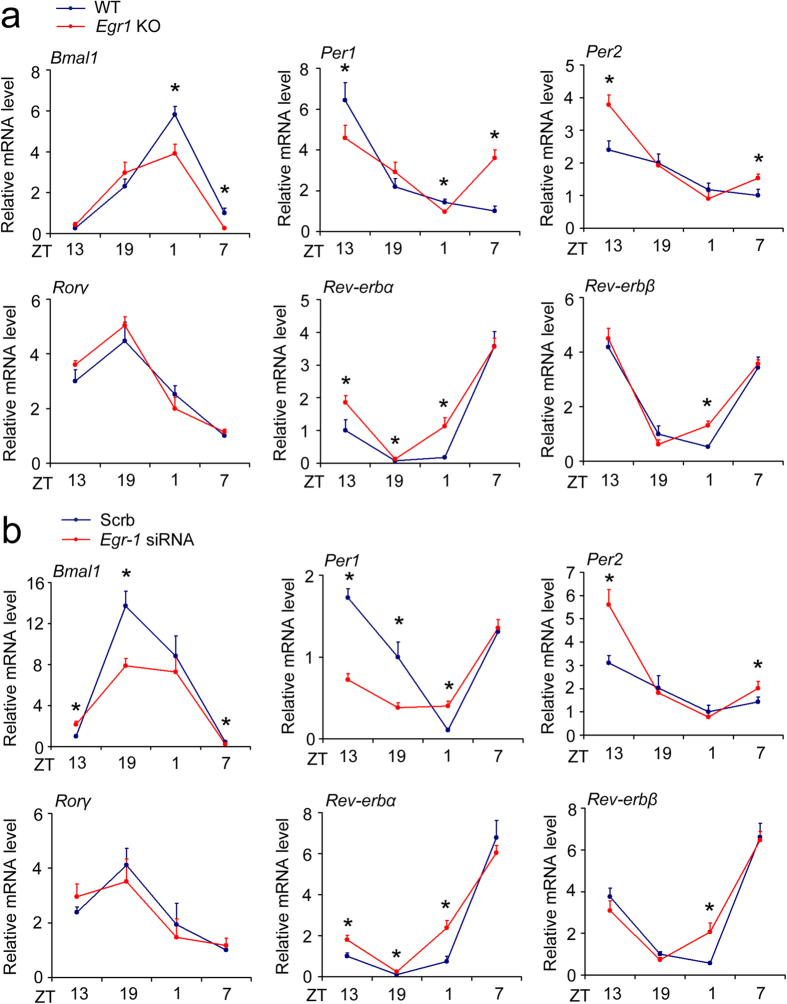
To further confirm the regulation of the amplitude of clock gene rhythms by EGR1, we examined the circadian expression of clock genes in the livers of Egr1 KO mice. Overall, the amplitudes of Bmal1 and Per1 rhythms were reduced, whereas the amplitude of the Per2 rhythm was elevated in the livers of Egr1 KO mice (Fig. 5a). Moreover, the Rev-erbα and Rev-erbβ expression levels were increased in the livers of Egr1 KO mice, but the rhythmic expression of the Rorγ gene was not altered (Fig. 5a). The in vivo data indicated that EGR1 is truly responsible for the expression of clock genes and for the amplitude changes of Bmal1, Per1 and Per2 rhythms. Although the expression levels of the examined genes were impaired in Egr1-deficient liver, the phases of these genes appeared to be preserved. A previous report revealed that EGR1 is not involved in the regulation of central clock function34. To further exclude the possibility that the perturbation of liver clocks in Egr1 null mice may be secondary to a compromised central clock, we examined tissue-autonomous clock expression in vivo. C57/Bl6J mice were injected with Scrb (Scramble, stable expression of non-targeting siRNA) or Egr1 siRNA through their tail veins. Indeed, the Egr1 expression levels were decreased after injection with Egr1 siRNA (Supplementary Fig. 3a). RNAi knockdown of Egr1 in the liver decreased the amplitudes of Bmal1 and Per1 rhythms while augmenting the Per2 rhythm (Fig. 5b). Egr1 knockdown also increased the Rev-erbα and Rev-erbβ expression levels but did not alter the rhythmic expression of the Rorγ gene (Fig. 5b). According to the above-presented results, we also found that the nadirs of Per1 and Rev-erbβ rhythms were advanced approximately 4 hours after knockout or knockdown of Egr1 (Fig. 5a,b). Thus, we conclude that Egr1 exerts its effects on the circadian clock in a largely tissue-autonomous manner.
Figure 5. Knockout of Egr1 or inhibition of hepatic Egr1 expression disrupted hepatic clock function.
(a) qRT-PCR analysis of clock gene expression in livers from wild-type and Egr1 null mice. Data are shown as the mean ± s.d. *P < 0.05, wild-type versus null mice. (b) qRT-PCR analysis of clock gene expression in livers from B6 mice injected with Scrb or Egr1 siRNA through tail vein injections. *P < 0.05, Egr1 siRNA versus Scrb.
Per1 gene transcription is activated directly by EGR1 and is responsible for EGR1-regulated clock gene expression
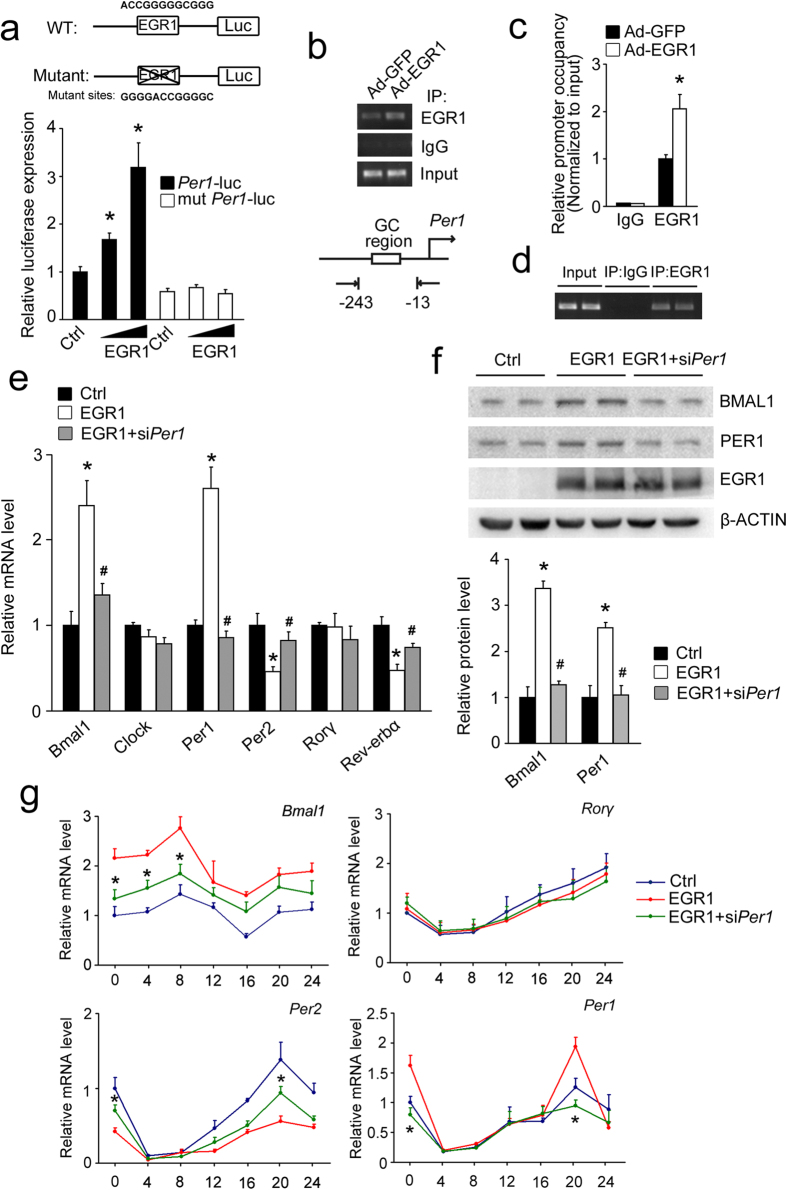
We found that a non-canonical EGR1 binding site (GC region, ACCGGGGGCGGG) exists at −90 to −79 of the 5′-flanking sequence of the mouse Per1 gene. According to the above-presented results, analyzing whether EGR1 activates Per1 transcription directly in mouse liver was reasonable. EGR1 overexpression increased Per1 promoter reporter activity (Fig. 6a). However, the activating effects of EGR1 were abolished when the EGR1-binding sites on the Per1 promoter were mutated (Fig. 6a). Chromatin immunoprecipitation (ChIP) assays in mouse AML-12 cells indicated that EGR1 was present near the GC region on the proximal Per1 promoter and that EGR1 overexpression augmented the binding of EGR1 on the Per1 promoter (Fig. 6b,c). ChIP assays in mouse liver also revealed that EGR1 was present near the GC region on the proximal Per1 promoter at ZT13 (Fig. 6d). These results demonstrated that EGR1 activates Per1 transcription by binding directly to the Per1 promoter in mouse liver.
Figure 6. PER1 mediates the regulation of clock genes by EGR1.
(a) Reporter gene assays in 293T cells using wild-type (Per1-luc) or EGR1 binding site mutant (mut Per1-luc) Per1-luciferase reporters in combination with EGR1 or control plasmid. *P < 0.01, EGR1 versus control. (b) ChIP assays with the indicated antibodies using AML-12 cells infected with GFP or EGR1 adenoviruses for 48 h. PCR primers amplified a fragment flanking the GC region on the Per1 promoter. (c) qPCR analysis of ChIP assays with the indicated antibodies. *P < 0.01. (d) ChIP assays in mouse livers at ZT13. PCR primers amplify a fragment flanking GC region on the Per1 promoter. (e) qPCR analysis of clock genes in primary hepatocytes infected with the GFP or EGR1 adenoviruses for 48 h after transfection with Scrb or Per1 siRNA for 6 h. *P < 0.04, EGR1 versus control. #P < 0.05, EGR1+siPer1 versus EGR1. (f) Protein expression in primary hepatocytes infected with the GFP or EGR1 adenoviruses for 48 h after transfection with Scrb or Per1 siRNA for 6 h. The gels were run under the same experimental conditions. The full-length blots are presented in Supplementary Fig. 8. *P < 0.02 EGR1 versus control. #P < 0.02, EGR1+siPer1 versus EGR1. (g) Time course expression of clock genes in mouse AML-12 cells infected with GFP or EGR1 adenoviruses for 48 h after transfection with Scrb or Per1 siRNA for 6 h following serum shock. *P < 0.05 EGR1+siPer1 versus EGR1.
We next determined whether PER1 is responsible for the regulation of other clock genes by EGR1 in hepatocytes. We found that the alteration in Bmal1, Per2, and Rev-erbα expression following EGR1 overexpression could be partially restored by Per1 knockdown (Fig. 6e). Per1 knockdown also inhibited the upregulation of BMAL1 protein that was induced by EGR1 overexpression (Fig. 6f). Serum shock-induced alterations in the amplitudes of Bmal1 and Per2 rhythms following EGR1 overexpression were also partially restored by Per1 knockdown (Fig. 6g). Collectively, our results confirm that the upregulated expression of Per1 is responsible for the EGR1-regulated amplitude alteration of downstream clock gene rhythms.
EGR1 is required for the feeding/fasting- or light-induced alteration of clock gene rhythms in vivo
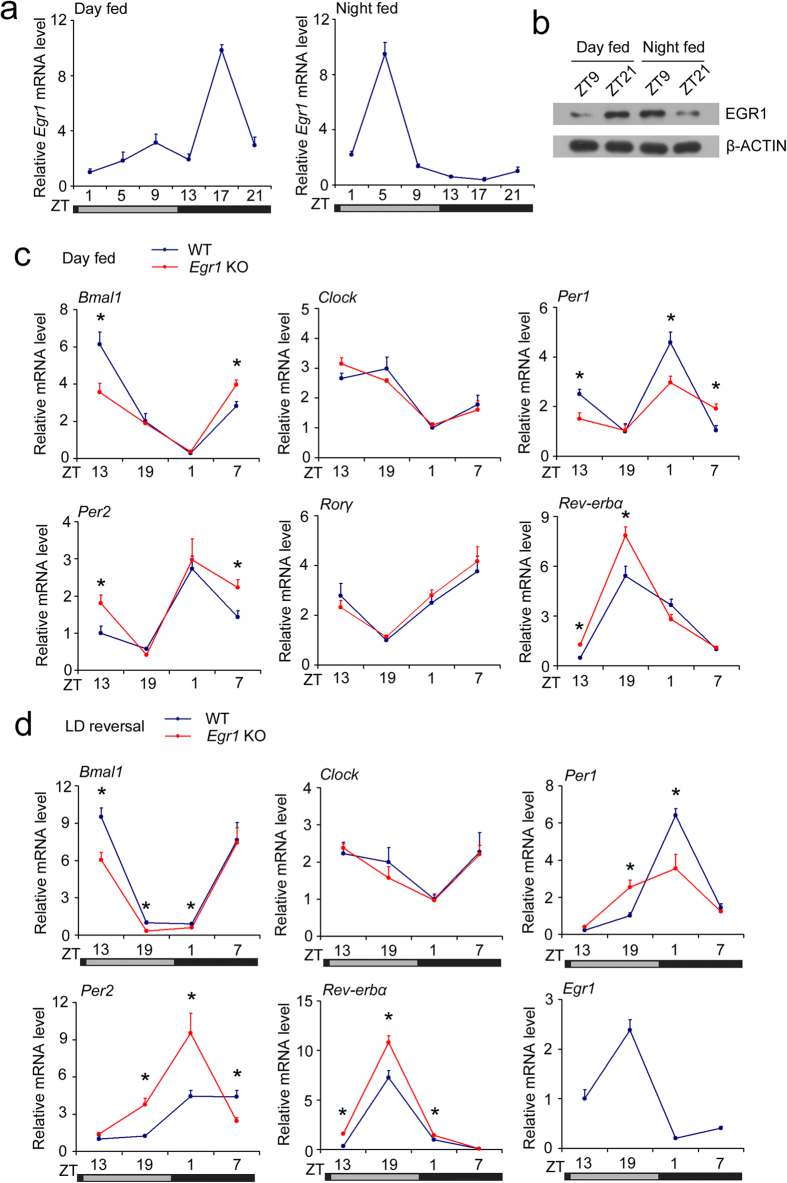
The master clock synchronizes peripheral oscillators by imposing light-regulated rest-activity rhythms and feeding-fasting cycles9. The feeding-fasting rhythm is a dominant Zeitgeber for peripheral oscillators35. We found that the peak of hepatic EGR1 expression was shifted by 12 hours in the day-fed animals compared with the night-fed control animals (Fig. 7a,b). As expected, clock genes such as Bmal1 and Per1 were also shifted by 12 hours in the day-fed mice (Supplementary Fig. 4a). Next, we subjected wild-type and Egr1 null mice to day feeding. Day feeding-induced reset of clock gene rhythms was preserved, but the amplitudes of the rhythms of clock genes, including Bmal1, Per1, Per2, and Rev-erbα were reduced significantly in the livers of Egr1 null mice (Fig. 7c). By contrast, the rhythmic expression of other clock genes (Clock and Rorγ) was not altered by Egr1 deletion in the context of day feeding (Fig. 7c). Light:dark (LD) cycle incubation is another model for studying the regulation of peripheral oscillators and master pacemaker. Therefore, we examined the expression patterns of clock genes in the livers of mice after 10 days of LD reversal. We also found that the amplitudes of Bmal1 and Per1 rhythms were reduced but that Per2 and Rev-erbα amplitudes were elevated in the livers of Egr1 null mice after LD reversal (Fig. 7d). Additionally, the rhythmic expression of the Clock gene was not altered by Egr1 deletion (Fig. 7d). These results further confirm that EGR1 modulates the amplitude of hepatic clock gene rhythms.
Figure 7. EGR1 mediates the feeding/fasting or light-induced alteration of clock function.
(a) qPCR analysis of Egr1 mRNA expression in livers from B6 mice subjected to daytime feeding or nighttime feeding. (b) EGR1 protein level at representative timepoints. The gels were run under the same experimental conditions. The full-length blots are presented in Supplementary Fig. 9. (c) qRT-PCR analysis of clock gene expression in livers from wild-type and Egr1 null mice subjected to daytime feeding. (d) qRT-PCR analysis of clock gene expression in livers from wild-type and Egr1 null mice subjected to LD reversal. Data are shown as the mean ± s.d. *P < 0.05, wild-type versus null mice.
Discussion
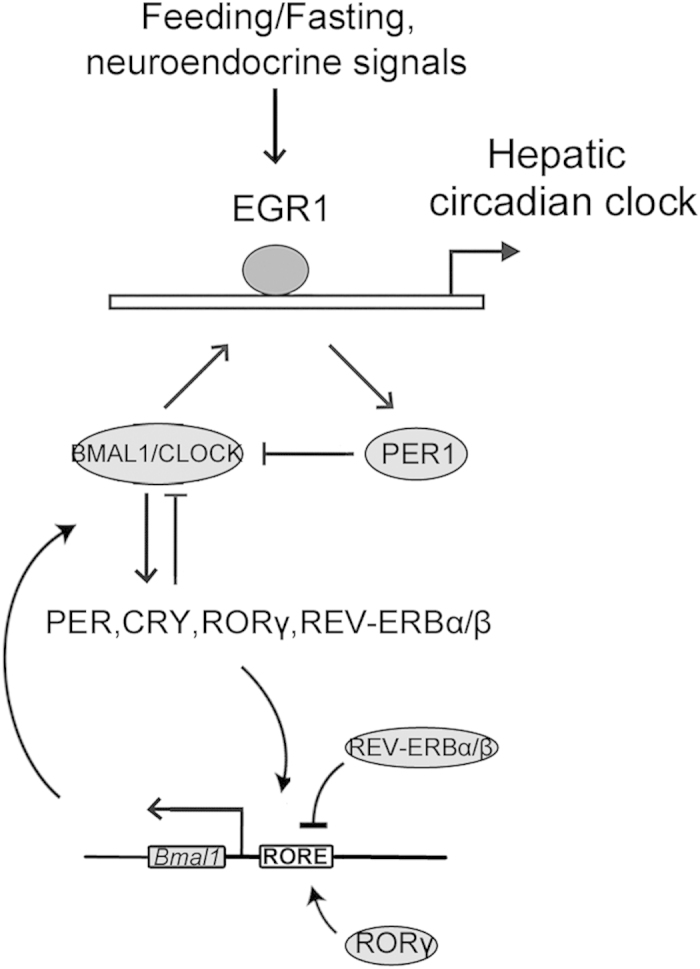
As an early growth response factor, EGR1 may mediate the central signals rapidly to maintain proper oscillation of the peripheral clocks. EGR1 is involved in the regulation and development of multiple diseases such as pulmonary inflammation, dilated cardiomyopathy, angiogenesis, insulin resistance and tumorigenesis36,37,38,39,40,41. Our studies revealed that EGR1 is required for the proper amplitudes of the rhythms of several clock gens, including Bmal1, Per1, Per2 and Rev-erbs. Egr1 itself is expressed in a circadian manner in the liver and has a phase relationship with components of the core clock gene Per1. EGR1 binds to the promoter of the Per1 gene to activate its transcription. Per1 accumulation may lead to the repression of Per2 and Rev-erbs by inhibiting BMAL1/CLOCK activity. The repression of REV-ERBs may lead to the robust oscillation of Bmal1. Furthermore, BMAL1 binds and activates Egr1 transcription. This feedback loop of EGR1/PER1/BMAL1/EGR1 could potentially help the liver clock keep pace with the master clock (Fig. 8). Although we found the altered expression of Bmal1, Per2 and Rev-Erbs by EGR1 is dependent on PER1 activation, whether other factors also mediate the regulation of these clock genes by EGR1 cannot be excluded. Whether EGR1 regulates the expression of other clock genes directly in addition to Per1 also cannot be excluded.
Figure 8. Model for the role of EGR1 in regulating circadian clock function.
The proper amplitudes of the molecular clock are crucial for the operation of the body’s biological clock, but the significance of the amplitude is not well understood. In Drosophila, the circadian amplitude is modulated by temperature and can regulate photoperiodic responses42. In Neurospora, amplitude variation has been associated with circadian period mutants43. In mammals, disruption of circadian amplitude may be related to phase perturbation, instability of circadian rhythms and other homeostatic processes15,16,17,18. Previous reports have also shown that high-amplitude rhythms are more difficult to shift than are low-amplitude rhythms42. This difficulty in shifting is based on the theory of limit cycle oscillators, where a perturbation of similar strength changes the phase of an oscillator with high amplitude harder than one with lower amplitude because the perturbation represents a larger fraction of the radius of the circle44. Vanderleest et al.’s findings show that large phase shifts respond in high-amplitude rhythms in slices from short days and small shifts respond in low-amplitude rhythms in slices from long days, which is in contrast to previous reports45. These authors have explained that in long day length, with a wide phase distribution, neurons have a more diverse phase shifting response to a light input signal, while in short day length, with a narrow phase distribution, neurons may respond more coherently, resulting in a larger overall shift45. According to the previous reports, we hypothesize that the amplitudes of clock gene rhythms might be related to the phase period. A deficiency in EGR1 can affect peripheral clock homeostasis by disrupting the amplitudes of peripheral oscillators. We also found that inhibiting hepatic EGR1 expression altered the phase of Per1 and Rev-erbβ gene rhythms slightly, as shown in Fig. 5a,b. These results suggest that disrupting the oscillation amplitudes of the peripheral clocks by Egr1 deletion might contribute to the instability of peripheral clock oscillators and increase their sensitivity to phase perturbation. Previous reports also indicate that strong clocks make the oscillatory system more rigid and relax faster in response to a perturbation, while weak clocks make the oscillatory system less rigid and result in the enlargement of the entrainment range46,47. In old age, the degradation of circadian rhythms is normally accompanied by both loss of amplitude and fragmentation of clock rhythms17. Thus, although we could not find published data on Egr1 levels in elder versus young individuals, we speculate that disruption of Egr1 oscillation may mediate the age-induced deterioration of peripheral clock rhythms.
Perturbed clock function has been implicated in sleep disorders and is associated with an increased risk of metabolic diseases. Epidemiological studies have revealed that shift workers are more predisposed to elevated triglycerides, HDL cholesterol levels and obesity than day workers48. Remarkably, the disruption of clock function in rodents leads to obesity and impaired glucose, lipid and cholesterol homeostasis. For example, Clock mutant mice present obesity, dyslipidemia and hepatic steatosis49, and Bmal1 null mice display reduced glucose tolerance and elevated circulating FFA and cholesterol levels50. Certain nuclear factors, including PPARs, PGC1α, GR and BAF60A, can link the metabolic pathways and the circadian clock at the transcriptional level51,52,53. Thus, the relationship between the circadian clock and these metabolic pathways would represent a novel target for studies of the pathogenesis of metabolic diseases.
EGR1 has been implicated in the regulation of key metabolic processes, including adipocyte insulin resistance, energy storage, obesity development and insulin biosynthesis39,40,54,55. EGR1 has been reported to regulate hepatic gluconeogenesis and cholesterol biosynthesis in the liver24,25. Adipocyte EGR1 was reported to regulate insulin resistance, energy expenditure and obesity54. Our results also show that Egr1 is expressed in a circadian manner in WAT. Further studied are required to elucidate whether EGR1 is involved in the integration of the circadian clock and whole-body energy metabolism. Time-restricted feeding was reported to prevent metabolic diseases in mice that were fed a high-fat diet and represents a preventative and therapeutic intervention against diverse nutritional challenges56,57. These reports also suggest that EGR1 expression may orchestrate these metabolic processes during time-restricted feeding.
In conclusion, we have identified that EGR1, an early growth response factor, is a critical transcription factor that regulates the hepatic clock circuit. Investigating the role of EGR1 in the integration of the circadian clock and whole-body energy metabolism could be interesting in future studies.
Methods
Materials
Anti-EGR1 antibody was purchased from Santa Cruz Biotech, anti-BMAL1 and anti-CLOCK antibodies were obtained from Abcam, anti-PER1 antibody was obtained from Pierce, anti-GAPDH antibody was obtained from KangChen Biotech (Shanghai, China), and anti-β-ACTIN antibody was obtained from Boster Biotech (Wuhan, China). Invivofectamine 2.0 reagent was obtained from Invitrogen. The donor equine serum was purchased from Hyclone.
mRNA and protein expression analysis
Total RNA was isolated using TRIzol reagent (TaKaRa), reverse transcribed, and analyzed by quantitative PCR (qPCR) using SYBR Green and an ABI 7300 system (Applied Biosystems, Carlsbad, CA). A complete list of PCR primers is shown in Supplementary Table 1. For protein analysis, we lysed cells or homogenized tissues directly in RIPA buffer, and then centrifuged them at 4 °C for 10 min at 13,200 × g. The resulting supernatant fraction was separated by SDS-PAGE and immunoblotted with the indicated antibodies. Immunoreactivity was detected using Kodak X-OMAT film (Kodak) or a MiniChemi Imager (SageCreation, Beijing, China). The intensities of the bands were quantified using NIH ImageJ software. All the proteins were normalized to the internal control β-ACTIN or GAPDH.
Animal experiments
All animal experiments were performed after the approval from the the Laboratory Animal Care Committee at Nanjing University. Animal welfare and experimental procedures were carried out in accordance with the Guide for the Care and Use of Laboratory Animals (Ministry of Science and Technology of China, 2006) and related ethical regulations of Nanjing University. Egr1 KO mice were produced as described previously58. All mice used in this study were males at 10–12 weeks of age. To analyze EGR1 expression in various tissues, C57/Bl6J (B6) mice were housed in a 12-h light/12-h dark cycle (light/dark, 12:12) in a temperature- and humidity-controlled environment and were fed ad libitum. Zeitgeber time zero (ZT0) referred to lights on time. Tissues from five mice were dissected every 4 h for 24 h and subsequently processed for qRT-PCR and immunoblot analysis. To analyze gene expression in wild-type and Egr1 null mice, five mice of each genotype were euthanized every six hours. Tissues were immediately frozen and subsequently processed for qPCR. To analyze gene expression in wild-type and Bmal1 null mice, the mice were kept under light:dark (LD) 12:12 h and subsequently subjected to constant darkness for 36 h. To analyze gene expression after alterations of light cues, the mice were transferred to a completely reversed LD cycle for ten days. For restricted feeding, the mice were fed exclusively at night or day for ten days, and then the livers from five mice were dissected every 4 h for 24 h and subsequently processed for qRT-PCR.
siRNA injection in vivo
B6 mice were injected intravenously with 200 μL of Egr1 siRNA or Scrb siRNA (70 mg) and Invivofectamine 2.0 reagent (Invitrogen). To ensure that the siRNA was concentrated in the liver, the siRNA was labeled by cholesterol59. The use of Invivofectamine 2.0 as the transfection reagent in vivo can further increase the concentration of siRNA in the liver without affecting other tissues. The mice were injected twice at 4-day intervals (8 mg/kg) and were then sacrificed 4 days after the last injection at the indicated timepoints. siRNA sequences are shown in Supplementary Table 1.
siRNA and plasmid transfection
For siRNA transfection, primary hepatocytes or mouse AML-12 hepatocytes were transfected siRNA based on a Scrb sequence or with siRNA specific for Per1, using Lipofectamine 2000 (Invitrogen) according to the manufacturer’s protocols. siRNA sequences are shown in Supplementary Table 1. For plasmid transfection, mouse AML-12 hepatocytes were transfected with BMAL1 and CLOCK plasmids or control PCDNA3 plasmid, cells were processed for qRT-PCR or immunoblot analysis after 48 hours of transfection.
Serum shock
The mouse liver cell line AML-12 was transduced with corresponding adenoviruses or siRNA and was then established and maintained in DMEM/F12 supplemented with 10% FBS. For serum shock, media of confluent cultures were replaced with DMEM/F12 plus 50% horse serum (t = 0). After 2 h, the cells were washed once with PBS and incubated with serum-free medium. Total RNA was extracted at the indicated time points and processed for qRT-PCR analysis using 36B4 as a normalization control.
Reporter gene assays
Reporter gene assays were performed in 293T cells. In a typical experiment, 100 ng of Per1 reporter plasmid or mutant plasmid was mixed with 400 or 800 ng of the expression construct for EGR1. Equal amounts of DNA were used for all transfection combinations by adding the appropriate vector DNA. To control for transfection efficiency, cells were co-transfected with the PRL plasmid (10 ng). Relative luciferase activities were determined 48 h following transfection using the Dual-Luciferase assay system (Promega) according to the manufacturer’s protocol. All transfection experiments were performed in triplicate.
ChIP assay
Chromatin immunoprecipitation was performed essentially as described by Upstate Biotechnology. Briefly, mouse AML-12 cells were injected with GFP or EGR1 adenoviruses for 48 h. For in vivo ChIP, mouse liver samples were collected at the corresponding timepoints. Chromatin lysates were prepared, pre-cleared with Protein-A/G agarose beads, and immunoprecipitated with antibodies against the corresponding protein or control mouse IgG (Santa Cruz Biotech) in the presence of BSA and salmon sperm DNA. Beads were extensively washed before reverse cross-linking. DNA was purified using a PCR purification kit (Qiagen) and subsequently analyzed by PCR or qPCR.
Statistical analysis
All the experiments were performed in triplicate. The data are presented as the mean ± S.D. We performed statistical comparisons with unpaired two-tailed Student’s t-test. P < 0.05 was considered statistically significant.
Additional Information
How to cite this article: Tao, W. et al. EGR1 regulates hepatic clock gene amplitude by activating Per1 transcription. Sci. Rep. 5, 15212; doi: 10.1038/srep15212 (2015).
Supplementary Material
Acknowledgments
We thank Prof. Steven Reppert (University of Massachusetts Medical School, Worcester, MA, USA) for providing the mPer1 promoter. This work was supported by grants from the National Basic Research Program of China (973 program, 2012CB524900 to CJL), National Key Technology R&D Program (2011BAI15B02 to CJL), National Natural Science Foundation of China (31171306 and 31371373 to BX) and Nature Science Foundation of Jiangsu Province (BK2011568 to BX).
Footnotes
Author Contributions W.T. and C.J.L. designed the experiments; W.T., J.W., Q.Z., S.S.L., S.J. and C.J. performed the experiments; Y.X., B.X. and J.D. reviewed and edited the manuscript; W.T. and C.J.L. analyzed data; and W.T. and C.J.L. wrote the paper.
References
- King D. P. & Takahashi J. S. Molecular genetics of circadian rhythms in mammals. Annu Rev Neurosci 23, 713–742 (2000). [DOI] [PubMed] [Google Scholar]
- Lowrey P. L. & Takahashi J. S. Genetics of the mammalian circadian system: Photic entrainment, circadian pacemaker mechanisms, and posttranslational regulation. Annu Rev Genet 34, 533–562 (2000). [DOI] [PubMed] [Google Scholar]
- Reppert S. M. & Weaver D. R. Coordination of circadian timing in mammals. Nature 418, 935–941 (2002). [DOI] [PubMed] [Google Scholar]
- Rutter J., Reick M. & McKnight S. L. Metabolism and the control of circadian rhythms. Annu Rev Biochem 71, 307–331 (2002). [DOI] [PubMed] [Google Scholar]
- Tu B. P. & McKnight S. L. Metabolic cycles as an underlying basis of biological oscillations. Nat Rev Mol Cell Biol 7, 696–701 (2006). [DOI] [PubMed] [Google Scholar]
- Wijnen H. & Young M. W. Interplay of circadian clocks and metabolic rhythms. Annu Rev Genet 40, 409–448 (2006). [DOI] [PubMed] [Google Scholar]
- Maury E., Ramsey K. M. & Bass J. Circadian rhythms and metabolic syndrome: from experimental genetics to human disease. Circ Res 106, 447–462 (2010). [DOI] [PMC free article] [PubMed] [Google Scholar]
- Korencic A. et al. Timing of circadian genes in mammalian tissues. Sci Rep 4, 5782 (2014). [DOI] [PMC free article] [PubMed] [Google Scholar]
- Schibler U., Ripperger J. & Brown S. A. Peripheral circadian oscillators in mammals: time and food. J Biol Rhythms 18, 250–260 (2003). [DOI] [PubMed] [Google Scholar]
- Schibler U. & Sassone-Corsi P. A web of circadian pacemakers. Cell 111, 919–922 (2002). [DOI] [PubMed] [Google Scholar]
- Zylka M. J. et al. Molecular analysis of mammalian timeless. Neuron 21, 1115–1122 (1998). [DOI] [PubMed] [Google Scholar]
- Kume K. et al. mCRY1 and mCRY2 are essential components of the negative limb of the circadian clock feedback loop. Cell 98, 193–205 (1999). [DOI] [PubMed] [Google Scholar]
- Preitner N. et al. The orphan nuclear receptor REV-ERBalpha controls circadian transcription within the positive limb of the mammalian circadian oscillator. Cell 110, 251–260 (2002). [DOI] [PubMed] [Google Scholar]
- Sato T. K. et al. A functional genomics strategy reveals Rora as a component of the mammalian circadian clock. Neuron 43, 527–537 (2004). [DOI] [PubMed] [Google Scholar]
- Johnson C. H. Forty years of PRCs—what have we learned? Chronobiol Int 16, 711–743 (1999). [DOI] [PubMed] [Google Scholar]
- Vitaterna M. H. et al. The mouse Clock mutation reduces circadian pacemaker amplitude and enhances efficacy of resetting stimuli and phase-response curve amplitude. Proc Natl Acad Sci USA 103, 9327–9332 (2006). [DOI] [PMC free article] [PubMed] [Google Scholar]
- Hofman M. A. & Swaab D. F. Living by the clock: the circadian pacemaker in older people. Ageing Res Rev 5, 33–51 (2006). [DOI] [PubMed] [Google Scholar]
- Monk T. H. Aging human circadian rhythms: conventional wisdom may not always be right. J Biol Rhythms 20, 366–374 (2005). [DOI] [PubMed] [Google Scholar]
- Hamilton T. B., Borel F. & Romaniuk P. J. Comparison of the DNA binding characteristics of the related zinc finger proteins WT1 and EGR1. Biochemistry 37, 2051–2058 (1998). [DOI] [PubMed] [Google Scholar]
- Silverman E. S. & Collins T. Pathways of Egr-1-mediated gene transcription in vascular biology. Am J Pathol 154, 665–670 (1999). [DOI] [PMC free article] [PubMed] [Google Scholar]
- Mostecki J., Showalter B. M. & Rothman P. B. Early growth response-1 regulates lipopolysaccharide-induced suppressor of cytokine signaling-1 transcription. J Biol Chem 280, 2596–2605 (2005). [DOI] [PubMed] [Google Scholar]
- Yao J., Mackman N., Edgington T. S. & Fan S. T. Lipopolysaccharide induction of the tumor necrosis factor-alpha promoter in human monocytic cells. Regulation by Egr-1, c-Jun, and NF-kappaB transcription factors. J Biol Chem 272, 17795–17801 (1997). [DOI] [PubMed] [Google Scholar]
- Virolle T. et al. The Egr-1 transcription factor directly activates PTEN during irradiation-induced signalling. Nat Cell Biol 3, 1124–1128 (2001). [DOI] [PubMed] [Google Scholar]
- Shen N. et al. The Constitutive Activation of Egr-1/C/EBPa Mediates the Development of Type 2 Diabetes Mellitus by Enhancing Hepatic Gluconeogenesis. Am J Pathol 185, 513–523 (2015). [DOI] [PubMed] [Google Scholar]
- Gokey N. G., Lopez-Anido C., Gillian-Daniel A. L. & Svaren J. Early growth response 1 (Egr1) regulates cholesterol biosynthetic gene expression. J Biol Chem 286, 29501–29510 (2011). [DOI] [PMC free article] [PubMed] [Google Scholar]
- Kim S. H. et al. Egr1 regulates lithium-induced transcription of the Period 2 (PER2) gene. Biochim Biophys Acta 1832, 1969–1979 (2013). [DOI] [PubMed] [Google Scholar]
- Fustin J. M. et al. Egr1 involvement in evening gene regulation by melatonin. FASEB J 23, 764–773 (2009). [DOI] [PubMed] [Google Scholar]
- Resuehr H. E., Resuehr D. & Olcese J. Induction of mPer1 expression by GnRH in pituitary gonadotrope cells involves EGR-1. Mol Cell Endocrinol 311, 120–125 (2009). [DOI] [PubMed] [Google Scholar]
- Panda S. et al. Coordinated transcription of key pathways in the mouse by the circadian clock. Cell 109, 307–320 (2002). [DOI] [PubMed] [Google Scholar]
- Hughes M. E. et al. Harmonics of circadian gene transcription in mammals. PLoS Genet 5, e1000442 (2009). [DOI] [PMC free article] [PubMed] [Google Scholar]
- Yan J., Wang H., Liu Y. & Shao C. Analysis of gene regulatory networks in the mammalian circadian rhythm. PLoS Comput Biol 4, e1000193 (2008). [DOI] [PMC free article] [PubMed] [Google Scholar]
- Bozek K. et al. Regulation of clock-controlled genes in mammals. PLoS One 4, e4882 (2009). [DOI] [PMC free article] [PubMed] [Google Scholar]
- Balsalobre A., Damiola F. & Schibler U. A serum shock induces circadian gene expression in mammalian tissue culture cells. Cell 93, 929–937 (1998). [DOI] [PubMed] [Google Scholar]
- Kilduff T. S. et al. Characterization of the circadian system of NGFI-A and NGFI-A/NGFI-B deficient mice. J Biol Rhythms 13, 347–357 (1998). [DOI] [PubMed] [Google Scholar]
- Damiola F. et al. Restricted feeding uncouples circadian oscillators in peripheral tissues from the central pacemaker in the suprachiasmatic nucleus. Genes Dev 14, 2950–2961 (2000). [DOI] [PMC free article] [PubMed] [Google Scholar]
- Shen N. et al. Cigarette smoke-induced pulmonary inflammatory responses are mediated by EGR-1/GGPPS/MAPK signaling. Am J Pathol 178, 110–118 (2011). [DOI] [PMC free article] [PubMed] [Google Scholar]
- Lucas T. et al. Overexpression of Egr-1 is associated with dilated cardiomyopathy and induces cardiac cell apoptosis. The FASEB Journal 21, A13 (2007). [Google Scholar]
- Khachigian L. M. Early growth response-1: blocking angiogenesis by shooting the messenger. Cell Cycle 3, 10–11 (2004). [PubMed] [Google Scholar]
- Shen N. et al. An early response transcription factor, Egr-1, enhances insulin resistance in type 2 diabetes with chronic hyperinsulinism. Journal of Biological Chemistry 286, 14508–14515 (2011). [DOI] [PMC free article] [PubMed] [Google Scholar]
- Yu X. et al. Egr‐1 decreases adipocyte insulin sensitivity by tilting PI3K/Akt and MAPK signal balance in mice. The EMBO journal 30, 3754–3765 (2011). [DOI] [PMC free article] [PubMed] [Google Scholar]
- Abdulkadir S. A. et al. Impaired prostate tumorigenesis in Egr1-deficient mice. Nat Med 7, 101–107 (2001). [DOI] [PubMed] [Google Scholar]
- Pittendrigh C. S., Kyner W. T. & Takamura T. The amplitude of circadian oscillations: temperature dependence, latitudinal clines, and the photoperiodic time measurement. J Biol Rhythms 6, 299–313 (1991). [DOI] [PubMed] [Google Scholar]
- Lakin-Thomas P. L., Brody S. & Cote G. G. Amplitude model for the effects of mutations and temperature on period and phase resetting of the Neurospora circadian oscillator. J Biol Rhythms 6, 281–297 (1991). [DOI] [PubMed] [Google Scholar]
- Aschoff J. & Pohl H. Phase relations between a circadian rhythm and its zeitgeber within the range of entrainment. Naturwissenschaften 65, 80–84 (1978). [DOI] [PubMed] [Google Scholar]
- vanderLeest H. T., Rohling J. H., Michel S. & Meijer J. H. Phase shifting capacity of the circadian pacemaker determined by the SCN neuronal network organization. PLoS One 4, e4976 (2009). [DOI] [PMC free article] [PubMed] [Google Scholar]
- Abraham U. et al. Coupling governs entrainment range of circadian clocks. Mol Syst Biol 6, 438 (2010). [DOI] [PMC free article] [PubMed] [Google Scholar]
- Granada A. E., Bordyugov G., Kramer A. & Herzel H. Human chronotypes from a theoretical perspective. PLoS One 8, e59464 (2013). [DOI] [PMC free article] [PubMed] [Google Scholar]
- Karlsson B., Knutsson A. & Lindahl B. Is there an association between shift work and having a metabolic syndrome? Results from a population based study of 27,485 people. Occup Environ Med 58, 747–752 (2001). [DOI] [PMC free article] [PubMed] [Google Scholar]
- Turek F. W. et al. Obesity and metabolic syndrome in circadian Clock mutant mice. Science 308, 1043–1045 (2005). [DOI] [PMC free article] [PubMed] [Google Scholar]
- Shimba S. et al. Deficient of a clock gene, brain and muscle Arnt-like protein-1 (BMAL1), induces dyslipidemia and ectopic fat formation. PLoS One 6, e25231 (2011). [DOI] [PMC free article] [PubMed] [Google Scholar]
- Liu C., Li S., Liu T., Borjigin J. & Lin J. D. Transcriptional coactivator PGC-1alpha integrates the mammalian clock and energy metabolism. Nature 447, 477–481 (2007). [DOI] [PubMed] [Google Scholar]
- Tao W. et al. SWItch/sucrose nonfermentable (SWI/SNF) complex subunit BAF60a integrates hepatic circadian clock and energy metabolism. Hepatology 54, 1410–1420 (2011). [DOI] [PubMed] [Google Scholar]
- Lin J. D., Liu C. & Li S. Integration of energy metabolism and the mammalian clock. Cell Cycle 7, 453–457 (2008). [DOI] [PubMed] [Google Scholar]
- Zhang J. et al. Dietary obesity-induced Egr-1 in adipocytes facilitates energy storage via suppression of FOXC2. Sci Rep 3, 1476 (2013). [DOI] [PMC free article] [PubMed] [Google Scholar]
- Muller I., Rossler O. G., Wittig C., Menger M. D. & Thiel G. Critical role of Egr transcription factors in regulating insulin biosynthesis, blood glucose homeostasis, and islet size. Endocrinology 153, 3040–3053 (2012). [DOI] [PubMed] [Google Scholar]
- Chaix A., Zarrinpar A., Miu P. & Panda S. Time-restricted feeding is a preventative and therapeutic intervention against diverse nutritional challenges. Cell Metab 20, 991–1005 (2014). [DOI] [PMC free article] [PubMed] [Google Scholar]
- Hatori M. et al. Time-restricted feeding without reducing caloric intake prevents metabolic diseases in mice fed a high-fat diet. Cell Metab 15, 848–860 (2012). [DOI] [PMC free article] [PubMed] [Google Scholar]
- Wu X. et al. Mechano-sensitive transcriptional factor Egr-1 regulates insulin-like growth factor-1 receptor expression and contributes to neointima formation in vein grafts. Arterioscler Thromb Vasc Biol 30, 471–476 (2010). [DOI] [PubMed] [Google Scholar]
- Wolfrum C. et al. Mechanisms and optimization of in vivo delivery of lipophilic siRNAs. Nat Biotechnol 25, 1149–1157 (2007). [DOI] [PubMed] [Google Scholar]
Associated Data
This section collects any data citations, data availability statements, or supplementary materials included in this article.


