

Abstract
Background
Atherosclerosis is a chronic inflammatory disorder, and several studies have demonstrated a positive association between plasma serum amyloid A (SAA) levels and cardiovascular disease risk. The aim of the study was to examine whether SAA has a role in atherogenesis, the underlying basis of most cardiovascular disease.
Methods and Results
Mice globally deficient in acute-phase isoforms Saa1 and Saa2 (Saa−/−) were crossed to Ldlr−/− mice (Saa−/−Ldlr−/−). Saa−/−Ldlr−/− mice demonstrated a 31% reduction in lesional area in the ascending aorta but not in the aortic root or innominate artery after consuming a high-fat, high-cholesterol Western-type diet for 6 weeks. The lesions were predominantly macrophage foam cells. The phenotype was lost in more mature lesions in mice fed a Western-type diet for 12 weeks, suggesting that SAA is involved in early lesion development. The decreased atherosclerosis in the Saa−/−Ldlr−/− mice occurred despite increased levels of blood monocytes and was independent of plasma lipid levels. SAA is produced predominantly by hepatocytes and macrophages. To determine which source of SAA may have a dominant role in lesion development, bone marrow transplantation was performed. Ldlr−/− mice that received bone marrow from Saa−/−Ldlr−/− mice had slightly reduced ascending aorta atherosclerosis compared with Saa−/−Ldlr−/− mice receiving bone marrow from Ldlr−/− mice, indicating that the expression of SAA by macrophages may have an important influence on atherogenesis.
Conclusions
The results indicate that SAA produced by macrophages promotes early lesion formation in the ascending aorta.
Keywords: atherosclerosis, macrophages, monocytes, serum amyloid A
Serum amyloid A (SAA) is a high-density lipoprotein (HDL)–associated apolipoprotein expressed primarily by hepatocytes and macrophages. The Saa superfamily contains 4 members, with only isoforms 1 and 2 being acute-phase reactants. Expression of SAA is induced by proinflammatory cytokines, including interleukin (IL) 6, tumor necrosis factor α, and IL-1β.1,2 Chronic expression of SAA is associated with inflammatory diseases such as cardiovascular disease, rheumatoid arthritis, and obesity.3–5 Several studies have demonstrated a positive correlation between levels of acute-phase proteins, such as C-reactive protein and SAA, and the risk of development of cardiovascular disease and have suggested that C-reactive protein and SAA may be biomarkers for cardiovascular disease. Plasma levels of SAA were prognostic of 3-year coronary events in patients with coronary artery disease.6,7 Expression of SAA was increased at the site of plaque rupture in the coronary arteries of patients with acute myocardial infarction compared with the aorta, which was used as the internal negative control, suggesting that SAA may contribute to plaque instability.8 Studies investigating a subgroup of patients with normal levels of low-density lipoprotein (LDL) found that elevated serum levels of C-reactive protein and SAA were risk factors for patients with LDL levels <130 mg/dL.6 This suggests that SAA may be a useful marker of cardiovascular disease, particularly for patients who do not demonstrate high cholesterol levels but who are still at risk for future cardiovascular events.
Several studies have investigated the role of SAA in atherosclerosis using various mouse models. Plasma levels of SAA are increased in LDL receptor–deficient (Ldlr−/−) mice fed a high-fat diet (21% fat wt/wt) with or without added cholesterol (0.15% wt/wt) for 5 and 10 weeks compared with those fed a chow diet.3 Plasma levels of SAA after 5 weeks of Western-type diet (WTD) feeding in Ldlr−/− mice significantly correlated with lesional area of the aortic root after 10 weeks on a WTD, suggesting that systemic SAA levels may be predictive of atherosclerosis development and may participate in lesion development.3 SAA is present in atherosclerotic lesions at all stages of development in both Ldlr−/− and apolipoprotein E–deficient (ApoE−/−) mice.3,9–11 The viral-vector–mediated hepatic overexpression of human SAA1 in ApoE−/− mice has suggested that SAA may be proatherogenic,11 although the absence of SAA in ApoE−/− mice had no effect on mature lesion formation,9 as did the transgenic overexpression of SAA1 in adipocytes.12 SAA was also shown to induce macrophage cholesterol uptake and expression of the scavenger receptor lectin-like oxidized low-density protein receptor 1 (LOX-1) in vitro via formyl peptide receptor, a known receptor for SAA.13,14 It also induces proteoglycan and glycosaminoglycan synthesis in vascular smooth muscle cells in vitro and in the aorta in vivo by upregulating transforming growth factor-β production.15 In addition, SAA is a chemoattractant for monocytes and neutrophils and induces the expression of other chemokines such as monocyte chemoattractant protein-1 (MCP-1) and macrophage inflammatory protein 1α.16,17 Incubation of human macrophages with recombinant human SAA upregulates mature IL-1β and cathepsin B production and activation of the NLRP3 inflammasome,18 which is required for the development of atherosclerosis in mice.19 Together, these in vitro and in vivo studies suggest that SAA may be proatherogenic.
SAA is a secreted apolipoprotein produced primarily by hepatocytes and macrophages and is found in the plasma associated with HDL. Although it has been suggested that SAA may have a proatherogenic role in lesion development, the individual roles of SAA produced by macrophages and hepatocytes in the development of atherosclerosis remain unexplored.
The goal of this study was to examine the effect of the absence of the acute-phase SAA isoforms SAA1 and SAA2 on lesion formation in Ldlr−/− mice, looking at both early and late lesion development, and to further elucidate the role of the individual cellular sources of SAA in atherogenesis. Ldlr−/− mice have several differences compared with ApoE−/− mice, the most notable being their lipoprotein profiles, with LDL being the major lipoprotein that accumulates in the plasma in the Ldlr−/− mouse model, similar to humans. In addition, macrophages express apoE, which promotes cellular cholesterol efflux. We showed that in the absence of SAA, early lesion development is decreased in the ascending aorta but not in the aortic root or innominate artery, independent of effects on plasma lipids and despite an increase in blood monocyte levels. We also demonstrated a novel role for macrophage-derived SAA in atherogenesis.
Materials and Methods
Materials
All chemicals were purchased from Sigma-Aldrich unless otherwise noted. DMEM and RPMI-1640 media were purchased from Fisher Scientific.
All antibodies were purchased from eBioscience except as follows. Anti-CD68 APC (FA-11) was purchased from Biolegend. Goat anti-rabbit antibody (A-4914) was purchased from Sigma-Aldrich (A-4914). Rat anti-mouse MOMA-2 (MCA519G) was purchase from AbD Serotec. Rabbit anti-rat IgG H+L chain AF594 was purchased from Invitrogen.
Primers for Real-Time Polymerase Chain Reaction
All primers were purchased from SA Biosciences, with the exception of HPRT. The HPRT primer sequences were as follows: forward, 5′-ACC TCT CGA AGT GTT GGA TA-3′, and reverse, 5′-CAA CAA CAA ACT TGT CTG GA-3′.
Murine Studies
Mice globally deficient in both SAA1 and SAA2 (Saa−/−) on the C57BL/6 background were generated as described.9,20 Ldlr−/− mice, also on the C57BL/6 background, were purchased from Jackson Laboratory (stock number 002207; Bar Harbor, ME) and bred in-house. Saa−/− mice were crossed to Ldlr−/− mice, with the genotype of Saa−/−Ldlr−/− mice verified by genomic polymerase chain reaction (PCR) using tail DNA. For all experiments, only female mice were used. Mice were maintained on chow diet no. 2918 (4% fat, 0% cholesterol) from Harlan Teklad until aged 8 weeks, when they were switched to a high-fat, high cholesterol WTD (21% milk fat, 0.2% cholesterol wt/wt; TD.88137 from Harlan Teklad) for 6 or 12 weeks. All mice were housed in a specific pathogen-free facility and used in accordance with National Institutes of Health guidelines and protocols approved by the institutional animal care and use committee at the University of Chicago.
Quantification and Histology of Atherosclerosis
Atherosclerosis was quantified as previously described.21 Briefly, mice were anesthetized and perfused with PBS for 2 minutes, followed by 4% paraformaldehyde/5% sucrose in PBS for 10 minutes. The heart, aortic arch, and its branching arteries were dissected and soaked in 4% paraformaldehyde/5% sucrose overnight at 4°C. The tissue was embedded in optimum cutting temperature compound (Sakura Finetek) and stored at −80°C. Tissue was sectioned into 10-μm cryosections using a Leica cryostat (Leica Microsystems) and stained with Gill’s hematoxylin (Fisher Scientific), oil red O, and fast green (Sigma-Aldrich). For the innominate artery, lesion area was quantitated in 4 cryosections located 150 to 450 μm above the point where the innominate artery fuses with aortic arch. For the ascending aorta, 3 cryosections were quantitated from the first 300 μm of the apex of the lesser curvature of the aortic arch. For the aortic root, 3 cryosections were quantitated beginning at the appearance of the valve leaflets and the first coronary artery. For all 3 sites, each of the cryosections quantitated was spaced by 100 μm and the average lesion size was calculated. Adjacent aortic sections were stained with hematoxylin and eosin using Gill’s hematoxylin (Fisher Scientific) and eosin. For trichrome staining, tissue was stained using Gomori’s trichrome method.22 All images were acquired on a Leica DM IRB microscope (Leica Microsystems) and analyzed using OpenLab 3.1.5 software (PerkinElmer).
Bone Marrow Transplantation Studies
Bone marrow was isolated from donors aged 8 to 12 weeks by flushing the femurs and tibias with RPMI-1640 media supplemented with 2% FCS, 1% penicillin–streptomycin, and 100 U/mL heparin. Red blood cells were lysed with ACK buffer, the hematopoietic cells were resuspended in sterile PBS, and 5×10⁶ cells were injected intravenously into recipients aged 8 to 12 weeks. Recipient mice were lethally irradiated using 2 doses of whole-body irradiation (500 rads each) from a cesium 137 source, with the first dose 24 hours prior to injection and the second on the morning of injection. Recipient mice received acidified water containing sulfamethoxazole and trimethoprim 1 week prior to and 2 weeks after injection. Recipient mice were fed a standard chow diet for 8 weeks to allow for reconstitution, after which they were fed a WTD for 6 weeks. The heart and aorta were isolated and analyzed, as described above.
Plasma Lipid and Lipoprotein Levels
Plasma levels of total cholesterol and triglycerides were measured in mice fasted for 3 hours using enzymatic colorimetric kits (Roche Diagnostics). Plasma lipoproteins were separated by fast-performance liquid chromatography using tandem Superose 6 columns (GE Healthcare), as described previously.23
Flow Cytometry
Flow cytometry was used to quantify blood monocytes and spleen macrophages. For all samples, cells were counted with a hemocytometer, and Fc receptors were blocked using anti-FcγRII/III antibody 2.4G2 prior to adding the fluorescent-tagged antibodies. For blood monocytes, mice were anesthetized and bled through the retro-orbital sinus. Red blood cells were lysed using red blood cell lysis buffer (eBioscience). Monocytes were stained with CD45.2 PE (104), CD115-APC (AFS98), and Ly6c PE-Cy7 (HK1.4). Total monocytes were defined as CD45.2+CD115hi and separated into Ly6chi and Ly6clo subsets. For splenocyte staining, spleens were manually disrupted, processed into a single-cell suspension in DMEM, supplemented with 5% FCS and 1% penicillin–streptomycin, and filtered through a 70-μm filter. Red blood cells were lysed with ACK lysis buffer. Splenocytes were stained with CD45.2 PE (104) and F4/80 PerCP (BM8) and fixed with 1% paraformaldehyde for a minimum of 1 hour. Cells were then permeabilized with 0.25% saponin and stained with CD68 APC (FA-11). Macrophages were defined as CD45.2+F4/80+CD68+. All percentages were normalized to CD45.2. Dead cells were excluded from all samples using fixable viability dye eFluor 450 (eBioscience). All flow cytometry data were collected on the LSR II flow cytometer (BD Biosciences) and analyzed using FlowJo software 10.0 (Tree Star).
Western Blot Analysis
Plasma from an individual mouse was loaded in each well of a 16% polyacrylamide gel. Proteins were separated using SDS-PAGE, transferred to Immobilon at 4°C using 20% methanol and 1x Tris-glycine. After blocking with 5% milk overnight at 4°C, the blots were probed with a rabbit anti-mouse SAA antibody (1:3000 dilution), as described previously,24 for 1 hour at room temperature, followed by goat anti-rabbit antibody (1:1000 dilution, A-4914) for 40 minutes at room temperature. Peroxidase enhanced chemiluminescence Western blotting substrate (Thermo Scientific Pierce) was used to visualize bands. The Western blot signal was quantified using FluorChem v2.0 Spot Denso software (ProteinSimple).
Immunofluorescent Staining of the Ascending Aorta
Perfusion-fixed tissues were used for immunofluorescent staining. Ascending aorta cryosections were soaked twice in distilled water for 15 minutes to remove the optimum cutting temperature compound, permeabilized with 0.15% Nonidet P40 substitute for 15 minutes, washed in PBS, and blocked with 10% FCS/PBS for 30 minutes at room temperature. Sections were stained with a 1:100 dilution of rat anti-mouse MOMA-2 (MCA519G) overnight at 4°C. Sections were then stained with a 1:1000 dilution of rabbit anti-rat IgG H+L chain AF594 for 1 hour and DAPI NucBlue Fixed Cell Stain (Invitrogen) for 7 minutes. Images were acquired on a Nikon Eclipse Ti microscope (Nikon Instruments Inc) and analyzed using ImageJ and OpenLab 3.1.5 software (PerkinElmer).
Quantitative Real-Time PCR
RNA was isolated from the aortic arch of Ldlr−/− and Saa−/−Ldlr−/− mice fed a WTD for 6 weeks by TRIzol (Invitrogen) extraction, according to the manufacturer’s protocol. Next, 1.5 μg of RNA was used to make cDNA using Superscript III (Invitrogen). Gene expression was quantified using real-time PCR with 2 μL of cDNA diluted 1:16 and SYBR green master mix (SA Biosciences, Qiagen). Gene expression was normalized to housekeeping gene HPRT.
Statistical Analysis
Results are presented as mean+SEM. Normality of the data was checked. When normally distributed, the data were analyzed by unpaired Student t test or 1-way ANOVA (for comparisons of ≥3) followed by Tukey’s multiple comparison test. When not normally distributed, the data were analyzed by Mann–Whitney U or Kruskal–Wallis test (for comparisons of ≥3) followed by Dunn’s post hoc test. All data were analyzed using GraphPad Prism 6 software for Macintosh (GraphPad Software, Inc). Results were considered statistically significant with a P value of <0.05.
Results
Plasma SAA Levels Were Modestly Elevated in Ldlr−/− Mice Fed a WTD
Feeding Ldlr−/− mice a high-fat, high-cholesterol WTD increased plasma levels of SAA 4-fold after 6 and 12 weeks of diet compared with mice fed control chow (Figure1). This finding is in agreement with the studies of Chait et al in Ldlr−/− mice3 and De Beer et al in ApoE−/− mice.9 This modest increase is in contrast to the 100- to 1000-fold increase observed in the acute-phase response, and the fold increase is roughly comparable with the increase in SAA in the plasma of patients with cardiovascular disease compared with healthy controls.6,7
Figure 1.
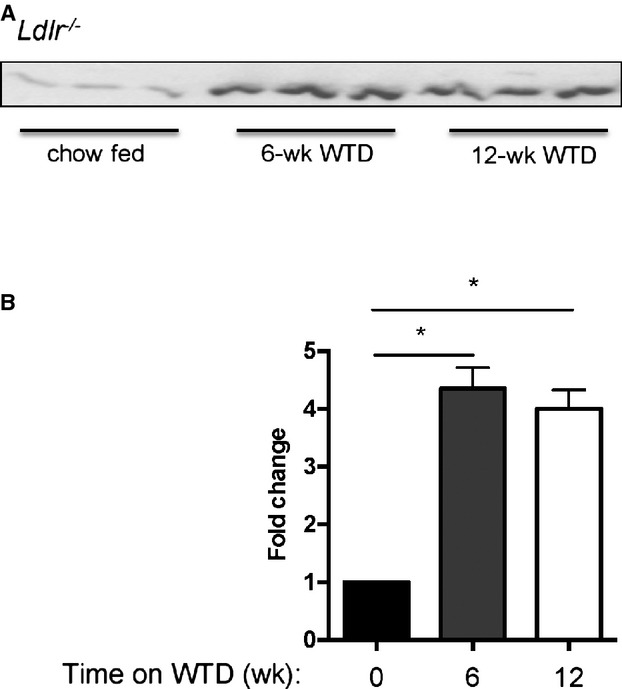
Plasma levels of SAA were increased in Ldlr−/− mice fed a WTD. Ldlr−/− mice were fed chow or a WTD for 6 or 12 weeks. SAA levels in the plasma were quantified by Western blot. A, Western blot image showing SAA expression in plasma. All samples were run on the same gel. B, Quantification of Western blot. n=3 per group *P<0.01. SAA indicates serum amyloid A; WTD, Western-type diet.
Early Atherosclerosis Decreased in the Ascending Aorta of Saa−/−Ldlr−/− Mice
To determine whether the absence of SAA would affect atherosclerosis, cross-sectional analysis was used to examine the ascending aorta, aortic root, and innominate artery in Saa−/−Ldlr−/− and Ldlr−/− mice fed a WTD for 6 or 12 weeks. The absence of SAA resulted in a 31% reduction in lesion size in the ascending aorta after 6 weeks of a WTD but had no effect on lesion size in the innominate artery and the aortic root (Figure2A). Histological analysis of the ascending aortic lesions in the mice fed a WTD for 6 weeks (Figure3) indicated that the lesions were almost completely composed of foam cells staining positive for oil red O, with little to no positive staining for collagen and/or connective tissue, as indicated by trichrome staining. To determine macrophage content, the ascending aorta from mice fed a WTD for 6 weeks was stained for the macrophage marker MOMA-2. In the absence of SAA, there was a reduction in MOMA-2+ lesional area consistent with the reduced atherosclerosis, and no difference was found when normalized to lesion area (percentage of MOMA-2+/lesional area) (Figure4). These data indicated that after 6 weeks of a WTD, lesions were in early stages of development and consisted primarily of macrophage foam cells.
Figure 2.

The absence of SAA reduces atherosclerosis in the ascending aorta. Saa−/−Ldlr−/− and Ldlr−/− mice were fed a Western-type diet for (A) 6 or (B) 12 weeks. Lesions in the ascending aorta, innominate artery, and aortic root were stained with oil red O, and cross-sectional area was quantified. Each dot represents an individual mouse. n=9 to 13 for each group in (A) and 8 to 11 for each group in (B). *P<0.02. SAA indicates serum amyloid A.
Figure 3.
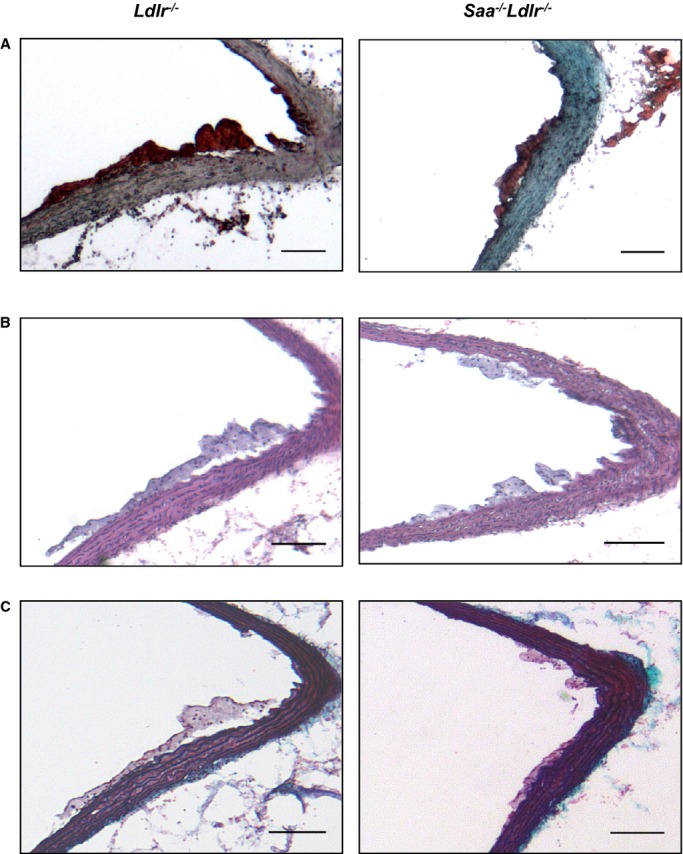
Histological staining of the ascending aorta in Ldlr−/− and Saa−/−Ldlr−/− mice. Representative (A) oil red O, (B) H&E, and (C) trichrome staining of the ascending aorta after 6 weeks of a Western-type diet. n=9 to 13 for oil red O staining and n=5 to 8 for H&E and trichrome staining. Scale bars: 100 μm. H&E indicates hematoxylin and eosin.
Figure 4.
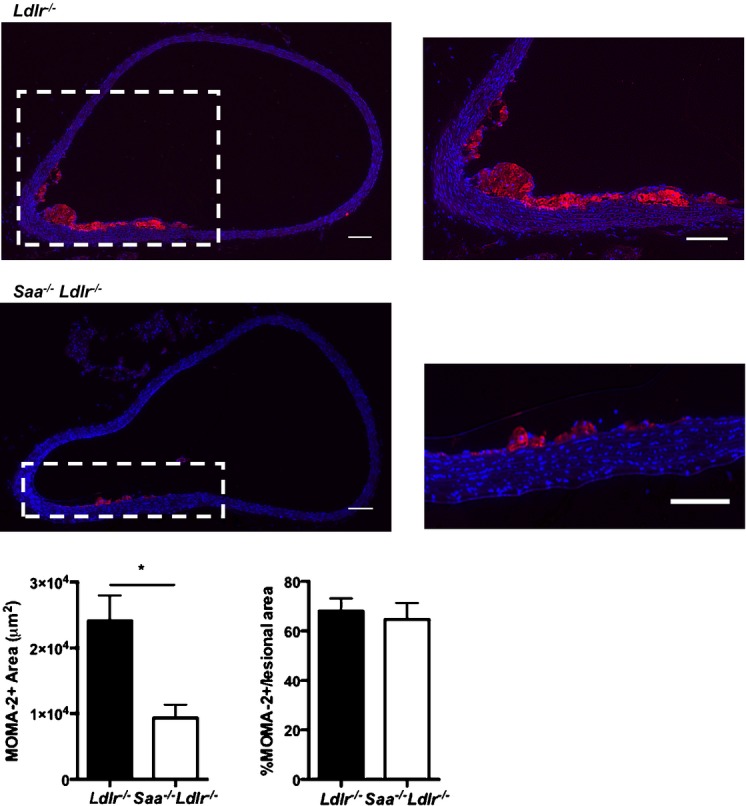
MOMA-2 staining of the ascending aorta in Saa−/−Ldlr−/− and Ldlr−/− mice fed a Western-type diet for 6 weeks. Shown are representative images with the magnified images of the region outlined in white shown on the right. DAPI is shown in blue and MOMA-2 is shown in red. Scale bars: 100 μm. MOMA-2+ area was quantitated and expressed as total area (right) or as percentage of total lesion area (left). n=7 to 8 per group. *P<0.005.
To determine the effect of SAA on more mature lesions, the mice were fed a WTD for 12 weeks; however, no difference in lesion area was observed at any of the 3 arterial sites (Figure2B). The ascending aorta lesions after 12 weeks of WTD were more complex, with an increase in collagen or connective tissue and the presence of a fibrous cap and necrotic core (Figure5). When the extent of necrosis in the ascending aorta after 12 weeks of a WTD in Saa−/−Ldlr−/− mice was compared with Ldlr−/− mice, no difference was found in the necrotic area (5338±2369 versus 6122±1558 μm2, P<0.78) or percentage of necrotic area/lesional area when quantified in hematoxylin and eosin–stained sections (n=9 per strain). Taken together, these results indicate that SAA participates in the development of early atherosclerotic lesions in a site-specific manner.
Figure 5.
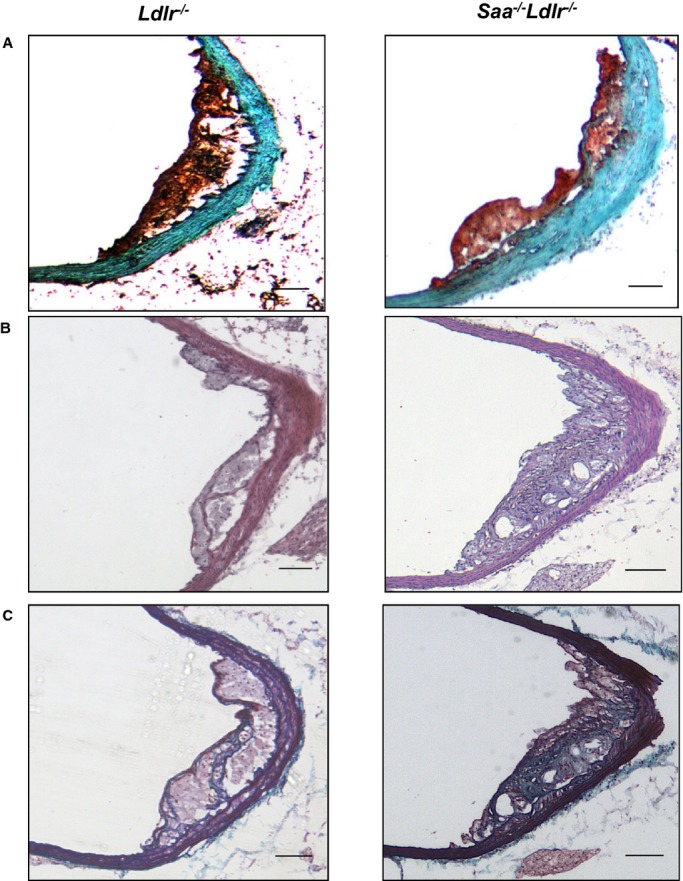
Histological staining of the ascending aorta in Ldlr−/− and Saa−/−Ldlr−/− mice after 12 weeks of a WTD. Representative (A) oil red O, (B) H&E, and (C) trichrome staining of the ascending aorta after 12 weeks of WTD. n=8 to 11 per group for oil red O staining and n=5 per group for H&E and trichrome staining. Scale bars: 100 μm. H&E indicates hematoxylin and eosin; WTD, Western-type diet.
Influence of SAA on Plasma Lipid Levels
To determine whether the moderate increase in SAA expression in the WTD-fed mice influences plasma lipids, cholesterol and triglyceride levels and lipoprotein classes in the plasma were measured. As expected, because SAA levels are barely detectable in chow-fed Ldlr−/− mice, there was no difference in plasma lipids in chow-fed Saa−/−Ldlr−/− and Ldlr−/− mice (Figure6A and 6B). In WTD-fed mice, plasma cholesterol levels were higher in Saa−/−Ldlr−/− mice after 12 weeks of diet (Figure6A), with increased levels of very low density lipoprotein (VLDL) and LDL cholesterol but decreased levels of HDL cholesterol (Figure6C). Although plasma triglyceride levels were higher in the WTD-fed Saa−/−Ldlr−/− mice compared with the Ldlr−/− mice, the difference was not significant (Figure6B). These data suggest that the influence of SAA on atherosclerosis is not dependent on its influence on plasma lipids.
Figure 6.

Plasma cholesterol, triglyceride, and lipoprotein levels in Saa−/−Ldlr−/− and Ldlr−/− mice fed chow or a WTD for 6 or 12 weeks. We measured (A) plasma total cholesterol and (B) triglyceride levels in chow fed mice and after 6 or 12 weeks of WTD. n=3 to 5 per group for chow-fed mice; n=12 to 13 mice per group for 6- and 12-week WTD-fed mice. C, Lipoprotein classes were measured in Ldlr−/− and Saa−/−Ldlr−/− mice fed a WTD for 6 and 12 weeks. For each strain, n=10 mice for 6 weeks and n=6 to 7 for 12 weeks. *P<0.05; **P<0.01. HDL indicates high-density lipoprotein; LDL, low-density lipoprotein; VLDL, very low-density lipoprotein; WTD, Western-type diet.
Gene Expression in the Aortic Arch
SAA may facilitate early lesion formation by inducing proinflammatory gene expression, particularly genes involved in lesional monocyte recruitment and infiltration. Dong et al demonstrated that SAA1 overexpression in the liver upregulated expression of vascular adhesion molecule-1 (VCAM-1) and the chemokine MCP-1 in the aortic root.11 SAA has also been shown to induce MCP-1 in THP-1 cells and human umbilical vein endothelial cells in vitro.25,26 To determine whether the absence of SAA reduced lesional expression of VCAM-1 and MCP-1, quantitative real-time PCR was used to quantify gene expression in the aortic arch from Saa−/−Ldlr−/− and Ldlr−/− mice fed a WTD for 6 weeks. The aortic arch included the ascending aorta but not the innominate artery or aortic root. Although a modest reduction in VCAM-1 and MCP-1 expression was found in the absence of SAA, the results were not statistically significant (Figure7).
Figure 7.
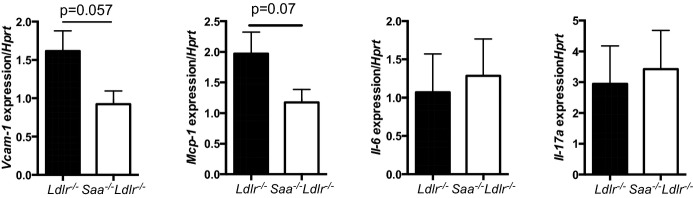
Expression of VCAM-1, MCP-1, IL-6, and IL-17A in the aortic arch of Ldlr−/− and Saa−/−Ldlr−/− mice fed a WTD for 6 weeks. RNA was isolated from the aortic arch using TRIzol extraction. cDNA was amplified and real-time PCR was performed to quantify expression level of VCAM-1, MCP-1, IL-6, and IL-17A. Expression of each gene was normalized to HPRT. For each group, n=4 to 5 mice. IL indicates interleukin; PCR, polymerase chain reaction; VCAM-1, vascular cell adhesion molecule-1; WTD, Western-type diet.
SAA has also been shown to induce the proinflammatory cytokine IL-23.27 IL-23 is known to induce production of IL-17A by T-helper 17 cells. It has been shown that IL-17A can promote atherosclerosis in certain contexts.28 In addition, IL-6 is highly produced by M1 macrophages, inhibits M2 macrophage development, and is known to promote atherogenesis.29,30 To determine whether the level of lesional mRNA for these 2 proinflammatory cytokines was higher in the presence rather than in the absence of SAA, real-time PCR was used to quantify mRNA levels in the aortic arch of Ldlr−/− and Saa−/−Ldlr−/− mice fed a WTD for 6 weeks. No difference was found in IL-17A and IL-6 mRNA levels (Figure7).
SAA From Bone Marrow–Derived Cells Participated in the Regulation of Ascending Aorta Atherosclerosis
SAA is a secreted protein primarily produced by hepatocytes and macrophages; however, the roles that each of these sources may play in atherosclerosis is unknown. To examine this, we performed a 4-way bone marrow transplantation study using Saa−/−Ldlr−/− and Ldlr−/− mice as donors and recipients (Table 1). Consistent with the studies with the global knockout mice, ascending aorta lesion size was lower in Saa−/−Ldlr−/−→Saa−/−Ldlr−/− chimeric mice that did not produce any SAA compared with Ldlr−/−→Ldlr−/− chimeric mice (Figure8A). Chimeric mice that did not express SAA in macrophages (Saa−/−Ldlr−/−→Saa−/−Ldlr−/− and Saa−/−Ldlr−/−→Ldlr−/−) had modestly lower atherosclerotic lesions compared with mice expressing SAA in macrophages (Ldlr−/−→Ldlr−/− and Ldlr−/−→Saa−/−Ldlr−/−). In contrast, mice expressing SAA in macrophages (ie, recipients of Ldlr−/− bone marrow) had a comparable amount of atherosclerosis whether or not SAA was produced by hepatocytes. Consistent with the reduced atherosclerosis in chimeric mice lacking SAA expression in macrophages, there was a decrease in MOMA-2+ lesional area, but no differences were found in the percentage of MOMA-2+/lesional area (Figure8B), indicating that neither source of SAA affects the relative macrophage content of the ascending aorta lesions. The results from the bone marrow transplantation studies indicated that SAA produced by macrophages had a greater role in enhancing early ascending aorta lesion formation in Ldlr−/− mice than SAA produced by hepatocytes.
Table 1.
Site of SAA Expression in Bone Marrow Chimeric Mice
| Donor | Recipient | Site of SAA Expression |
|---|---|---|
| Ldlr−/− | Ldlr−/− | Hepatocytes and macrophages |
| Saa−/−Ldlr−/− | Saa−/−Ldlr−/− | None |
| Ldlr−/− | Saa−/−Ldlr−/− | Macrophages |
| Saa−/−Ldlr−/− | Ldlr−/− | Hepatocytes |
SAA indicates serum amyloid A.
Figure 8.
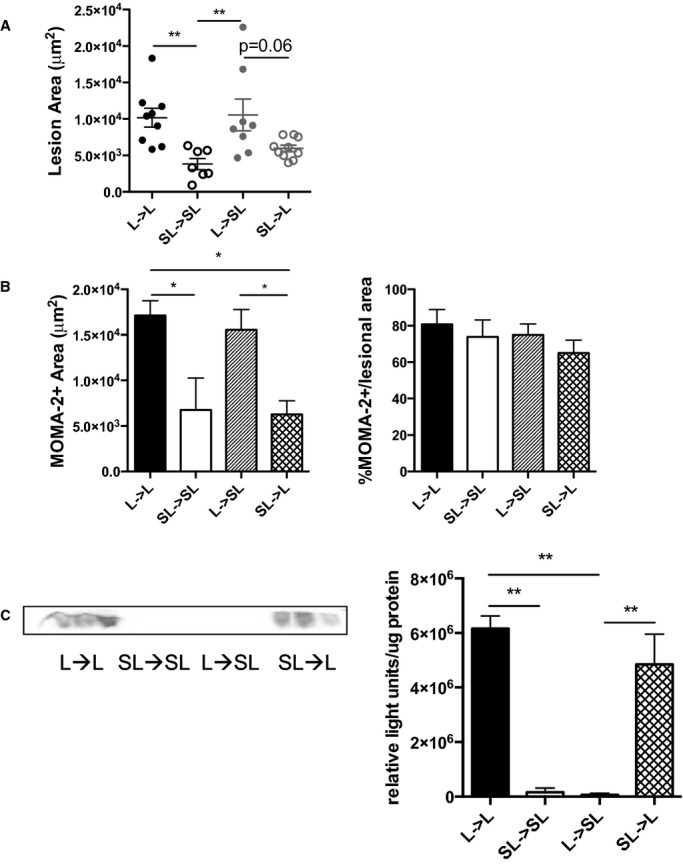
SAA produced by macrophages may promote atherosclerosis and increase the amount of lesional macrophages. Bone marrow transfer recipients were fed a Western-type diet for 6 weeks. A, The ascending aorta was stained with oil red O, and cross-sectional area was quantified. Each dot represents an individual mouse. n=7 to 10 for all groups. B, MOMA-2+ lesional area was quantified in the ascending aorta in chimeric Ldlr−/− and Saa−/−Ldlr−/− recipient mice. n= 4 to 5 per group. C, Plasma SAA levels in chimeric Ldlr−/− and Saa−/−Ldlr−/− recipient mice were analyzed by Western blot. Data are expressed as relative light units per microgram of plasma. n=3 per group. *P<0.05; **P<0.01. L indicates Ldlr−/−; SAA, serum amyloid A; SL,Saa−/−Ldlr−/−.
A Western blot for SAA was performed on plasma from the bone marrow recipients to assess whether macrophages contributed to plasma SAA levels. SAA was detected in the plasma of the recipient mice when SAA was expressed in hepatocytes (Ldlr−/−→Ldlr−/− and Saa−/−Ldlr−/−→Ldlr−/−)but not when SAA was expressed only in bone marrow–derived cells (Ldlr−/−→Saa−/−Ldlr−/−) (Figure8C). These results indicated that hepatocytes produced the majority of SAA found in the plasma of Ldlr−/− mice fed a WTD, with macrophages contributing little if any plasma SAA. Consequently, the SAA produced locally by bone marrow–derived cells may promote the development of atherosclerosis in the ascending aorta.
Atherosclerosis was Reduced in the Ascending Aorta Despite Increased Levels of Blood Monocytes
Monocytosis in both blood and spleen is associated with an increased risk for the development of atherosclerosis.31–33 A possible explanation for the decreased atherosclerosis in the WTD-fed Saa−/−Ldlr−/− mice is that they may have lower blood levels of monocytes. Blood monocytes were quantified using flow cytometry in Saa−/−Ldlr−/− and Ldlr−/− mice fed chow and a WTD for 6 weeks. In the chow-fed animals, there was no difference in blood monocytes (CD45+CD115+) in the presence and absence of SAA expression (Figure9B). Contrary to what was expected, in the absence of SAA in WTD-fed mice, the percentage of total monocytes was increased after 6 weeks on a WTD (Figure9C). Further analysis indicated that it was primarily the Ly6clo monocyte subset that was elevated. These data are significant because we observed a reduction in atherosclerosis at this time point despite an increase in total blood monocytes, which is often positively associated with atherosclerosis. We did not observe a significant difference in blood monocytes after 12 weeks of WTD, although there was a trend toward increased levels in Saa−/−Ldlr−/− mice (Figure9C).
Figure 9.

The absence of SAA induces increased monocyte levels after 6 weeks of WTD. A, Flow cytometry gating strategy for blood monocytes. Total monocytes were defined as CD45.2+CD115hi and divided into Ly6clo and Ly6chi subsets. The frequency of total monocytes and Ly6clo and Ly6chi subsets in Saa−/−Ldlr−/− and Ldlr−/− mice fed chow (B) or a WTD for 6 or 12 weeks (C). Data are compiled from 3 pooled experiments with n=8 to 11 per group. D, Percentage of total monocytes and Ly6clo and Ly6chi subsets in chimeric Saa−/−Ldlr−/− and Ldlr−/− mice fed a WTD for 6 weeks. Data are compiled from 3 pooled experiments with n=8 to 11 per group. E, Pearson’s correlation test between lesion size in the ascending aorta and the percentage of Ly6clo monocytes after 6 weeks of a WTD. Lesion size in the ascending aorta after 6 weeks of WTD is plotted on the x-axis, and the percentage of Ly6clo blood monocytes after 6 weeks of WTD is plotted on the y-axis. A Pearson’s correlation test was performed, and the correlation coefficients are shown. *P<0.05; **P<0.01. SAA indicates serum amyloid A; SSC, side scatter; WTD, Western-type diet.
The reason for the increased blood monocytes in the absence of SAA in the mice fed a WTD for 6 weeks is unclear. We did not observe a significant difference in splenic monocyte (CD45+F4/80−CD11b+Ly6c high or low) levels—a potential reservoir of blood monocytes and tissue macrophages—after 6 or 12 weeks on a WTD (data not shown). In addition, we did not observe a difference in blood monocyte proliferation, as determined by cell cycle analysis via flow cytometry, indicating that the absence of SAA does not promote monocytosis by increasing proliferation (data not shown).
To determine which source of SAA might be influencing blood monocyte levels, blood monocytes were quantified using flow cytometry in the bone marrow recipients after 6 weeks of a WTD. Similar to the nonchimeric mice, the percentage of total monocytes was increased only in recipients not expressing SAA in hepatocytes or macrophages (Saa−/− Ldlr−/−→Saa−/− Ldlr−/− mice) and was primarily due to a higher level of Ly6clo monocytes (Figure9D). Interestingly, the data suggest that the difference in Ly6clo monocytes is due to both hematopoietic and nonhematopoietic factors because recipients that expressed either source of SAA equally prevented an increase in both total and Ly6clo monocytes compared with recipients totally deficient in SAA. Further experiments are required to determine how the presence and absence of SAA modulates monocyte homeostasis in Ldlr−/− mice fed a WTD. This issue is under current investigation.
To determine whether the difference in the levels of Ly6clo monocytes influenced the development of atherosclerosis after 6 weeks of WTD feeding, Pearson’s correlation test was performed on both data sets. No correlation was found in either case (Figure9E), suggesting that the influence of SAA on peripheral blood Ly6clo monocyte levels was independent of its influence on atherogenesis.
Macrophages Were Reduced in the Spleen and Peritoneal Cavity Despite the Elevation of Blood Monocytes
The spleen has been shown to serve as a reservoir for monocytes and macrophages on consumption of a high-fat, high-cholesterol diet that can be recruited to aortic lesions contribute to the growth of atherosclerotic lesions.32,34 As mentioned above, there was no difference in the number of monocytes in the spleen as a function of the presence or absence of SAA. We used flow cytometry to determine whether SAA influenced the amount of macrophages (CD45.2+F4/80+CD68+ cells) in the spleen and peritoneal fluid of mice fed a WTD for 6 weeks. Spleen and resident peritoneal macrophages were increased in the presence of SAA (Figure10A through 10C). To determine whether SAA expressed by macrophages and/or hepatocytes promoted an increase in splenic macrophages, we also quantified splenic macrophages in the bone marrow recipients. Recipients that did not express SAA in macrophages (Saa−/−Ldlr−/−→Saa−/−Ldlr−/− and Saa−/−Ldlr−/−→Ldlr−/−) demonstrated lower levels of splenic macrophages compared with recipients that expressed SAA in macrophages (Figure10D). These results indicate that SAA produced by macrophages may increase the amount of macrophages in the spleen in WTD-fed mice.
Figure 10.
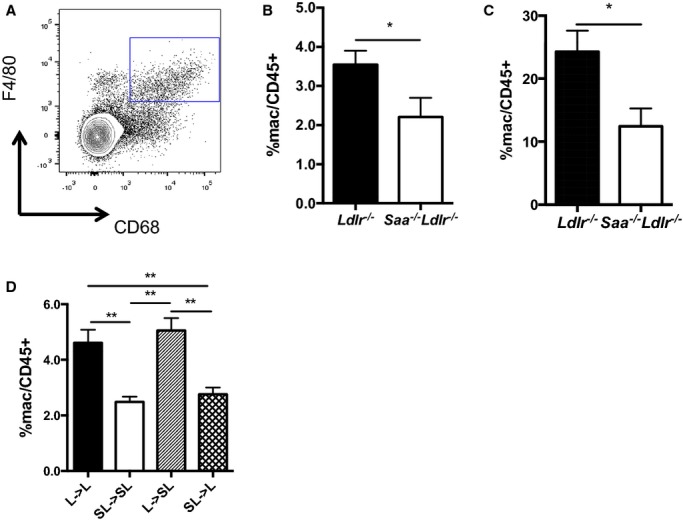
The absence of SAA produced by macrophages reduces macrophages in the spleen in Ldlr−/− mice fed a WTD. A, Macrophages in the spleen were quantified using flow cytometry and defined as CD45.2+F4/80+CD68+. Percentage of macrophages in the (B) spleen and (C) peritoneum of Saa−/−Ldlr−/− and Ldlr−/− mice fed a WTD for 6 weeks. Data are compiled from 2 pooled experiments for each group. n=8 to 10 per group. D, Percentage of macrophages in the spleen of Saa−/−Ldlr−/− and Ldlr−/− chimeric mice fed a WTD for 6 weeks. n=7 to 9 per group. Representative of 2 pooled experiments for each group. Percentages were normalized to CD45.2+ cells. *P<0.05, **P<0.01. L indicates Ldlr−/−; SAA, serum amyloid A; SL, Saa−/−Ldlr−/−; WTD, Western-type diet.
Discussion
This study is the first report of an examination of the effect of the absence of the acute-phase protein SAA on atherogenesis in the Ldlr−/− background. We identified 3 novel findings related to SAA and atherogenesis and monocyte biology. First, we found that SAA deficiency attenuated atherogenesis in the ascending aorta during early lesion development and did not influence mature lesion formation. This is a site-selective response because these differences were found only in the ascending aorta after 6 weeks of WTD. Second, we showed that this attenuation appeared to be attributable to the absence of SAA production by macrophages, as discerned from bone marrow transplantation experiments. Third, we demonstrated that despite there being less atherosclerosis in the absence of SAA, there were higher levels of total blood monocytes.
The absence of SAA in Ldlr−/− mice resulted in a reduction in early lesion formation in the ascending aorta but not in the innominate artery or aortic root after 6 weeks of a WTD. Histological staining of the ascending aorta indicated that lesions after 6 weeks of a WTD were early in development and consisted primarily of macrophage foam cells, with very little connective tissue and/or collagen content. After 12 weeks of a WTD, lesions in both Saa−/−Ldlr−/− and Ldlr−/− mice were similar in size and more mature in composition. The reason for the site-specific effect of SAA is not clear, but the lack of an effect on aortic root lesions may be related to the fact that this site is the first in mice to develop atherosclerosis, and thus the lesions at this site are more mature even in the mice fed a WTD for 6 weeks. In contrast, the lesions in the innominate artery were very small, yet there was no effect of SAA deficiency. SAA does not appear to influence cholesterol loading of the foam cells because no difference was found in cholesterol uptake by peritoneal macrophages from the 2 strains of mice in vitro with acetylated LDL or in vivo in WTD-fed mice or in the expression LOX-1 in the ascending aorta (data not shown). Our results suggest that SAA may influence lesion formation by affecting processes involved in early lesion formation, such as increased expression of adhesion molecules and chemokines involved in leukocyte and monocyte infiltration, although differences in differentiation of monocytes into macrophages or their retention in the aortic tissue30,35–38 may also have a role. Previous in vitro and in vivo studies have found that increased levels of SAA regulate expression of adhesion molecules such as VCAM-1, CD62L (l-selectin), and CD11b and chemokines such as MCP-1 in endothelial cells, leukocytes, and aortic root lesions.11,16 We observed a trend toward higher expression of VCAM-1 and MCP-1 in the aortic arch in mice expressing SAA. Ly6chi monocytes are also known to express CC chemokine receptor 2 (CCR2), the chemokine receptor for MCP-1. Ly6chi monocytes are also known to preferentially express formy peptide receptor 2 (FPR2), a key signaling receptor for SAA. Consequently, in the presence of SAA, Ly6chi monocytes might be recruited to lesions via MCP-1 and CCR2 or SAA and FPR2.
Previous studies have investigated the role of SAA in lesion formation in ApoE−/− mice. Dong et al found that overexpression of SAA1 in hepatocytes via recombinant lentiviral infection in male ApoE−/− mice resulted in an increase in lesional area in the aortic root after 14 weeks on a chow diet; however, no difference was found in lesion size after 12 weeks on a high-fat diet (16% fat, 0.25% cholesterol).11 De Beer et al demonstrated recently that the absence of SAA1 and SAA2 in ApoE−/− mice did not affect lesion formation in the whole aorta or the aortic root in male and female mice fed a chow diet for 50 weeks or a WTD for 12 weeks.9 Although this may seem to contradict our results, it should be noted that the lesions in the Saa−/−ApoE−/− mice were significantly larger and more advanced than we observed in the Ldlr−/− mice after 6 weeks on a WTD. In our studies, too, no difference in lesion size was observed when larger, more advanced lesions were present. Taken together, these data support the conclusion that SAA influences early lesion formation.
Lesion formation was found to be independent of plasma lipid levels because no difference was found in plasma levels of total, VLDL, or LDL cholesterol after 6 weeks of a WTD; however, the absence of SAA seemed to modestly increase plasma triglycerides and HDL cholesterol after 6 weeks of a WTD. This finding is surprising because SAA is mostly an HDL-associated apolipoprotein, and SAA’s dramatic increase during the acute-phase response is associated with a significant reduction in HDL and apoA-I.39 Nonetheless, the SAA levels induced by the WTD feeding were upregulated 4-fold, whereas during the acute-phase response, SAA levels were upregulated 100- to 1000-fold compared with a noninflammatory state. In contrast, after 12 weeks of a WTD, VLDL and LDL levels were increased and HDL was decreased in the Saa−/−Ldlr−/− mice. This is a proatherogenic lipid profile and could have contributed to the accelerated lesion growth in the ascending aorta of the Saa−/−Ldlr−/− mice so that, at this time, there is no difference between the lesions sizes of the 2 strains.
Using bone marrow chimeras, we also showed that SAA produced by macrophages was more likely to promote lesion formation in the ascending aorta and an increase in lesional and splenic macrophages. These observations are noteworthy, given that hepatocytes produce the majority of SAA that is present in the plasma, with macrophages contributing little if any plasma SAA. These results suggest that SAA may have local effects on lesional macrophages prior to or after secretion or effects on other cells in the vessel wall that may influence lesion formation. Consistent with the role of macrophage-derived SAA, the transgenic mediated overexpression of human SAA1 in adipocytes also does not influence the development of atherosclerosis in chow-fed ApoE−/− mice.12
There is an emerging consensus that monocytosis is a risk factor for the development of atherosclerosis in a variety of models and in humans. In most cases, this involves the elevation of Ly6chi proinflammatory monocytes.33,40 These monocytes enter the intima, where they differentiate into macrophages expressing CCR2, the receptor for MCP-1, and promote lesion development in atherosclerosis-susceptible sites.31,41 We reported a decrease in atherosclerosis despite an increase in total monocytes in the blood of Saa−/− Ldlr−/− mice. In this case, the monocytes were predominantly Ly6clo monocytes that are thought to patrol the vascular endothelium.38 Ly6clo monocytes do not express CCR2 and generally are thought to develop into alternatively activated and antiatherogenic M2 macrophages that have been suggested to promote tissue remodeling and the resolution of atherogenesis.42 Consequently, this increment of Ly6clo polarized monocytes should not be taken to contradict the emerging consensus. The increase in Ly6clo monocytes could well contribute to the reduced atherosclerosis observed in the absence of SAA expression. Although a higher level of Ly6clo monocytes and a reduction of atherosclerosis were both found in the absence of SAA after 6 weeks of a WTD, no correlation was found between these 2 observations by Pearson’s correlation coefficient analysis. It is quite possible that these 2 phenomena were induced simultaneously by a hyperlipidemic state but regulated by separate mechanisms. The way in which SAA influences the polarity of blood monocytes has yet to be established. We did not observe an effect of SAA expression on the proliferation of blood monocytes, as determined by cell cycle analysis (data not shown), indicating that SAA does not influence monocyte proliferation. A possibility is that SAA influences expression of factors involved in monocyte subset differentiation or survival, such as nuclear orphan receptor NRA41.43
In conclusion, we showed that SAA produced by macrophages increased the amount of lesional macrophages, promoting early lesion development. It is clear from this study and others that the role of SAA in atherosclerosis is dependent on several factors including the genetic background of the different models used for study, lesion site and size, and the duration of an experiment. Further studies are needed to further clarify how SAA may influence lesion development and blood and tissue monocyte and macrophage homeostasis.
Sources of Funding
This work was supported by NIH grant P01 HL092969, the Leducq Foundation and the Cardiovascular Pathophysiology and Biochemistry Training grant HL007237.
Disclosures
None.
References
- Wool GD, Reardon CA. The influence of acute phase proteins on murine atherosclerosis. Curr Drug Targets. 2007;8:1203–1214. doi: 10.2174/138945007782403856. [DOI] [PubMed] [Google Scholar]
- King VL, Thompson J, Tannock LR. Serum amyloid A in atherosclerosis. Curr Opin Lipidol. 2011;22:302–307. doi: 10.1097/MOL.0b013e3283488c39. [DOI] [PubMed] [Google Scholar]
- Lewis KE, Kirk EA, McDonald TO, Wang S, Wight TN, O’Brien KD, Chait A. Increase in serum amyloid A evoked by dietary cholesterol is associated with increased atherosclerosis in mice. Circulation. 2004;110:540–545. doi: 10.1161/01.CIR.0000136819.93989.E1. [DOI] [PubMed] [Google Scholar]
- Chambers RE, MacFarlane DG, Whicher JT, Dieppe PA. Serum amyloid-A protein concentration in rheumatoid arthritis and its role in monitoring disease activity. Ann Rheum Dis. 1983;42:665–667. doi: 10.1136/ard.42.6.665. [DOI] [PMC free article] [PubMed] [Google Scholar]
- Jahangiri A, Wilson PG, Hou T, Brown A, King VL, Tannock LR. Serum amyloid A is found on apoB-containing lipoproteins in obese humans with diabetes. Obesity (Silver Spring) 2013;21:993–996. doi: 10.1002/oby.20126. [DOI] [PMC free article] [PubMed] [Google Scholar]
- Ridker PM, Hennekens CH, Buring JE, Rifai N. C-reactive protein and other markers of inflammation in the prediction of cardiovascular disease in women. N Engl J Med. 2000;342:836–843. doi: 10.1056/NEJM200003233421202. [DOI] [PubMed] [Google Scholar]
- Johnson BD, Kip KE, Marroquin OC, Ridker PM, Kelsey SF, Shaw LJ, Pepine CJ, Sharaf B, Bairey Merz CN, Sopko G, Olson MB, Reis SE National Heart LaBI. Serum amyloid A as a predictor of coronary artery disease and cardiovascular outcome in women: the National Heart, Lung, and Blood Institute-sponsored Women’s Ischemia Syndrome Evaluation (WISE) Circulation. 2004;109:726–732. doi: 10.1161/01.CIR.0000115516.54550.B1. [DOI] [PubMed] [Google Scholar]
- Maier W, Altwegg LA, Corti R, Gay S, Hersberger M, Maly FE, Sutsch G, Roffi M, Neidhart M, Eberli FR, Tanner FC, Gobbi S, von Eckardstein A, Luscher TF. Inflammatory markers at the site of ruptured plaque in acute myocardial infarction: locally increased interleukin-6 and serum amyloid A but decreased C-reactive protein. Circulation. 2005;111:1355–1361. doi: 10.1161/01.CIR.0000158479.58589.0A. [DOI] [PubMed] [Google Scholar]
- De Beer MC, Wroblewski JM, Noffsinger VP, Rateri DL, Howatt DA, Balakrishnan A, Ji A, Shridas P, Thompson JC, van der Westhuyzen DR, Tannock LR, Daugherty A, Webb NR, De Beer FC. Deficiency of endogenous acute phase serum amyloid A does not affect atherosclerotic lesions in apolipoprotein E-deficient mice. Arterioscler Thromb Vasc Biol. 2014;34:255–261. doi: 10.1161/ATVBAHA.113.302247. [DOI] [PMC free article] [PubMed] [Google Scholar]
- O’Brien KD, McDonald TO, Kunjathoor V, Eng K, Knopp EA, Lewis K, Lopez R, Kirk EA, Chait A, Wight TN, deBeer FC, LeBoeuf RC. Serum amyloid A and lipoprotein retention in murine models of atherosclerosis. Arterioscler Thromb Vasc Biol. 2005;25:785–790. doi: 10.1161/01.ATV.0000158383.65277.2b. [DOI] [PubMed] [Google Scholar]
- Dong Z, Wu T, Qin W, An C, Wang Z, Zhang M, Zhang Y, Zhang C, An F. Serum amyloid A directly accelerates the progression of atherosclerosis in apolipoprotein E-deficient mice. Mol Med. 2011;17:1357–1364. doi: 10.2119/molmed.2011.00186. [DOI] [PMC free article] [PubMed] [Google Scholar]
- Ahlin S, Olsson M, Wilhelmson AS, Skalen K, Boren J, Carlsson LM, Svensson PA, Sjoholm K. Adipose tissue-derived human serum amyloid A does not affect atherosclerotic lesion area in HSAA1+/−/ApoE−/− mice. PLoS One. 2014;9:e95468. doi: 10.1371/journal.pone.0095468. [DOI] [PMC free article] [PubMed] [Google Scholar]
- Lee HY, Kim SD, Baek SH, Choi JH, Cho KH, Zabel BA, Bae YS. Serum amyloid A stimulates macrophage foam cell formation via lectin-like oxidized low-density lipoprotein receptor 1 upregulation. Biochem Biophys Res Commun. 2013;433:18–23. doi: 10.1016/j.bbrc.2013.02.077. [DOI] [PMC free article] [PubMed] [Google Scholar]
- Lee HY, Kim SD, Baek SH, Choi JH, Bae YS. Role of formyl peptide receptor 2 on the serum amyloid A-induced macrophage foam cell formation. Biochem Biophys Res Commun. 2013;433:255–259. doi: 10.1016/j.bbrc.2013.03.002. [DOI] [PubMed] [Google Scholar]
- Wilson PG, Thompson JC, Webb NR, de Beer FC, King VL, Tannock LR. Serum amyloid A, but not C-reactive protein, stimulates vascular proteoglycan synthesis in a pro-atherogenic manner. Am J Pathol. 2008;173:1902–1910. doi: 10.2353/ajpath.2008.080201. [DOI] [PMC free article] [PubMed] [Google Scholar]
- Badolato R, Wang JM, Murphy WJ, Lloyd AR, Michiel DF, Bausserman LL, Kelvin DJ, Oppenheim JJ. Serum amyloid A is a chemoattractant: induction of migration, adhesion, and tissue infiltration of monocytes and polymorphonuclear leukocytes. J Exp Med. 1994;180:203–209. doi: 10.1084/jem.180.1.203. [DOI] [PMC free article] [PubMed] [Google Scholar]
- Gouwy M, De Buck M, Portner N, Opdenakker G, Proost P, Struyf S, Van Damme J. Serum amyloid A chemoattracts immature dendritic cells and indirectly provokes monocyte chemotaxis by induction of cooperating CC and CXC chemokines. Eur J Immunol. 2015;45:101–112. doi: 10.1002/eji.201444818. [DOI] [PubMed] [Google Scholar]
- Niemi K, Teirila L, Lappalainen J, Rajamaki K, Baumann MH, Oorni K, Wolff H, Kovanen PT, Matikainen S, Eklund KK. Serum amyloid A activates the NLRP3 inflammasome via P2X7 receptor and a cathepsin B-sensitive pathway. J Immunol. 2011;186:6119–6128. doi: 10.4049/jimmunol.1002843. [DOI] [PubMed] [Google Scholar]
- Duewell P, Kono H, Rayner KJ, Sirois CM, Vladimer G, Bauernfeind FG, Abela GS, Franchi L, Nunez G, Schnurr M, Espevik T, Lien E, Fitzgerald KA, Rock KL, Moore KJ, Wright SD, Hornung V, Latz E. NLRP3 inflammasomes are required for atherogenesis and activated by cholesterol crystals. Nature. 2010;464:1357–1361. doi: 10.1038/nature08938. [DOI] [PMC free article] [PubMed] [Google Scholar]
- de Beer MC, Webb NR, Wroblewski JM, Noffsinger VP, Rateri DL, Ji A, van der Westhuyzen DR, de Beer FC. Impact of serum amyloid A on high density lipoprotein composition and levels. J Lipid Res. 2010;51:3117–3125. doi: 10.1194/jlr.M005413. [DOI] [PMC free article] [PubMed] [Google Scholar]
- Sontag TJ, Krishack PA, Lukens JR, Bhanvadia CV, Getz GS, Reardon CA. Apolipoprotein A-I protection against atherosclerosis is dependent on genetic background. Arterioscler Thromb Vasc Biol. 2014;34:262–269. doi: 10.1161/ATVBAHA.113.302831. [DOI] [PubMed] [Google Scholar]
- Gomori G. A rapid one-step trichrome stain. Am J Clin Pathol. 1950;20:661–664. doi: 10.1093/ajcp/20.7_ts.661. [DOI] [PubMed] [Google Scholar]
- Wool GD, Vaisar T, Reardon CA, Getz GS. An apoA-I mimetic peptide containing a proline residue has greater in vivo HDL binding and anti-inflammatory ability than the 4F peptide. J Lipid Res. 2009;50:1889–1900. doi: 10.1194/jlr.M900151-JLR200. [DOI] [PMC free article] [PubMed] [Google Scholar]
- Cabana VG, Reardon CA, Wei B, Lukens JR, Getz GS. SAA-only HDL formed during the acute phase response in apoA-I+/+ and apoA-I−/− mice. J Lipid Res. 1999;40:1090–1103. [PubMed] [Google Scholar]
- Lee HY, Kim SD, Shim JW, Lee SY, Lee H, Cho KH, Yun J, Bae YS. Serum amyloid A induces CCL2 production via formyl peptide receptor-like 1-mediated signaling in human monocytes. J Immunol. 2008;181:4332–4339. doi: 10.4049/jimmunol.181.6.4332. [DOI] [PubMed] [Google Scholar]
- Lee HY, Kim SD, Shim JW, Yun J, Kim K, Bae YS. Activation of formyl peptide receptor like-1 by serum amyloid A induces CCL2 production in human umbilical vein endothelial cells. Biochem Biophys Res Commun. 2009;380:313–317. doi: 10.1016/j.bbrc.2009.01.068. [DOI] [PubMed] [Google Scholar]
- He R, Shepard LW, Chen J, Pan ZK, Ye RD. Serum amyloid A is an endogenous ligand that differentially induces IL-12 and IL-23. J Immunol. 2006;177:4072–4079. doi: 10.4049/jimmunol.177.6.4072. [DOI] [PubMed] [Google Scholar]
- Taleb S, Tedgui A, Mallat Z. IL-17 and Th17 cells in atherosclerosis: subtle and contextual roles. Arterioscler Thromb Vasc Biol. 2015;35:258–264. doi: 10.1161/ATVBAHA.114.303567. [DOI] [PubMed] [Google Scholar]
- Mosser DM, Edwards JP. Exploring the full spectrum of macrophage activation. Nat Rev Immunol. 2008;8:958–969. doi: 10.1038/nri2448. [DOI] [PMC free article] [PubMed] [Google Scholar]
- Moore KJ, Sheedy FJ, Fisher EA. Macrophages in atherosclerosis: a dynamic balance. Nat Rev Immunol. 2013;13:709–721. doi: 10.1038/nri3520. [DOI] [PMC free article] [PubMed] [Google Scholar]
- Swirski FK, Libby P, Aikawa E, Alcaide P, Luscinskas FW, Weissleder R, Pittet MJ. Ly-6Chi monocytes dominate hypercholesterolemia-associated monocytosis and give rise to macrophages in atheromata. J Clin Invest. 2007;117:195–205. doi: 10.1172/JCI29950. [DOI] [PMC free article] [PubMed] [Google Scholar]
- Robbins CS, Chudnovskiy A, Rauch PJ, Figueiredo JL, Iwamoto Y, Gorbatov R, Etzrodt M, Weber GF, Ueno T, van Rooijen N, Mulligan-Kehoe MJ, Libby P, Nahrendorf M, Pittet MJ, Weissleder R, Swirski FK. Extramedullary hematopoiesis generates Ly-6Chigh monocytes that infiltrate atherosclerotic lesions. Circulation. 2012;125:364–374. doi: 10.1161/CIRCULATIONAHA.111.061986. [DOI] [PMC free article] [PubMed] [Google Scholar]
- Swirski FK, Pittet MJ, Kircher MF, Aikawa E, Jaffer FA, Libby P, Weissleder R. Monocyte accumulation in mouse atherogenesis is progressive and proportional to extent of disease. Proc Natl Acad Sci USA. 2006;103:10340–10345. doi: 10.1073/pnas.0604260103. [DOI] [PMC free article] [PubMed] [Google Scholar]
- Swirski FK, Nahrendorf M, Etzrodt M, Wildgruber M, Cortez-Retamozo V, Panizzi P, Figueiredo JL, Kohler RH, Chudnovskiy A, Waterman P, Aikawa E, Mempel TR, Libby P, Weissleder R, Pittet MJ. Identification of splenic reservoir monocytes and their deployment to inflammatory sites. Science. 2009;325:612–616. doi: 10.1126/science.1175202. [DOI] [PMC free article] [PubMed] [Google Scholar]
- Weber C, Zernecke A, Libby P. The multifaceted contributions of leukocyte subsets to atherosclerosis: lessons from mouse models. Nat Rev Immunol. 2008;8:802–815. doi: 10.1038/nri2415. [DOI] [PubMed] [Google Scholar]
- Woollard KJ. Immunological aspects of atherosclerosis. Clin Sci (Lond) 2013;125:221–235. doi: 10.1042/CS20120576. [DOI] [PubMed] [Google Scholar]
- Nakashima Y, Raines EW, Plump AS, Breslow JL, Ross R. Upregulation of VCAM-1 and ICAM-1 at atherosclerosis-prone sites on the endothelium in the apoE-deficient mouse. Arterioscler Thromb Vasc Biol. 1998;18:842–851. doi: 10.1161/01.atv.18.5.842. [DOI] [PubMed] [Google Scholar]
- Randolph GJ. Mechanisms that regulate macrophage burden in atherosclerosis. Circ Res. 2014;114:1757–1771. doi: 10.1161/CIRCRESAHA.114.301174. [DOI] [PMC free article] [PubMed] [Google Scholar]
- Cabana VG, Lukens JR, Rice KS, Hawkins TJ, Getz GS. HDL content and composition in acute phase response in three species: triglyceride enrichment of HDL a factor in its decrease. J Lipid Res. 1996;37:2662–2674. [PubMed] [Google Scholar]
- Murphy AJ, Dragoljevic D, Tall AR. Cholesterol efflux pathways regulate myelopoiesis: a potential link to altered macrophage function in atherosclerosis. Front Immunol. 2014;5:490–495. doi: 10.3389/fimmu.2014.00490. [DOI] [PMC free article] [PubMed] [Google Scholar]
- Tacke F, Alvarez D, Kaplan TJ, Jakubzick C, Spanbroek R, Llodra J, Garin A, Liu J, Mack M, van Rooijen N, Lira SA, Habenicht AJ, Randolph GJ. Monocyte subsets differentially employ CCR2, CCr5, and CX3CR1 to accumulate within atherosclerotic plaques. J Clin Invest. 2007;117:185–194. doi: 10.1172/JCI28549. [DOI] [PMC free article] [PubMed] [Google Scholar]
- Woollard KJ, Geissmann F. Monocytes in atherosclerosis: subsets and functions. Nat Rev Cardiol. 2010;7:77–86. doi: 10.1038/nrcardio.2009.228. [DOI] [PMC free article] [PubMed] [Google Scholar]
- Hanna RN, Carlin LM, Hubbeling HG, Nackiewicz D, Green AM, Punt JA, Geissmann F, Hedrick CC. The transcription factor NR4a1 (Nur77) controls bone marrow differentiation and the survival of Ly6C- monocytes. Nat Immunol. 2011;12:778–785. doi: 10.1038/ni.2063. [DOI] [PMC free article] [PubMed] [Google Scholar]