

Abstract
Background
Uncertainty remains about whether stroke affects men and women similarly. We studied differences between men and women with regard to stroke severity and survival.
Methods and Results
We used the Danish Stroke Registry, with information on all hospital admissions for stroke in Denmark between 2003 and 2012 (N=79 617), and the Danish Register of Causes of Death. Information was available on age, sex, marital status, stroke severity, stroke subtype, socioeconomic status, and cardiovascular risk profile. We studied only deaths due to the index stroke, with the assumption that death reported on death certificates as due to stroke was related to the index stroke if death occurred within the first week or month after stroke. Multivariate Cox regression analysis and multiple imputation were applied. Stroke was the cause of death for 4373 and 5512 of the 79 617 patients within 1 week (5.5%) or 1 month (6.9%), respectively. After the age of 60 years, women had more severe strokes than men. Up to ages in the mid-60s, no difference in the risk of death from stroke was seen between the 2 sexes. For people aged >65 years, however, the risk gradually became greater in men than in women and significantly so (>15%) from the mid-70s (adjusted for age, marital status, stroke severity, stroke subtype, socioeconomic status, and cardiovascular risk factors). Results were essentially the same when analyzing deaths within 1 week, 1 month and ischemic and hemorrhagic stroke separately.
Conclusions
Stroke affects women and men differently. Elderly women were affected more severely than elderly men but were more likely to survive.
Keywords: mortality, sex, stroke, stroke severity, survival
Information about whether a given treatment works in the same way for men and women is essential. This knowledge requires studies of whether men and women are affected by the same disease in the same way and whether their survival after the disease is the same.
Stroke is the second leading cause of death and the second largest burden of disease in the Western world1; therefore, treatments that can mitigate the consequences of stroke are essential. Nonetheless, uncertainty exists about how stroke affects the 2 sexes in terms of survival and severity. In some studies, the ability to survive was unrelated to sex, whereas in others, survival was either better or worse in women than in men.2–4 Similar uncertainty is seen in studies of stroke severity in men and women.4,5
Knowledge about the severity of the stroke leading to death is a prerequisite for studies of survival after stroke. The available studies of men’s and women’s abilities to survive stroke have included not only death due to the index stroke but also death due to other diseases (eg, recurrent stroke, heart disease, cancer, infection) for which there was no information on severity.6–11 If women have strokes of different severity from those of men, studies of male and female survival after stroke are at risk for selection bias unless the severity of the stroke from which the patient dies is known. In addition to information on stroke severity, such studies also require certainty that the death resulted from the index stroke. No studies have been performed in which these preconditions were fulfilled, and that may explain the widely divergent reports of men’s and women’s chances of survival after stroke.
The purpose of this investigation was to study potential sex disparities in stroke by comparing men’s and women’s abilities to survive after stroke, with adjustment for differences in demographics, socioeconomic status, cardiovascular risk factor profile, stroke subtype, and severity of the index stroke in 79 617 patients admitted to Danish hospitals for stroke between 2003 and 2012. To avoid selection bias, we studied only deaths due to the index stroke, with the assumption that a death due to stroke as recorded on death certificates was due to the index stroke if the death occurred within the first month after the stroke.
Material and Methods
The study is based on data in the Danish Stroke Registry (formerly the Danish National Indicator Project), which is described in detail elsewhere.10,12 The registry contains information on all hospital admissions for stroke in Denmark; coverage is currently estimated (by professional consensus) to be >80%.13 All Danish hospitals report a defined set of data on all patients admitted for acute stroke, including age, sex, marital status, admission stroke severity measured on the Scandinavian Stroke Scale,14 stroke subtype (ischemic or hemorrhagic), and a predefined cardiovascular profile.
The Scandinavian Stroke Scale is a validated neurological scale for evaluating level of consciousness; eye movement; power in the arm, hand, and leg; orientation; aphasia; facial paresis; and gait, with a total score of 0 to 58. Lower scores indicate more severe stroke. Ischemic stroke was distinguished from primary intracerebral hematoma by computed tomography or magnetic resonance scanning. The cardiovascular profile included information on alcohol consumption (high: >14 drinks per week for women and >21 for men; low to moderate: ≤14 drinks per week for women and ≤21 for men), smoking (current daily smoker, former smoker, never smoker), diabetes mellitus, atrial fibrillation (chronic or paroxysmal), arterial hypertension, previous myocardial infarct, previous stroke, intermittent arterial claudication, and body mass index. Diabetes mellitus, atrial fibrillation, arterial hypertension, previous myocardial infarct, and previous stroke were diagnosed according to current Danish standards12 and were either known before the onset of stroke or diagnosed during hospitalization. Body mass index was divided into 4 categories (in kg/m2): underweight (<20), normal weight (20 to 25), overweight (25 to 30), and obese (>30). Stroke was defined according to World Health Organization criteria.15 Patients with subarachnoid hemorrhage were excluded from the study, as were patients with transient ischemic attacks. For patients with multiple events, only the first event was included in the analysis. We excluded patients aged <19 years and patients in whom computed tomography or magnetic resonance scanning had not been performed (0.9%) or was unavailable (0.9%). Time was scaled from the day of hospital admission.
For all patients in the study population, we obtained information on level of education and disposable income by linkage to the registries of Statistics Denmark.16 Education was grouped into 4 categories: basic or high school, defined as 7 to 12 years of primary, secondary, and grammar school education; vocational, defined as 10 to 12 years of education including vocational training; higher, defined as ≥13 years of education; and unknown or missing. Disposable income was defined as household income after taxation and interest per person, adjusted for the number of people in the household and deflated according to the 2000 value of the Danish krone and categories according to quintiles in the general population.
Survival was followed through the Danish Central Person Registry. Cause of death was obtained from the Danish Register of Causes of Death and was divided into 5 groups according to the International Classification of Diseases, 10th revision (ICD-10)17: stroke (I60 to I69), heart disease (I00 to I25, I27, I30 to I51), cancer (C00 to C97), respiratory disease (J00 to J99), and other diseases. For the purpose of this study, we studied only deaths declared as caused by stroke (ICD-10 codes I60 to I69) within the first month after the index stroke. Separate analyses were performed for all stroke, ischemic stroke, and hemorrhagic stroke.
Inclusion of patients began January 1, 2003, and the end of follow-up was December 31, 2011. Follow-up within the first month after stroke was complete. The study was approved by the boards of the Danish Stroke Registry and the Danish Data Protection Agency (journal number 2012-41-0719).
Statistics
Differences in income, education, and cardiovascular risk profile between men and women were tested with χ2 tests after adjustment for age and stroke severity by inverse probability weighting.18
We applied multiple linear regression to describe differences in stroke severity as a function of age by separate restricted cubic splines for men and women, with adjustment for cardiovascular risk profile, income, education, and marital status. In our data set, the probability of missing data was associated with stroke severity but, to our knowledge, not with the variable itself. Consequently, we believed that data were missing at random, and thus we applied multiple imputation (10 repetitions) in cases for which information on any of the variables of interest was missing.
We used Cox regression models of the event of death by stroke within 1 week and 1 month by censoring for death due to other causes, end of follow-up, or loss to follow-up, whichever came first. Separate analyses were performed for all stroke, ischemic stroke, and hemorrhagic stroke. As a sensitivity analysis, an additional analysis of all-cause mortality within 1 week and 1 month was performed. We used time since admission as the underlying time scale, with adjustment for marital status, income, education, and cardiovascular risk profile. Stroke severity was categorized in quartiles, and age was included as a continuous variable by means of restricted cubic splines to account for nonlinearity. For age, separate restricted cubic splines were estimated for men and women. We repeated the analyses without adjustment and tested the cubic splines against linear alternatives by means of likelihood ratio tests. The results are presented graphically, namely, the estimated hazard ratio (HR; men versus women) with 95% pointwise confidence intervals as a function of age, with a reference line at an HR of 1 corresponding to equal hazard. Significant differences in men versus women can be seen from the confidence intervals (ie, compared with the reference line). Global tests of risk differences between men and women were performed by likelihood ratio tests. In all analyses, we applied multiple imputation (10 repetitions) in cases for which information was missing. We used R version 3.0.2 (R Foundation) for all analyses19 and accepted significance at 5%.
Results
Of the 79 617 patients with stroke registered in the Danish Stroke Registry, 47.2% were women and 91.7% had ischemic stroke. The mean age of the women was 74.4 years (SD 13.6), and the men had a mean age of 69.5 years (SD 12.5) (P<0.0001). The mean stroke severity score was 40.4 (SD 17.3) for women and 44.0 (SD 15.6) for men (P<0.0001). The severity of stroke increased with age (Figure1), with an accelerated increase after 60 years. Overall, 96% of the patients were treated in stroke units.
Figure 1.
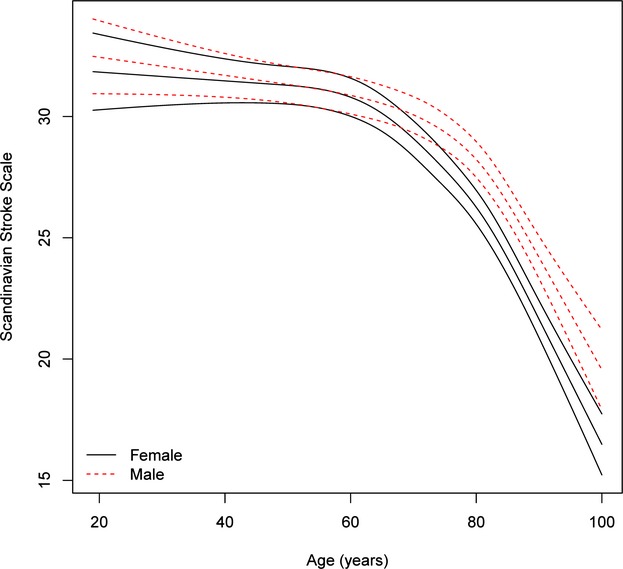
Age-specific stroke severity in men and women after adjustment for cardiovascular risk profile, income, and education and multiple imputation. For each sex, the mean severity as a function of age is given with 95% pointwise confidence limits. The interaction between age and sex is significant (P<0.0001), namely, the association between age and severity is significantly different for men and women.
The cardiovascular risk factor profile, marital status, and socioeconomic status of the patients are listed in Table 1. Data were complete for >80% of all variables except body mass index (70%); for 33 359 patients, there was complete information on all variables. After adjustment for age and stroke severity by inverse probability weighting, men more often had diabetes mellitus, previous myocardial infarct, intermittent arterial claudication, ischemic stroke, previous stroke, and high alcohol consumption compared with women. Women more often had hypertension and atrial fibrillation and were less often obese. Men were also more often smokers, more often had higher education, and more often had the highest quintile of income.
Table 1.
Cardiovascular Risk Factors, Stroke Subtype, Marital Status, and Socioeconomic Status of the 79 617 Participants by Sex
| Characteristics | All | Female | Male | |||
|---|---|---|---|---|---|---|
| n | Deaths From Stroke* | n | Deaths From Stroke | n | Deaths From Stroke | |
| All | 79 617 | 5512 | 37 578 | 3019 | 42 039 | 2493 |
| Age, y | ||||||
| 19 to 63 | 20 621 | 583 | 7558 | 216 | 13 063 | 367 |
| 64 to 74 | 21 232 | 980 | 8426 | 417 | 12 806 | 563 |
| 75 to 82 | 18 983 | 1437 | 9532 | 728 | 9451 | 709 |
| 83 to 107 | 18 781 | 2512 | 12 062 | 1658 | 6719 | 854 |
| Marital status | ||||||
| Single | 34 738 | 2971 | 21 381 | 2017 | 13 357 | 954 |
| Not single | 42 351 | 2153 | 14 885 | 751 | 27 466 | 1402 |
| No data | 2528 | 388 | 1312 | 251 | 1216 | 137 |
| Alcohol consumption | ||||||
| Low to moderate† | 62 240 | 3039 | 30 044 | 1614 | 32 196 | 1425 |
| High† | 5894 | 254 | 1173 | 61 | 4721 | 193 |
| No data | 11 483 | 2219 | 6361 | 1344 | 5122 | 875 |
| Smoking | ||||||
| Never | 23 593 | 1235 | 13 793 | 778 | 9800 | 457 |
| Ever | 42 803 | 1733 | 16 287 | 716 | 26 516 | 1017 |
| No data | 13 221 | 2544 | 7498 | 1525 | 5723 | 1019 |
| Diabetes mellitus | ||||||
| No | 66 313 | 4221 | 31 815 | 2302 | 34 498 | 1919 |
| Yes | 10 625 | 720 | 4365 | 347 | 6260 | 373 |
| No data | 2679 | 571 | 1398 | 370 | 1281 | 201 |
| Atrial fibrillation | ||||||
| No | 63 459 | 3605 | 28 965 | 1896 | 34 494 | 1709 |
| Yes | 13 090 | 1339 | 7094 | 775 | 5996 | 564 |
| No data | 3068 | 568 | 1519 | 348 | 1549 | 220 |
| Previous myocardial infarct | ||||||
| No | 68 397 | 4150 | 32 943 | 2264 | 35 454 | 1886 |
| Yes | 7313 | 602 | 2561 | 267 | 4752 | 335 |
| No data | 3907 | 760 | 2074 | 488 | 1833 | 272 |
| Hypertension | ||||||
| No | 36 006 | 2328 | 16 295 | 1268 | 19 711 | 1060 |
| Yes | 39 617 | 2469 | 19 289 | 1334 | 20 328 | 1135 |
| No data | 3994 | 715 | 1994 | 417 | 2000 | 298 |
| Stroke type | ||||||
| Hemotomas | 6602 | 1782 | 3196 | 952 | 3406 | 830 |
| Ischemic | 73 015 | 3730 | 34 382 | 2067 | 38 633 | 1663 |
| Intermittent arterial claudication | ||||||
| No | 59 745 | 3417 | 28 012 | 1838 | 31 733 | 1579 |
| Yes | 2422 | 150 | 956 | 72 | 1466 | 78 |
| No data | 17 450 | 1945 | 8610 | 1109 | 8840 | 836 |
| Quintile of disposable income | ||||||
| 1 | 21 622 | 1878 | 10 570 | 1038 | 11 052 | 840 |
| 2 | 25 348 | 1942 | 13 212 | 1167 | 12 136 | 775 |
| 3 | 12 948 | 812 | 6049 | 425 | 6899 | 387 |
| 4 | 9582 | 458 | 3973 | 211 | 5609 | 247 |
| 5 | 9879 | 417 | 3696 | 176 | 6183 | 241 |
| No data | 238 | 5 | 78 | 2 | 160 | 3 |
| Education | ||||||
| Higher | 9516 | 477 | 3592 | 171 | 5924 | 306 |
| Vocational | 31 206 | 1479 | 12 298 | 646 | 18 908 | 833 |
| Unknown | 11 536 | 1638 | 7328 | 1103 | 4208 | 535 |
| Basic | 27 359 | 1918 | 14 360 | 1099 | 12 999 | 819 |
| Severity score | ||||||
| 0 to 34 | 20 244 | 4688 | 11 130 | 2647 | 9114 | 2041 |
| 35 to 49 | 21 640 | 600 | 10 551 | 283 | 11 089 | 317 |
| 50 to 55 | 19 148 | 157 | 8506 | 70 | 10 642 | 87 |
| 56 to 60 | 18 585 | 67 | 7391 | 19 | 11 194 | 48 |
| Body mass index, kg/m2 | ||||||
| <20 | 5220 | 382 | 3750 | 287 | 1470 | 95 |
| 20 to 25 | 20 985 | 742 | 10 402 | 401 | 10 583 | 341 |
| 25 to 30 | 18 544 | 462 | 6935 | 197 | 11 609 | 265 |
| >30 | 9063 | 209 | 4047 | 107 | 5016 | 102 |
| No data | 25 805 | 3717 | 12 444 | 2027 | 13 361 | 1690 |
| Previous stroke | ||||||
| No | 60 673 | 3557 | 28 735 | 1928 | 31 938 | 1629 |
| Yes | 15 881 | 1332 | 7189 | 693 | 8692 | 639 |
| No data | 3063 | 623 | 1654 | 398 | 1409 | 225 |
Age and severity score are categorized in quartiles.
Deaths from stroke are deaths within 1 month of admission.
High alcohol consumption: >14 drinks/week for women and ≥21 for men. Low to moderate alcohol consumption: ≤14 drinks/week for women and ≤21 for men.
Age- and sex-specific stroke severity (all stroke) adjusted for cardiovascular risk factors, stroke subtype, marital status, and socioeconomic position by multiple imputation for all 79 617 cases is shown in Figure1, which indicates that after the age of 60 years, women had more severe strokes than men, with the increase being significant among those aged early 70s and older. The same results were seen when analyzing ischemic stroke (Figure2) and hemorrhagic stroke (Figure3) separately, although results were insignificant for the latter.
Figure 2.
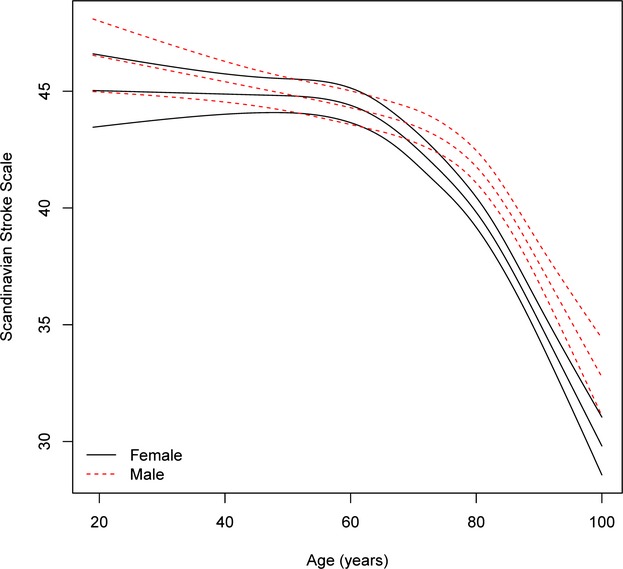
Age-specific stroke severity in men and women with ischemic stroke after adjustment for cardiovascular risk profile, income, and education and multiple imputation. For each sex, the mean severity as a function of age is given with 95% pointwise confidence limits. The interaction between age and sex is significant (P<0.0001), namely, the association between age and severity is significantly different for men and women.
Figure 3.
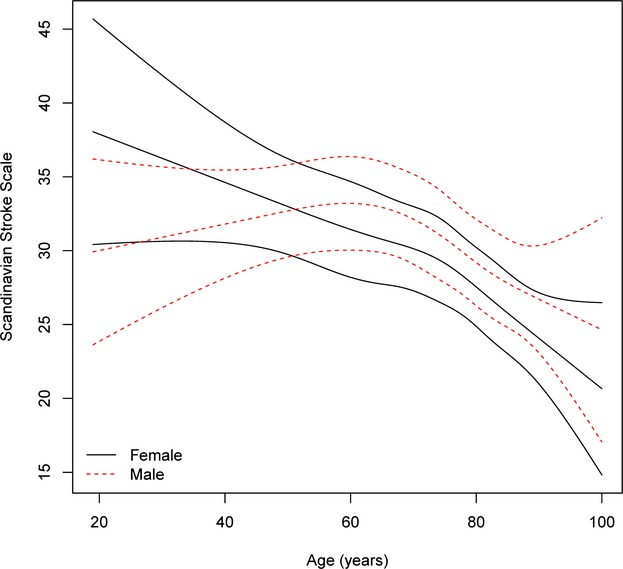
Age-specific stroke severity in men and women with hemorrhagic stroke after adjustment for cardiovascular risk profile, income, and education and multiple imputation. For each sex, the mean severity as function of age is given with 95% pointwise confidence limits. The interaction between age and sex is insignificant (P=0.1032), namely, the association between age and severity is not significantly different for men and women.
Of the 79 617 patients, 4373 (5.5%) died within the first week of their stroke, and stroke was given as the cause of death on the death certificates of 3334 (4.2%). Within the first month, 7878 patients (9.9%) died, and stroke was given as the cause of death on the death certificates of 5512 (6.9%). Consequently, stroke was the cause of death on death certificates in 76% of cases within the first week and in 70% of cases within the first month after stroke.
The following causes of death (other than stroke) within 1 week or 1 month were noted: heart disease (535 or 1176 patients), cancer (110 or 310 patients), respiratory disease (68 or 172), and other diseases (326 or 668 patients).
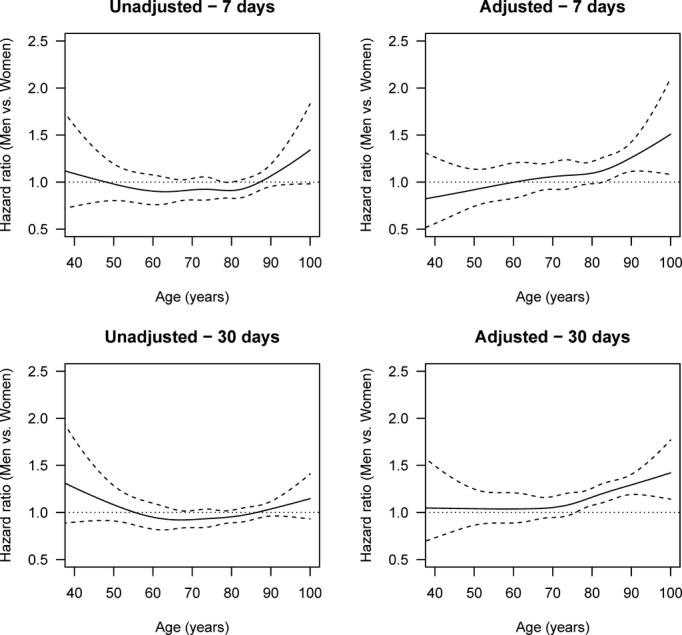
Figure4 shows the sex-specific risk for death by all stroke within 1 week and 1 month after the stroke, unadjusted and adjusted for age, sex, stroke severity, stroke subtype, marital status, cardiovascular risk factors, duration of education, and income.
Figure 4.
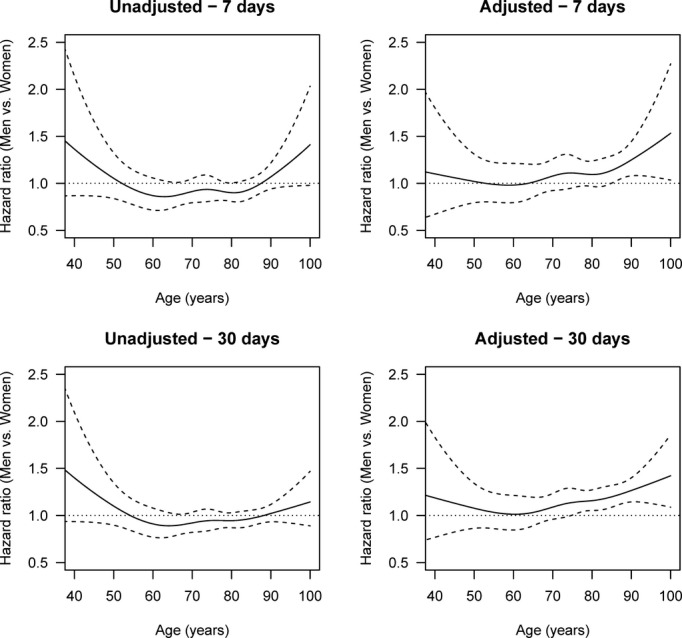
Age-specific HRs of death by stroke (men vs women), adjusted and unadjusted for stroke severity, cardiovascular risk profile, income, and education and with multiple imputation after 1 week and 1 month. The solid line is the HR, and the dashed lines are 95% pointwise confidence intervals. The horizontal line at HR 1.0 corresponds to the same hazard for men and women, and thus statistical significance can be judged by comparing the confidence limits with this line. Global tests for differences between men and women in the adjusted analyses give P=0.0535 for 1 week and P<0.0001 for 1 month. HR indicates hazard ratio.
The unadjusted risk for death from stroke within the first month of hospital admission was higher for women than for men aged 50 to 85 years, although it was insignificant; however, adjustment for stroke severity, stroke subtype, civil status, cardiovascular risk factors, duration of education, and income changed this finding. Men and women aged up to their mid-60s showed no difference in risk of death from stroke. After the age of 65 years, however, the risk for men gradually increased beyond the risk for women and significantly so (>15%; lower confidence limit >1) among those in their mid-70s (death within 1 month) and mid-80s (death within 1 week). The result of an analysis based on all-cause death (stroke, heart disease, cancer, respiratory disease, other diseases) was essentially the same (Figure5). Separate analyses for death by ischemic stroke (Figure6) and hemorrhagic stroke (Figure7) revealed the same trend of a female survival advantage among elderly stroke patients, although the advantage was insignificant in some cases due to the lower statistical power in the stratified analysis.
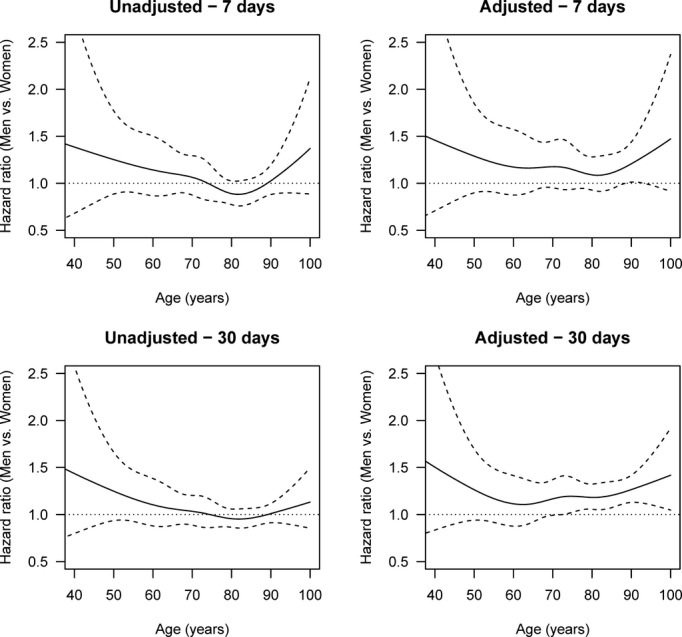
Figure 5.
Age-specific HRs of death by all causes (men vs women), adjusted and unadjusted for stroke severity, cardiovascular risk profile, income, and education and with multiple imputation after 1 week and 1 month. The solid lines are the HRs, and the dashed lines are 95% pointwise confidence intervals. The horizontal line at HR 1.0 corresponds to the same hazard for men and women, and thus statistical significance can be judged by comparing the confidence limits with this line. Global tests for differences between men and women in the adjusted analyses give P=0.0095 for 1 week and P<0.0001 for 1 month. HR indicates hazard ratio.
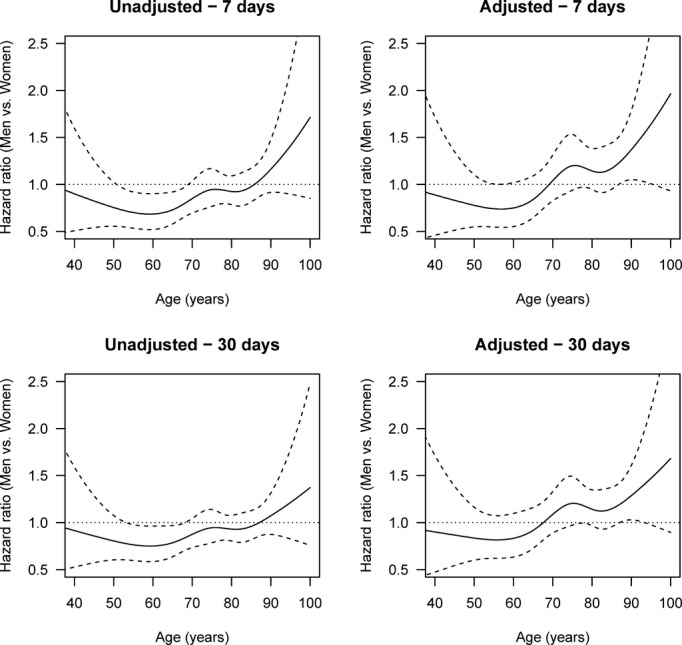
Figure 6.
Age-specific HRs of death by stroke (men vs women), adjusted and unadjusted for stroke severity, cardiovascular risk profile, income, and education and with multiple imputation after 1 week and 1 month (ischemic strokes). The solid lines are the HRs, and the dashed lines are 95% pointwise confidence intervals. The horizontal line at HR 1.0 corresponds to the same hazard for men and women, and thus statistical significance can be judged by comparing the confidence limits with this line. Global tests for differences between men and women in the adjusted analyses give P=0.0995 for 1 week and P=0.0001 for 1 month. HR indicates hazard ratio.
Figure 7.
Age-specific HRs of death by stroke (men vs women), adjusted and unadjusted for stroke severity, cardiovascular risk profile, income, and education and with multiple imputation after 1 week and 1 month (hemorrhagic stroke). The solid lines are the HRs, and the dashed lines are 95% pointwise confidence intervals. The horizontal line at HR 1.0 corresponds to the same hazard for men and women, and thus statistical significance can be judged by comparing the confidence limits with this line. Global tests for differences between men and women in the adjusted analyses give P=0.0483 for 1 week and P=0.0735 for 1 month. HR indicates hazard ratio.
Discussion
This study demonstrates sex disparities in stroke severity and survival. Although little difference was seen at younger ages, elderly women were affected more severely than men but were more likely to survive.
Most studies have indicated that stroke is more severe in women than in men, although the finding has been regarded as a result of confounding by age.5 As shown in our study, women are usually older than men when they have a stroke, and severity increases with age; however, even after adjustment for cardiovascular risk profile, socioeconomic status, and age, stroke remained more severe in women. Severity is the most important determinant of short-term survival after a stroke,20 and information on this aspect is essential for examining sex differences in mortality after stroke. In its absence, mortality among women will inevitably appear higher than that among men because stroke severity is linked directly to the risk of death after stroke.
In studying sex differences in stroke survival, information on stroke severity is useful only if the deaths studied are due to an index stroke for which information on severity is available. If death is due to diseases other than the index stroke and no information on severity before death is available, information on the severity of the index stroke is of no value because the death was not necessarily due to the index stroke. In our study, one-third of deaths within the first month after a stroke were due to diseases other than the index stroke. Information on stroke severity was not available in many studies of sex differences in stroke survival.21 Because stroke is generally more severe in women, these studies were subject to selection bias and gave the impression that the survival of women was poorer than that of men. Studies in which information on stroke severity was available7–11 also included deaths due to any cause, thereby introducing potential bias because men’s and women’s survival capacity was compared in the absence of information on the severity of the diseases leading to death for large numbers of patients (in our study, one-third of the population). To the best of our knowledge, we are the first to study sex differences in death due to an index stroke with information on the severity of the disease leading to death (in this case, the index stroke) for all cases. In this way, we obviated potential bias.
Our study gives no explanation of difference in survival or severity of stroke between men and women. The size of stroke lesions (infarcts or hematomas) relative to brain volume may differ between men and women, but we had no information on this factor. Clinically, women may respond differently from men to the same brain lesion. There is now strong evidence of sexual dimorphism in stroke, with differences observed both clinically and in the laboratory.22 Women suffer greater stroke-related disability and poorer quality of life than men after stroke.3,4 Experimentally, ischemia-induced cell death pathways differ between the 2 sexes.23 In vivo models of ischemic stroke have shown smaller infarcts in younger women and larger infarcts with age compared with men.24 The heavier load of cardiovascular risk factors associated with male sex cannot explain the female survival advantage because we adjusted for sex differences in the cardiovascular risk factor profile. The difference in survival between men and women was seen around the age of 65 years and appeared to increase with age. Although this conclusion is speculative, the difference could be a result of the progressive decrease in testosterone in elderly men. New evidence indicates that low androgen levels are associated with death from all causes, in particular from cardiovascular disease.25,26 Testosterone is associated with many factors that might influence vital functions and processes in the acute state of stroke, such as blood glucose, blood pressure, insulin resistance, lipids, inflammatory cytokines, and vascular tone,26 and thus might influence survival in the acute stage of stroke.
Our study had both strengths and weaknesses. Its strength is its large sample size, which provided high statistical power. We included patients without limitation on age (>19 years), sex, or stroke severity. Stroke severity was measured on hospital admission with a well-validated neurological scale. Data on survival up to 1 month after a stroke, including causes of death recorded on death certificates, were complete, and we studied only deaths that were stated on death certificates as caused by stroke. In population-based studies, two-thirds of early deaths after stroke were reported to be due to the index stroke,27–29 and this finding was corroborated in our study, in which 70% of deaths within 1 month of a stroke were due to stroke, as stated on death certificates. Although useful in determining cause of death,30 death certificates are subject to some uncertainty.31 In another Scandinavian study,32 reevaluation of the accuracy of death certificates revealed disagreement of 45% at the 4-digit ICD-10 level and 12% to 13% at the 3-digit level (the ICD-10 level used in this study). The validity of causes of death according to death certificates should be seen in this light. Because we limited our study to deaths occurring in close relation to the stroke incident, within 1 week and 1 month of the stroke, we consider the deaths studied, for the most part, to be related to the index stroke. Although ischemic and hemorrhagic strokes carry different mortality rates, especially in the acute stage,33 the results of separate analyses for ischemic and hemorrhagic strokes were essentially the same as those of the analysis of all strokes. Finally, the results of a sensitivity analysis including death by all causes did not deviate from those of the analysis of death by stroke.
Although the Danish Stroke Registry is a nationwide registry of all patients admitted to the hospital for acute stroke, its coverage is not yet complete (presently estimated to be ≈80%).13 The completeness of data on diabetes, previous myocardial infarct, atrial fibrillation, and hypertension was >95%, and completeness for alcohol consumption, smoking, and intermittent arterial claudication data was >78%. Treatment would have been uniform because 96% of patients were treated in a stroke unit. Nevertheless, we applied multiple imputation to compensate for missing information. When we restricted the analysis to the 33 359 patients for whom complete information was available on all variables (data not shown), our conclusion remained the same: Elderly women were more likely to survive stroke than elderly men. We cannot exclude the possibility of bias due to variables (that might have influenced survival) not recorded in the registry; however, differences in quality of treatment between men and women can hardly explain women’s survival advantage. A study based on 29 549 stroke patients in the Danish Stroke Registry observed no substantial sex-related differences in the quality of acute hospital care in Denmark, and sex-related differences in mortality appeared not to be explained by differences in acute hospital care.11
In conclusion, sex disparities in stroke are usually considered to be the result of confounding by age and comorbidity before the stroke; however, this study provided evidence of innate sex-specific differences. Strokes were more severe in women; therefore, adjustment for stroke severity is essential when studying stroke outcomes. The excess mortality among women in the unadjusted analysis was replaced by excess mortality among men in their mid-60s and older in our adjusted analyses. Our study is the first with information on the severity of stroke resulting in death, so the dominant determinants of death due to this cause (ie, age and stroke severity) were taken into account. Our results show an innate female superiority in likelyhood of survival after stroke. Both experimental and clinical research on stroke has been conducted in populations dominated by young men, whereas most stroke patients are elderly and female, and it was in this group of stroke patients that sex differences in stroke severity and survival were seen. A true picture of the clinical reality can be seen only if more focus is directed to elderly patients and if outcomes are evaluated for each sex.
Disclosures
None.
References
- Lopez AD, Mathers CD, Ezzati M, Jamison DT, Murray CJL. Global and regional burden of disease and risk factors, 2001: systematic analysis of population health data. Lancet. 2006;367:1747–1757. doi: 10.1016/S0140-6736(06)68770-9. [DOI] [PubMed] [Google Scholar]
- Zhou G, Nie S, Dai L, Wang X, Fan W. Sex differences in stroke case fatality: a meta-analysis. Acta Neurol Scand. 2013;128:1–8. doi: 10.1111/ane.12091. [DOI] [PubMed] [Google Scholar]
- Bushnell C, McCullough LD, Awad IA, Chireau MV, Fedder WN, Furie KL, Howard VJ, Lichtman JH, Lisabeth LD, Piña IL, Reeves MJ, Rexrode KM, Saposnik G, Singh V, Towfighi A, Vaccarino V, Walters MR. Guidelines for the prevention of stroke in women: a statement for healthcare professionals from the American Heart Association/American Stroke Association. Stroke. 2014;45:1545–1588. doi: 10.1161/01.str.0000442009.06663.48. [DOI] [PMC free article] [PubMed] [Google Scholar]
- Reeves MJ, Bushnell CD, Howard G, Gargano JW, Duncan PW, Lynch G, Khatiwoda A, Lisabeth L. Sex differences in stroke: epidemiology, clinical presentation, medical care, and outcomes. Lancet Neurol. 2008;7:915–926. doi: 10.1016/S1474-4422(08)70193-5. [DOI] [PMC free article] [PubMed] [Google Scholar]
- Reeves MJ, Lisabeth LD. The confounding issue of sex and stroke. Neurology. 2010;74:947–948. doi: 10.1212/WNL.0b013e3181d5a4bc. [DOI] [PubMed] [Google Scholar]
- Di Carlo A, Lamassa M, Consoli D, Valentina V, Inzitari D. Sex differences in presentation, severity, and management of stroke in a population-based study. Neurology. 2010;75:670–671. doi: 10.1212/WNL.0b013e3181ec68b5. [DOI] [PubMed] [Google Scholar]
- Glader EL, Stegmayr B, Norrving B, Terent A, Hulter-Asberg K, Wester PO, Asplund K. Sex differences in management and outcome after stroke: a Swedish national perspective. Stroke. 2003;34:1970–1975. doi: 10.1161/01.STR.0000083534.81284.C5. [DOI] [PubMed] [Google Scholar]
- Labiche LA, Chan W, Saldin KR, Morgenstern LB. Sex and acute stroke presentation. Ann Emerg Med. 2002;40:453–460. doi: 10.1067/mem.2002.128682. [DOI] [PubMed] [Google Scholar]
- Kapral MK, Fang J, Hill MD, Silver F, Richards J, Jaigobin C, Cheung AM. Sex differences in stroke care and outcomes: results from the Registry of the Canadian Stroke Network. Stroke. 2005;36:809–814. doi: 10.1161/01.STR.0000157662.09551.e5. [DOI] [PubMed] [Google Scholar]
- Olsen TS, Dehlendorff C, Andersen KK. Sex-related time-dependent variations in post-stroke survival: evidence of a female stroke survival advantage. Neuroepidemiology. 2007;29:218–225. doi: 10.1159/000112464. [DOI] [PMC free article] [PubMed] [Google Scholar]
- Palnum KD, Andersen G, Ingeman A, Krog BR, Bartels P, Johnsen SP. Sex-related differences in quality of care and short-term mortality among patients with acute stroke in Denmark: a nationwide follow-up study. Stroke. 2009;40:1134–1139. doi: 10.1161/STROKEAHA.108.543819. [DOI] [PubMed] [Google Scholar]
- Mainz J, Krog BR, Bjørnshave B, Bartels P. Nationwide continuous quality improvement using clinical indicators: the Danish National Indicator Project. Int J Qual Health Care. 2004;16(suppl I):145–150. doi: 10.1093/intqhc/mzh031. [DOI] [PubMed] [Google Scholar]
- NIP-apopleksi. National auditrapport 2010. Version 3. 24. 03. 2011. Available at: https://www.sundhed.dk/content/cms/69/4669_2010_apopleksi_nat_sfa.pdf. Accessed October 23, 2013.
- Lindenstrøm E, Boysen G, Christiansen LW, á Rogvi-Hansen B, Nielsen BW. Reliability of Scandinavian stroke scale. Cerebrovasc Dis. 1991;1:103–107. [Google Scholar]
- Report of the WHO Task Force on Stroke and other Cerebrovascular Disorders: recommendations on stroke prevention, diagnosis, and therapy. Stroke. 1989;20:1407–1431. doi: 10.1161/01.str.20.10.1407. [DOI] [PubMed] [Google Scholar]
- Dalton SO, Steding-Jessen M, Gislum M, Frederiksen K, Engholm G, Schuz J. Social inequality and incidence of and survival from cancer in a population-based study in Denmark, 1994–2003: background, aims, material and methods. Eur J Cancer. 2008;44:1938–1949. doi: 10.1016/j.ejca.2008.06.010. [DOI] [PubMed] [Google Scholar]
- World Health Organization. 1992. Geneva International statistical classification of diseases and related health problems, 10th rev. Available at: http://apps.who.int/classifications/icd10/browse/Help/en. Accessed October 15, 2014.
- Robins JM, Hernán MA, Brumback B. Marginal structural models and casual inference in epidemiology. Epidemiology. 2000;11:550–560. doi: 10.1097/00001648-200009000-00011. [DOI] [PubMed] [Google Scholar]
- R Development Core Team. R: A Language and Environment for Statistical Computing. Vienna: R Foundation for Statistical Computing; 2010. . Available at: http://www.R-project.org/. Accessed October 9, 2014. [Google Scholar]
- Andersen KK, Olsen TS. One-month to 10-year survival in the Copenhagen stroke study: interactions between stroke severity and other prognostic indicators. J Stroke Cerebrovasc Dis. 2011;20:117–123. doi: 10.1016/j.jstrokecerebrovasdis.2009.10.009. [DOI] [PubMed] [Google Scholar]
- Appelros P, Stegmayer B, Terent A. Sex differences in stroke epidemiology: a systematic review. Stroke. 2009;40:1082–1090. doi: 10.1161/STROKEAHA.108.540781. [DOI] [PubMed] [Google Scholar]
- Herson PS, Palmateer J, Hurn PD. Biological sex and mechanisms of ischemic brain injury. Transl Stroke Res. 2013;1:413–419. doi: 10.1007/s12975-012-0238-x. [DOI] [PMC free article] [PubMed] [Google Scholar]
- Turtzo LC, McCullough LD. Sex-specific responses to stroke. Future Neurol. 2010;5:47–59. doi: 10.2217/fnl.09.66. [DOI] [PMC free article] [PubMed] [Google Scholar]
- Manwani B, McCullough LD. Sexual dimorphism in ischemic stroke: lessons from the laboratory. Womens Health. 2011;7:319–339. doi: 10.2217/whe.11.22. [DOI] [PMC free article] [PubMed] [Google Scholar]
- Herring MJ, Oskui PM, Hale SL, Kloner RA. Testosterone and the cardiovascular system: a comprehensive review of the basic science literature. J Am Heart Assoc. 2013;2:e000271. doi: 10.1161/JAHA.113.000271. doi: 10.1161/JAHA.113.000271. [DOI] [PMC free article] [PubMed] [Google Scholar]
- Basaria S, Dobs AS. Testosterone making an entry into the cardiometabolic world. Circulation. 2007;116:2658–2661. doi: 10.1161/CIRCULATIONAHA.107.740365. [DOI] [PubMed] [Google Scholar]
- Hankey GJ, Jamrozik K, Broadhurst RJ, Forbes S, Burvill PW, Anderson CS, Stewart-Wynne EG. Five-year survival after first-ever stroke and related prognostic factors in the Perth Community Stroke Study. Stroke. 2000;31:2080–2086. doi: 10.1161/01.str.31.9.2080. [DOI] [PubMed] [Google Scholar]
- Kiyohara Y, Kubo M, Kato I, Tanizaki Y, Tanaka K, Okubo K, Iida M. Ten-year prognosis of stroke and risk factors for death in a Japanese community: the Hisayama study. Stroke. 2003;34:2343–2347. doi: 10.1161/01.STR.0000091845.14833.43. [DOI] [PubMed] [Google Scholar]
- Lavados PM, Sacks C, Prina L, Escobar A, Tossi C, Araya F, Feuerhake W, Galvez M, Salinas R, Alvarez G. Incidence, 30-day case-fatality rate, and prognosis of stroke in Iquique, Chile: a 2-year community-based prospective study (PISCIS project) Lancet. 2005;365:2206–2215. doi: 10.1016/S0140-6736(05)66779-7. [DOI] [PubMed] [Google Scholar]
- Lahti RA, Penttilä A. The validity of death certificates: routine validation of death certification and its effects on mortality statistics. Forensic Sci Int. 2001;115:15–32. doi: 10.1016/s0379-0738(00)00300-5. [DOI] [PubMed] [Google Scholar]
- Helweg-Larsen K. The Danish register of causes of death. Scand J Public Health. 2011;39(suppl 7):26–29. doi: 10.1177/1403494811399958. [DOI] [PubMed] [Google Scholar]
- Eriksson A, Stenlund H, Ahlm K, Boman K, Bygren LO, Johansson LA, Olofsson BO, Wall S, Weinehall L. Accuracy of death certificates of cardiovascular disease in a community intervention in Sweden. Scand J Public Health. 2013;41:883–889. doi: 10.1177/1403494813499653. [DOI] [PubMed] [Google Scholar]
- Andersen KK, Olsen TS, Dehlendorff C, Kammersgaard LP. Hemorrhagic and ischemic strokes compared: stroke severity, mortality, and risk factors. Stroke. 2009;40:2068–2072. doi: 10.1161/STROKEAHA.108.540112. [DOI] [PubMed] [Google Scholar]