

Abstract
Background
The “obesity paradox” reflects an observed relationship between obesity and decreased morbidity and mortality, suggesting improved health outcomes for obese individuals. Studies examining the relationship between high body mass index (BMI) and adverse outcomes after cardiac surgery have reported conflicting results.
Methods and Results
The study population (N=78 762) was comprised of adult patients who had undergone first-time coronary artery bypass (CABG) or combined CABG/aortic valve replacement (AVR) surgery from April 1, 1998 to October 31, 2011 in Ontario (data from the Institute for Clinical Evaluative Sciences). Perioperative outcomes and 5-year mortality among pre-defined BMI (kg/m2) categories (underweight <20, normal weight 20 to 24.9, overweight 25 to 29.9, obese 30 to 34.9, morbidly obese >34.9) were compared using Bivariate analyses and Cox multivariate regression analysis to investigate multiple confounders on the relationship between BMI and adverse outcomes. A reverse J-shaped curve was found between BMI and mortality with their respective hazard ratios. Independent of confounding variables, 30-day, 1-year, and 5-year survival rates were highest for the obese group of patients (99.1% [95% Confidence Interval {CI}, 98.9 to 99.2], 97.6% [95% CI, 97.3 to 97.8], and 90.0% [95% CI, 89.5 to 90.5], respectively), and perioperative complications lowest. Underweight and morbidly obese patients had higher mortality and incidence of adverse outcomes.
Conclusions
Overweight and obese patients had lower mortality and adverse perioperative outcomes after cardiac surgery compared with normal weight, underweight, and morbidly obese patients. The “obesity paradox” was confirmed for overweight and moderately obese patients. This may impact health resource planning, shifting the focus to morbidly obese and underweight patients prior to, during, and after cardiac surgery.
Keywords: body mass index, bypass graft, coronary artery bypass graft, mortality, obesity
Obesity is a risk factor for premature death due to cardiovascular disease and cancer.1–4 An “obesity paradox” has been described,5 which reflects a relationship between obesity, compared with normal weight, and decreased mortality. It refers to counter-intuitive epidemiological evidence suggesting improved health outcomes for obese individuals in a variety of clinical situations.1 This paradoxical association has been demonstrated in diabetes, end-stage renal disease, hypertension, heart failure, established coronary artery disease (CAD) and peripheral arterial disease.2,6,7
Studies examining the relationship between obesity and adverse outcomes following cardiac surgery have reported conflicting results. For example, underweight and morbidly obese patients were shown to require longer postoperative ventilation than moderately obese patients.8–10 Recent studies demonstrate that obesity affects coronary artery bypass graft surgery (CABG) patients in an advantageous or neutral manner,7,11 but are at odds with prior studies which suggest a higher mortality and morbidity in obese patients compared with normal weight patients following CABG.3 Our group previously demonstrated that obesity is a risk factor for failure of “fast track” extubation following CABG.8 However, most of these studies have small samples and short-term follow-up. Given these limitations, we designed the current study to investigate the relationship between body mass index (BMI) and mortality and other outcomes following cardiac surgery, in a large sample with long-term follow-up, using administrative datasets housed at the Institute for Clinical Evaluative Sciences (ICES) in Ontario, Canada. We sought to determine if BMI is a predictor in determining outcomes following cardiac surgery.
Methods
Study Population
The study population included patients over 18 years old who had an initial CABG or combined CABG and open chest aortic valve replacement (AVR), from April 1, 1998 to October 31, 2011 in Ontario. The date of first cardiac surgery was the index date, and eligible patients were followed for 1 year with respect to major outcomes, and 5 years for mortality. Preoperative data were included for 1 year prior to surgery, and outcomes for 1 year postoperatively. Patients for whom sex, age, height, weight were missing, and patients living outside of Ontario or of unknown residence were excluded. Cardiac Care Network of Ontario (CCN) data were used to identify baseline characteristics such as cardiac ejection fraction, number of grafts bypassed, prior myocardial infarction (MI), emergency or elective surgery, and other co-morbidities. CCN data and the following datasets were combined from ICES using deterministic linkage by unique ICES key number identifiers: Ontario Health Insurance Plan, Canadian Institute of Health Information (CIHI) Discharge Abstract Database, National Ambulatory Care Reporting System, Same Day Surgery, and the Registered Persons Database. This study received ethics approval from the Queen’s University Research Ethics Board.
Patients who had undergone either isolated CABG or combined CABG/AVR were selected from the CIHI Discharge Abstract Database. Data for which other cardiac procedures had been performed during the same admission were excluded (eg, percutaneous coronary intervention or other valve procedures).
Baseline Characteristics and Comorbidities
Baseline characteristics on index date included age, sex, and BMI. BMI was calculated as weight (kg)/height (m2), and patients were divided into groups: underweight (BMI <20 kg/m2), normal weight (BMI 20.0 to 24.9 kg/m2), overweight (BMI 25.0 to 29.9 kg/m2), obese (BMI 30.0 to 34.9 kg/m2), and morbidly obese (BMI >34.9 kg/m2), closely based on World Health Organization (WHO) and Health Canada guidelines.12–14 The following comorbidities were assessed for presence within 1 year prior to index date: diabetes, smoking history (current or ever smoked), peripheral vascular disease (PVD), chronic obstructive pulmonary disease (COPD), dialysis within 1 year prior to surgery, cerebrovascular disease (CVD), congestive heart failure (CHF, from CIHI), hypertension, elective or emergent surgery, creatinine. Within 30 days prior to surgery, the following cardiac characteristics were captured: ejection fraction, prior MI, left main coronary disease, and previous CABG at date of surgery. At index date, the cardiac characteristics were number of grafts, off-pump surgery, and type of operation. The Elixhauser index, a measurement score that includes 30 co-existing conditions, was used to account for baseline comorbidities that are predictive of long-term mortality.15,16
Outcome Definition
From index date to date of discharge, outcomes of interest were surgery type, total length of stay (LOS) in hospital, LOS excluding Alternative Level of Care-LOS, surgery duration, reoperation, time in intensive care unit (ICU), postoperative creatinine, blood transfusion, dialysis, stroke, MI, and death at discharge during hospital admission, and transfusion of blood products. Post-discharge outcomes collected included readmission rates within 60 days of discharge, dialysis, stroke, and MI within 60 days and 1 year of discharge, and mortality at 30 days, 1 and 5 years.
Statistical Analysis
Mean and standard deviation (SD) were used for continuous variables, and categorical variables were expressed as percentages. To detect differences between the BMI groups, ANOVA was used, and Mann-Kendall trend test was used to test significant differences in BMI over time. Five-year mortality was compared using bivariate analyses, and Cox multivariate regression analysis to investigate multiple confounders on the relationship between BMI and patient mortality, providing hazard ratios and 95% confidence intervals (CI). Age, gender, diabetes, smoking history, PVD, COPD, dialysis, hypertension, serum creatinine, CVD, CHF, Elixhauser index, surgery type, LOS, reoperation, blood transfusion, stroke in hospital, MI in hospital, dialysis within 1 year, stroke within 1 year, MI within 1 year, ejection fraction, prior MI, elective or emergent surgery, left main coronary disease, previous CABG, and BMI were included in the model. For missing values, analyses were conducted adjusting the denominator. SAS software (version 9.3, Statistical Analysis System Institute) was used for statistical analyses, with P<0.05 considered significant.
Results
The study population consisted of 78 762 patients. Tables1 through 3 show preoperative characteristics and postoperative outcomes. Where specific values were not available for all study years, total sample size analyzed is indicated.
Table 1.
Baseline Characteristics
| Variable | Under Weight (n=1228) | Normal Weight (n=17 162) | Over Weight (n=34 597) | Obese (n=18 147) | Morbidly Obese (n=7628) | Total (n=78 762) | P Value* |
|---|---|---|---|---|---|---|---|
| Age at admission | |||||||
| Mean±SD | 67.81±10.95 | 66.86±10.23 | 65.37±9.90 | 63.67±9.73 | 61.78±9.61 | 64.99±10.04 | <0.001 |
| Sex | |||||||
| Female, n (%) | 501 (40.8) | 3985 (23.2) | 6156 (17.8) | 3790 (20.9) | 2261 (29.6) | 16 693 (21.2) | <0.001 |
| Weight, kg | |||||||
| Mean±SD | 53.17±7.50 | 66.87±8.15 | 79.71±9.27 | 92.28±10.86 | 109.32±18.08 | 82.26±16.54 | <0.001 |
| Body mass index | |||||||
| Mean±SD | 18.72±1.34 | 23.29±1.26 | 27.45±1.39 | 32.03±1.38 | 39.69±9.67 | 28.65±5.80 | <0.001 |
| Diabetes | |||||||
| n (%) | 410 (33.4) | 5990 (34.9) | 12 560 (36.3) | 8253 (45.5) | 4409 (57.8) | 31 622 (40.1) | <0.001 |
| Smoke history | |||||||
| n (%) | 696 (56.7) | 9341 (54.4) | 20 705 (59.8) | 11 531 (63.5) | 4934 (64.7) | 47 207 (59.9) | <0.001 |
| Peripheral vascular disease | |||||||
| n (%) | 213 (17.3) | 2249 (13.1) | 3993 (11.5) | 2099 (11.6) | 814 (10.7) | 9368 (11.9) | <0.001 |
| Chronic obstructive pulmonary disease | |||||||
| n (%) | 174 (14.2) | 1262 (7.4) | 2219 (6.4) | 1380 (7.6) | 792 (10.4) | 5827 (7.4) | <0.001 |
| Dialysis within 1 year prior to surgery | |||||||
| n (%) | 17 (1.4) | 130 (0.8) | 127 (0.4) | 62 (0.3) | 38 (0.5) | 374 (0.5) | <0.001 |
| Cerebrovascular disease | |||||||
| n (%) | 143 (11.6) | 1817 (10.6) | 3269 (9.4) | 1557 (8.6) | 654 (8.6) | 7440 (9.4) | <0.001 |
| CHF status | |||||||
| n (%) | 43 (3.5) | 344 (2.0) | 506 (1.5) | 239 (1.3) | 129 (1.7) | 1261 (1.6) | <0.001 |
| Number of grafts | |||||||
| Mean±SD | 2.55±0.78 | 2.61±0.76 | 2.63±0.74 | 2.61±0.75 | 2.57±0.77 | 2.61±0.75 | <0.001 |
| Median (IQR) | 3 (2 to 3) | 3 (2 to 3) | 3 (2 to 3) | 3 (2 to 3) | 3 (2 to 3) | 3 (2 to 3) | <0.001 |
| Off pump | |||||||
| n (%) | 69 (5.6) | 657 (3.8) | 1196 (3.5) | 612 (3.4) | 256 (3.4) | 2790 (3.5) | <0.001 |
| Elixhauser index | |||||||
| Mean±SD | 2.88±2.04 | 2.35±1.84 | 2.22±1.75 | 2.45±1.83 | 3.02±1.96 | 2.39±1.83 | <0.001 |
| Median (IQR) | 3 (1 to 4) | 2 (1 to 3) | 2 (1 to 3) | 2 (1 to 3) | 3 (2 to 4) | 2 (1 to 3) | <0.001 |
| Hypertension (n=30 931)† | |||||||
| n (%) | 342 (63.3) | 4619 (66.3) | 8952 (69.1) | 5304 (74.2) | 2646 (79.7) | 21 863 (70.7) | <0.001 |
| Ejection fraction (n=40 349)† | |||||||
| 1, n (%) | 253 (43.5) | 3985 (47.2) | 8767 (48.4) | 4444 (47.0) | 1752 (46.6) | 19 201 (47.6) | 0.007 |
| 2, n (%) | 168 (28.9) | 2445 (28.9) | 5285 (29.2) | 2883 (30.5) | 1125 (30.0) | 11 906 (29.5) | |
| 3 or 4, n (%) | 118 (20.3) | 1433 (17.0) | 2891 (16.0) | 1481 (15.7) | 603 (16.1) | 6526 (16.2) | |
| Prior myocardial infarction | |||||||
| n (%) | 68 (26.4) | 886 (25.1) | 1360 (23.2) | 793 (24.5) | 385 (24.7) | 3492 (24.2) | 0.214 |
| Left main disease (n=34 994)† | |||||||
| n (%) | 141 (28.0) | 1878 (26.6) | 3771 (24.2) | 1809 (21.9) | 747 (21.0) | 8346 (23.8) | <0.001 |
| Emergent or non-emergent (n=53 230)† | |||||||
| Emergent, n (%) | 7 (0.9) | 126 (1.1) | 202 (0.8) | 87 (0.7) | 25 (0.5) | 447 (0.8) | 0.004 |
| Non-emergent, n (%) | 767 (98.5) | 11 103 (98.4) | 23 687 (98.7) | 12 123 (98.9) | 4864 (99.2) | 52 544 (98.7) | |
| Creatinine, μmol/L (n=30 886)† | |||||||
| Mean±SD | 99.59±82.00 | 98.15±61.29 | 96.44±55.26 | 96.35±55.08 | 95.07±48.60 | 96.76±56.71 | 0.102 |
| >180, n (%) | 27 (5.1) | 164 (2.3) | 236 (1.8) | 115 (1.6) | 59 (2.0) | 601 (1.9) | <0.001 |
ANOVA indicates analysis of variance; CHF, congestive heart failure; SD, standard deviation.
Overall, by ANOVA.
Where data are missing, total n is indicated in the variable cell.
Table 3.
Patient Outcomes After Discharge
| Variable | Under Weight (n=1228) | Normal Weight (n=17 162) | Over Weight (n=34 597) | Obese (n=18 147) | Morbidly Obese (n=7628) | Total (n=78 762) | P Value* |
|---|---|---|---|---|---|---|---|
| 1-year mortality | 107 (8.7) | 663 (3.9) | 906 (2.6) | 447 (2.5) | 235 (3.1) | 2358 (3.0) | <0.001 |
| 5-year mortality | 275 (22.4) | 2053 (12.0) | 3263 (9.4) | 1697 (9.4) | 826 (10.8) | 8114 (10.3) | <0.001 |
| Readmission within 60 days | 244 (19.9) | 2600 (15.1) | 4754 (13.7) | 2649 (14.6) | 1412 (18.5) | 11 659 (14.8) | <0.001 |
| Dialysis within 1 year | 19 (1.5) | 161 (0.9) | 237 (0.7) | 122 (0.7) | 83 (1.1) | 622 (0.8) | <0.001 |
| Stroke within 1 year | ≤5 (0.4) | 82 (0.5) | 148 (0.4) | 72 (0.4) | 38 (0.5) | 345 (0.4) | 0.722 |
| MI within 60 days | 18 (1.5) | 242 (1.4) | 363 (1.0) | 166 (0.9) | 87 (1.1) | 876 (1.1) | <0.001 |
| MI within 1 year | 42 (3.4) | 434 (2.5) | 708 (2.0) | 333 (1.8) | 166 (2.2) | 1683 (2.1) | <0.001 |
Variables are reported as n (%). ANOVA indicates analysis of variance; MI, myocardial infarction.
Overall difference, by ANOVA.
Baseline Characteristics
Table1 lists baseline characteristics of the BMI groups. Twenty-two percent of the patients were classified as normal weight (N=17 162), with 44% overweight (N=34 597), 23% obese (N=18 147), 10% morbidly obese (N=7628), and 2% underweight (N=1228). Underweight patients were the oldest (mean±SD: 68±11), constituted the largest number of females (41%), had the highest rates of PVD, COPD, dialysis, CVD, CHF, left ventricular grades 3 or 4, and left main coronary disease, creatinine. The morbidly obese group was the youngest, and experienced the highest rates of diabetes and hypertension. Although more obese/morbidly obese patients had any smoking history, more underweight patients were current smokers at the time of surgery, compared with normal weight patients. There was no difference in mean serum creatinine, but a significant difference in creatinine concentration >180 μmol/L. The median number of bypass grafts for all BMI groups was 3; and 3.5% of patients had off-pump surgery, with the underweight group having the most at 5.6%. There was an overall statistical difference between BMI groups in all baseline characteristics, except for mean serum creatinine and prior MI.
In-Hospital Clinical Outcomes
Table2 presents outcomes from index (surgery) date to date of discharge. Ninety-one percent of patients had CABG only and 9% combined surgery. The underweight group had the greatest hospital LOS, reoperation rates, ICU hours, dialysis, MI, and blood (red cell, platelet) transfusion, and number of deaths. The morbidly obese group experienced the longest surgery duration. The difference between BMI groups in postoperative serum creatinine and stroke was non-significant.
Table 2.
Perioperative Characteristics Occurring Between Surgery and Discharge, Unless Otherwise Indicated
| Variable | Under Weight (n=1228) | Normal Weight (n=17 162) | Over Weight (n=34 597) | Obese (n=18 147) | Morbidly Obese (n=7628) | Total (n=78 762) | P Value* |
|---|---|---|---|---|---|---|---|
| Surgery type | |||||||
| CABG only, n (%) | 1074 (87.5) | 15 611 (91.0) | 31 809 (91.9) | 16 587 (91.4) | 6911 (90.6) | 71 992 (91.4) | <0.001 |
| CABG+aortic, n (%) | 154 (12.5) | 1551 (9.0) | 2788 (8.1) | 1560 (8.6) | 717 (9.4) | 6770 (8.6) | |
| Length of hospital stay, days | |||||||
| Mean±SD | 8.6±8.5 | 7.6±7.7 | 7.2±7.0 | 7.4±7.5 | 8.1±8.6 | 7.4±7.5 | <0.001 |
| Length of hospital stay excluding alternative level of care, days | |||||||
| Mean±SD | 8.3±8.0 | 7.4±7.0 | 7.1±6.1 | 7.3±7.0 | 7.9±8.3 | 7.3±6.8 | <0.001 |
| Surgery duration, hours | |||||||
| Mean±SD | 4.4±1.3 | 4.3±1.3 | 4.4±1.5 | 4.5±1.4 | 4.7±1.3 | 4.5±1.4 | <0.001 |
| Reoperation | |||||||
| n (%) | 26 (2.1) | 204 (1.2) | 304 (0.9) | 126 (0.7) | 46 (0.6) | 706 (0.9) | <0.001 |
| Intensive care unit time, hours (n=52 715)† | |||||||
| Mean±SD | 95.4±156.2 | 77.3±124.5 | 70.0±124.8 | 75.8±159.6 | 84.1±157.0 | 74.8±137.7 | <0.001 |
| Postoperative creatinine, μmol/L (n=30 887)† | |||||||
| Mean±SD | 99.6±82.0 | 98.2±61.3 | 96.4±55.3 | 96.4±55.1 | 95.1±48.6 | 96.8±56.7 | 0.101 |
| Blood transfusion (red blood cells) (n=72 631)† | |||||||
| n (%) | 810 (71.1) | 8582 (54.4) | 13 095 (41.2) | 5743 (34.3) | 2360 (32.8) | 30 590 (42.1) | <0.001 |
| Blood transfusion (platelets or plasma) (n=72631)† | |||||||
| n (%) | 453 (39.8) | 5277 (33.4) | 8845 (27.8) | 4045 (24.2) | 1639 (22.8) | 20 259 (27.9) | <0.001 |
| Dialysis | |||||||
| n (%) | 28 (2.3) | 204 (1.2) | 339 (1.0) | 196 (1.1) | 105 (1.4) | 872 (1.1) | <0.001 |
| Stroke | |||||||
| n (%) | ≤5 (0.3) | 54 (0.3) | 101 (0.3) | 41 (0.2) | 18 (0.2) | 218 (0.3) | 0.486 |
| Myocardial infarction | |||||||
| n (%) | 245 (20.0) | 2944 (17.2) | 4828 (14.0) | 2234 (12.3) | 933 (12.2) | 11 184 (14.2) | <0.001 |
| Death | |||||||
| n (%) | 42 (3.4) | 256 (1.5) | 356 (1.0) | 168 (0.9) | 88 (1.2) | 910 (1.2) | <0.001 |
ANOVA indicates analysis of variance; CABG, coronary artery bypass graft, SD, standard deviation.
Overall, by ANOVA.
Where data are missing, total n is indicated in the variable cell.
Table3 shows post-discharge outcomes with an overall statistical difference between BMI groups for all events, except stroke within 1 year of discharge. The underweight group experienced the highest rates of surgery readmission, MI, and mortality.
BMI Trend by Year and Mortality
Figure1 shows a trend analysis for BMI from 1998 to 2011. The mean period of follow-up was 7.8±4 years, with 12 392 deaths. Overall, 30-day, 1- and 5-year survival rates were highest for the obese group (99.1% [95% CI, 98.9 to 99.2], 97.6% [95% CI, 97.3 to 97.8], and 90.0% [95% CI, 89.5 to 90.5]), respectively, and lowest for the underweight group (96.5% [95% CI, 95.4 to 97.7], 91.4% [95% CI, 89.6 to 93.2], and 75.9% [95% CI, 73.0 to 78.7]) (Table4 and Figure2). A reverse J-shaped relationship exists between BMI range and mortality (Figure3), with their respective hazard ratios, using normal weight as the reference: underweight (1.35 [95% CI, 1.23 to 1.49]); overweight (0.94 [95% CI, 0.91 to 0.98]); obese (1.00 [95% CI, 0.96 to 1.04]); morbidly obese (1.12 [95% CI, 1.06 to 1.19]).
Figure 1.
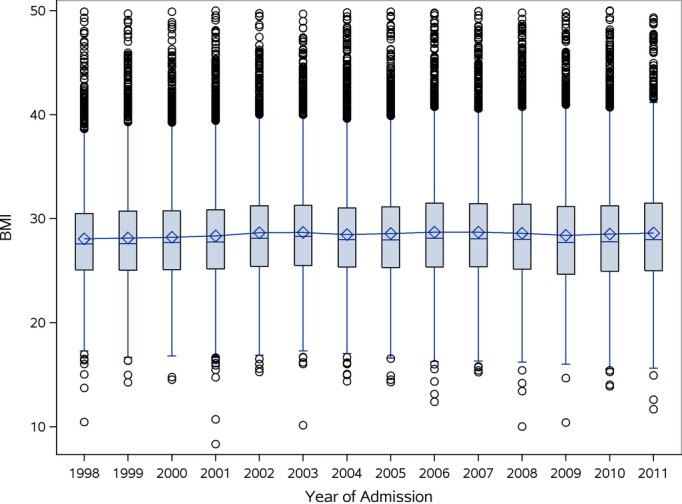
The box in the boxplot displays the median (diamonds), mean (dashes), and encompasses the 25th and the 75th percentiles; lines include ×1.5 interquartile range beyond the 25th and 75th percentiles; the outer circles represent outliers. There was no significant trend found over the years of the study (P=0.1005) using the Mann-Kendall trend test. BMI indicates body mass index.
Table 4.
Proportion of Patients Alive at 3 Time Intervals Following Date of Surgery (95% Confidence Intervals)
| BMI Category | 30 Days | 1 Year | 5 Years |
|---|---|---|---|
| Under weight (n=1228) | 0.965 (0.954, 0.977) | 0.914 (0.896, 0.932) | 0.759 (0.730, 0.787) |
| Normal weight (n=17 162) | 0.985 (0.983, 0.987) | 0.962 (0.959, 0.965) | 0.872 (0.866, 0.878) |
| Over weight (n=34 597) | 0.990 (0.988, 0.991) | 0.974 (0.972, 0.976) | 0.900 (0.896, 0.903) |
| Obese (n=18 147) | 0.991 (0.989, 0.992) | 0.976 (0.973, 0.978) | 0.900 (0.895, 0.905) |
| Morbidly obese (n=7628) | 0.988 (0.985, 0.990) | 0.970 (0.965, 0.974) | 0.883 (0.874, 0.892) |
BMI indicates body mass index.
N=78 762.
Figure 2.
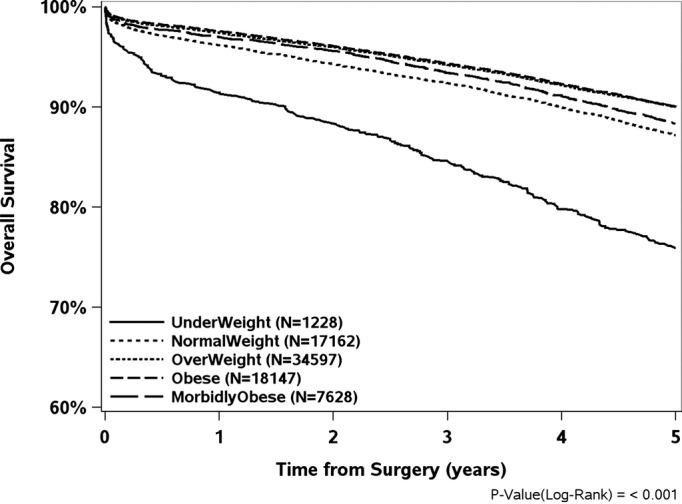
Kaplan-Meier Curves indicating overall 5-year survival from date of surgery, by body mass index category.
Figure 3.
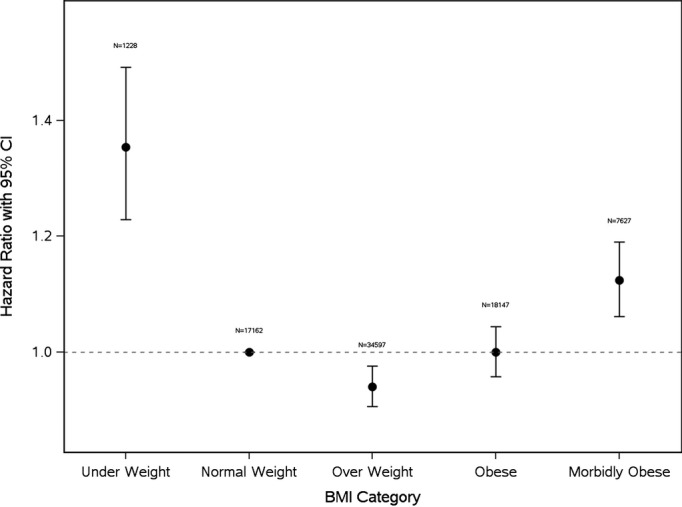
Hazard ratios for mortality with 95% confidence intervals by body mass index category, with reference to normal weight. BMI indicates body mass index.
Factors related to the risk of death using bivariate (Table5) and multivariate (Table6) analyses are presented. Clinical considerations dictated the choice between co-linear variables, which included age, sex, diabetes, smoking history, PVD, COPD, dialysis, CVD, CHF, Elixhuaser index, surgery type, LOS, reoperation, blood transfusion, stroke in hospital, MI in hospital, dialysis within 1 year, stroke within 1 year, MI within 1 year.
Table 5.
Bivariate Cox Analysis
| Variable | Value | Parameter Estimate | Hazard Ratio | 95% Lower Confidence Limit | 95% Upper Confidence Limit | P Value |
|---|---|---|---|---|---|---|
| Age at admission | 0.073 | 1.076 | 1.074 | 1.078 | <0.001 | |
| Under weight | 0.485 | 1.624 | 1.475 | 1.789 | <0.001 | |
| Over weight | −0.092 | 0.912 | 0.879 | 0.946 | <0.001 | |
| Obese | 0.054 | 1.056 | 1.011 | 1.102 | 0.013 | |
| Morbidly obese | 0.320 | 1.377 | 1.303 | 1.456 | <0.001 | |
| Sex (female) | 0.202 | 1.224 | 1.184 | 1.266 | <0.001 | |
| Under weight | 0.496 | 1.642 | 1.491 | 1.809 | <0.001 | |
| Over weight | −0.182 | 0.833 | 0.803 | 0.865 | <0.001 | |
| Obese | −0.171 | 0.843 | 0.808 | 0.879 | <0.001 | |
| Morbidly obese | −0.076 | 0.927 | 0.878 | 0.980 | 0.007 | |
| Diabetes | 0.459 | 1.582 | 1.536 | 1.629 | <0.001 | |
| Under weight | 0.533 | 1.705 | 1.548 | 1.877 | <0.001 | |
| Over weight | −0.200 | 0.819 | 0.789 | 0.849 | <0.001 | |
| Obese | −0.224 | 0.799 | 0.766 | 0.834 | <0.001 | |
| Morbidly obese | −0.161 | 0.852 | 0.806 | 0.900 | <0.001 | |
| Smoking history | 0.194 | 1.214 | 1.178 | 1.252 | <0.001 | |
| Under weight | 0.531 | 1.701 | 1.545 | 1.874 | <0.001 | |
| Over weight | −0.208 | 0.812 | 0.782 | 0.843 | <0.001 | |
| Obese | −0.197 | 0.821 | 0.787 | 0.857 | <0.001 | |
| Morbidly obese | −0.084 | 0.919 | 0.870 | 0.971 | 0.003 | |
| PVD | 0.831 | 2.296 | 2.216 | 2.380 | <0.001 | |
| Under weight | 0.500 | 1.649 | 1.497 | 1.816 | <0.001 | |
| Over weight | −0.187 | 0.829 | 0.799 | 0.860 | <0.001 | |
| Obese | −0.171 | 0.843 | 0.808 | 0.880 | <0.001 | |
| Morbidly obese | −0.043 | 0.958 | 0.907 | 1.012 | 0.124 | |
| COPD | 0.769 | 2.158 | 2.066 | 2.255 | <0.001 | |
| Under weight | 0.477 | 1.612 | 1.463 | 1.775 | <0.001 | |
| Over weight | −0.195 | 0.823 | 0.793 | 0.854 | <0.001 | |
| Obese | −0.190 | 0.827 | 0.793 | 0.863 | <0.001 | |
| Morbidly obese | −0.099 | 0.905 | 0.857 | 0.957 | <0.001 | |
| Dialysis | 1.332 | 3.789 | 3.465 | 4.145 | <0.001 | |
| Under weight | 0.506 | 1.658 | 1.506 | 1.827 | <0.001 | |
| Over weight | −0.185 | 0.831 | 0.801 | 0.863 | <0.001 | |
| Obese | −0.166 | 0.847 | 0.812 | 0.884 | <0.001 | |
| Morbidly obese | −0.051 | 0.950 | 0.899 | 1.004 | 0.069 | |
| Cerebrovascular disease | 0.725 | 2.066 | 1.985 | 2.150 | <0.001 | |
| Under weight | 0.525 | 1.691 | 1.535 | 1.862 | <0.001 | |
| Over weight | −0.186 | 0.830 | 0.800 | 0.861 | <0.001 | |
| Obese | −0.162 | 0.851 | 0.815 | 0.888 | <0.001 | |
| Morbidly obese | −0.044 | 0.957 | 0.906 | 1.011 | 0.118 | |
| CHF | 1.464 | 4.321 | 4.035 | 4.628 | <0.001 | |
| Under weight | 0.508 | 1.661 | 1.508 | 1.830 | <0.001 | |
| Over weight | −0.186 | 0.830 | 0.800 | 0.862 | <0.001 | |
| Obese | −0.165 | 0.848 | 0.813 | 0.885 | <0.001 | |
| Morbidly obese | −0.059 | 0.942 | 0.892 | 0.996 | 0.034 | |
| Elixhauser index | 0.329 | 1.389 | 1.381 | 1.398 | <0.001 | |
| Under weight | 0.329 | 1.390 | 1.262 | 1.531 | <0.001 | |
| Over weight | −0.166 | 0.847 | 0.816 | 0.879 | <0.001 | |
| Obese | −0.244 | 0.783 | 0.751 | 0.818 | <0.001 | |
| Morbidly obese | −0.333 | 0.717 | 0.678 | 0.758 | <0.001 | |
| Surgery (CABG only) | −0.948 | 0.388 | 0.372 | 0.404 | <0.001 | |
| Under weight | 0.492 | 1.636 | 1.485 | 1.802 | <0.001 | |
| Over weight | −0.191 | 0.826 | 0.796 | 0.857 | <0.001 | |
| Obese | −0.174 | 0.840 | 0.805 | 0.877 | <0.001 | |
| Morbidly obese | −0.063 | 0.939 | 0.889 | 0.992 | 0.026 | |
| Length of hospital stay, days | 0.018 | 1.018 | 1.017 | 1.019 | <0.001 | |
| Under weight | 0.517 | 1.677 | 1.522 | 1.846 | <0.001 | |
| Over weight | −0.177 | 0.838 | 0.808 | 0.870 | <0.001 | |
| Obese | −0.179 | 0.836 | 0.801 | 0.873 | <0.001 | |
| Morbidly obese | −0.077 | 0.926 | 0.877 | 0.978 | 0.006 | |
| Reoperation | 0.816 | 2.262 | 1.991 | 2.569 | <0.001 | |
| Under weight | 0.526 | 1.692 | 1.536 | 1.863 | <0.001 | |
| Over weight | −0.192 | 0.825 | 0.795 | 0.856 | <0.001 | |
| Obese | −0.172 | 0.842 | 0.807 | 0.878 | <0.001 | |
| Morbidly obese | −0.058 | 0.944 | 0.894 | 0.997 | 0.04 | |
| Blood transfusion | Red blood cell | 0.653 | 1.921 | 1.852 | 1.993 | <0.001 |
| Platelet | 0.177 | 1.193 | 1.029 | 1.383 | 0.019 | |
| Other | 0.148 | 1.159 | 1.095 | 1.228 | <0.001 | |
| Under weight | 0.443 | 1.557 | 1.414 | 1.715 | <0.001 | |
| Over weight | −0.110 | 0.897 | 0.864 | 0.931 | <0.001 | |
| Obese | −0.044 | 0.957 | 0.917 | 0.999 | 0.044 | |
| Morbidly obese | 0.085 | 1.088 | 1.030 | 1.150 | 0.003 | |
| Stroke in hospital | 1.001 | 2.722 | 2.255 | 3.286 | <0.001 | |
| Under weight | 0.533 | 1.704 | 1.547 | 1.877 | <0.001 | |
| Over weight | −0.194 | 0.823 | 0.794 | 0.854 | <0.001 | |
| Obese | −0.174 | 0.840 | 0.805 | 0.877 | <0.001 | |
| Morbidly obese | −0.061 | 0.941 | 0.891 | 0.994 | 0.03 | |
| MI in hospital | 0.170 | 1.186 | 1.141 | 1.233 | <0.001 | |
| Under weight | 0.525 | 1.690 | 1.534 | 1.861 | <0.001 | |
| Over weight | −0.190 | 0.827 | 0.797 | 0.858 | <0.001 | |
| Obese | −0.168 | 0.845 | 0.810 | 0.882 | <0.001 | |
| Morbidly obese | −0.053 | 0.948 | 0.898 | 1.002 | 0.059 | |
| Dialysis within 1 year of discharge | 1.717 | 5.565 | 5.045 | 6.139 | <0.001 | |
| Under weight | 0.502 | 1.652 | 1.500 | 1.819 | <0.001 | |
| Over weight | −0.188 | 0.829 | 0.799 | 0.860 | <0.001 | |
| Obese | −0.169 | 0.845 | 0.810 | 0.882 | <0.001 | |
| Morbidly obese | −0.061 | 0.941 | 0.890 | 0.994 | 0.029 | |
| Stroke within 1 year of discharge | 1.255 | 3.507 | 3.052 | 4.031 | <0.001 | |
| Under weight | 0.529 | 1.696 | 1.540 | 1.868 | <0.001 | |
| Over weight | −0.196 | 0.822 | 0.792 | 0.853 | <0.001 | |
| Obese | −0.175 | 0.839 | 0.804 | 0.876 | <0.001 | |
| Morbidly obese | −0.063 | 0.939 | 0.889 | 0.992 | 0.025 | |
| MI within 1 year of discharge | 0.889 | 2.433 | 2.258 | 2.621 | <0.001 | |
| Under weight | 0.535 | 1.707 | 1.550 | 1.880 | <0.001 | |
| Over weight | −0.192 | 0.825 | 0.796 | 0.857 | <0.001 | |
| Obese | −0.171 | 0.843 | 0.807 | 0.879 | <0.001 | |
| Morbidly obese | −0.058 | 0.944 | 0.894 | 0.997 | 0.04 |
Hazard ratios for mortality for each BMI category with respect to the Normal Weight group. For each comorbidity factor, overall hazard ratios are shown, followed by effect of BMI category adjusted for that factor. CABG indicates coronary artery bypass graft; CHF, congestive heart failure; COPD, chronic obstructive pulmonary disease; MI, myocardial infarction; PVD, peripheral vascular disease.
Table 6.
Multivariate Cox Analysis
| Variable | Parameter Estimate | Hazard Ratio | 95% Lower Confidence Limit | 95% Upper Confidence Limit | P Value |
|---|---|---|---|---|---|
| Under weight BMI | 0.303 | 1.354 | 1.229 | 1.493 | <0.001 |
| Over weight BMI | −0.062 | 0.940 | 0.906 | 0.976 | 0.001 |
| Obese BMI | −0.001 | 0.999 | 0.957 | 1.044 | 0.981 |
| Morbidly obese BMI | 0.117 | 1.124 | 1.061 | 1.190 | <0.001 |
| Age at admission | 0.060 | 1.062 | 1.060 | 1.064 | <0.001 |
| Sex (female) | −0.100 | 0.905 | 0.873 | 0.937 | <0.001 |
| Diabetes | 0.100 | 1.106 | 1.071 | 1.142 | <0.001 |
| Smoking history | 0.251 | 1.286 | 1.245 | 1.328 | <0.001 |
| Peripheral vascular disease | 0.307 | 1.360 | 1.309 | 1.412 | <0.001 |
| Chronic obstructive pulmonary disease | 0.304 | 1.355 | 1.295 | 1.417 | <0.001 |
| Dialysis | 0.656 | 1.926 | 1.745 | 2.126 | <0.001 |
| Cerebrovascular disease | 0.178 | 1.195 | 1.146 | 1.246 | <0.001 |
| Congestive heart failure | 0.409 | 1.506 | 1.402 | 1.618 | <0.001 |
| Elixhauser index | 0.195 | 1.216 | 1.205 | 1.226 | <0.001 |
| Surgery type: CABG only | −0.186 | 0.830 | 0.794 | 0.868 | <0.001 |
| Length of hospital stay, days | 0.009 | 1.009 | 1.008 | 1.010 | <0.001 |
| Red blood cell transfusion | 0.183 | 1.201 | 1.156 | 1.248 | <0.001 |
| Platelet transfusion | 0.045 | 1.046 | 0.902 | 1.212 | 0.555 |
| Other transfusion | 0.106 | 1.112 | 1.049 | 1.177 | <0.001 |
| Stroke in hospital | 0.358 | 1.430 | 1.183 | 1.729 | <0.001 |
| Myocardial infarction in hospital | 0.087 | 1.091 | 1.049 | 1.135 | <0.001 |
| Dialysis within 1 year of discharge | 0.379 | 1.461 | 1.310 | 1.629 | <0.001 |
| Stroke within 1 year of discharge | 0.566 | 1.761 | 1.531 | 2.026 | <0.001 |
| Myocardial infarction within 1 year of discharge | 0.501 | 1.651 | 1.530 | 1.781 | <0.001 |
Hazard ratios for factors with significant effect on mortality. Each line represents the effect of that factor on mortality, adjusting for all other factors in this model. BMI indicates body mass index; CABG, coronary artery bypass graft.
In the bivariate analysis, BMI significantly influenced survival when each of the above variables were factored into the model, with reference to the normal weight group for all variables, except PVD, CVD, MI in hospital for morbidly obese group. For example, adjusting for age (eg, underweight comprised the oldest BMI group), BMI independently influenced mortality (hazard ratio for underweight group 1.62, CI 1.48 to 1.79). Even when adjusting for co-morbidities (Elixhauser index), BMI still affected mortality (hazard ratio for underweight group 1.39, CI 1.26 to 1.53). Similarly, considering the morbidly obese group was youngest, BMI still independently affected mortality.
Using multivariate analysis, the reverse J-curve relationship between BMI and mortality was confirmed (Figure3). Underweight patients had a significantly higher risk of death (hazard ratio, 1.35, 95% CI, 1.23 to 1.49) compared with patients with normal weight, as did morbidly obese patients (hazard ratio, 1.12, 95% CI, 1.06 to 1.19). There was a survival advantage in the overweight group, and no difference in the obese group, compared with normal weight. The Elixhauser index was highly predictive of mortality, such that for each 1 point increase, there was a 22% increase in mortality rate. Age also impacted mortality, such that for every year of increase in age, the chance of death increased by 6%, taking BMI and all other factors relating to survival into account. However, BMI had an independent influence on mortality when adjusting for both age and risk score.
Discussion
Obesity is a well-recognized risk factor for the development of cardiovascular disease, and patients with high BMI are highly represented among the population presenting for cardiac surgery (77% of the total in the current study). However, we have confirmed, using a cohort study with large administrative datasets and 5-year follow-up for survival analysis and mean follow-up of 7.8 years (±4 years) that overweight and obese patients who undergo cardiac surgery have a survival advantage over underweight, normal weight, and morbidly obese patients. A reverse J-shaped relationship was found relating BMI with mortality, such that BMI independently predicted survival when multiple confounders were considered.
At times of illness and stress, excess adiposity may confer an advantage.17 Low BMI individuals may not have the reserve to tolerate the effects of weight loss as readily as obese individuals, potentially contributing towards high mortality.18,19 The improved survival of obese patients could be attributed to high metabolic reserves and body fat.20,21 This may be due to an increase in secretion of amino acids and dipokines, a decrease in the levels of B-type natriuretic peptide and in oxidative stress and inflammation.22 Potential moderators of the relationship between obesity and mortality may include hormones and cytokines.20,21,23,24 It can be argued that the observed reverse J-shaped relationship in our study can be due to reverse causation, since the underweight group could have been malnourished or cachectic and were older, with a high prevalence of comorbidities.25–27 In order to adjust for important confounders, obesity could be considered as a time-varying exposure to account for changes in weight status over the lifespan.28,29 However, no substantial change in mortality risk has been shown when excluding patients who had a history of cancer, or who died within the first 4 years of follow-up.30–32 In the current study, bivariate and multivariate analyses demonstrated that effect modification due to age had an impact on results; however, when adjusting for age, there was still a significant relationship between BMI and mortality. Our findings may also be due to lead-time bias, since patients with high BMI tend to be treated sooner.23,33
This study demonstrated the lowest survival following cardiac surgery in the underweight group. As low BMI could represent a surrogate for serious underlying illness, we attributed a well-validated co-morbidity index to all patients. The Elixhauser index was developed on administrative data from California, and is designed to be used with large data sets.15,16,34 The index includes 30 co-existing conditions using International Statistical Classification of Disease codes ICD-9 and ICD-10. Its performance has been shown in a recent systematic review to provide the best fit among various co-morbidity indices, especially when estimating mortality beyond 30 days.35 Unsurprisingly, the Elixhauser index was highest in the underweight and morbidly obese groups. When including the Elixhauser index in our bivariate and multivariate models, low BMI remained the most significant independent predictor of mortality.
Our results correspond with findings that have examined BMI and mortality, in that moderate obesity provides a protective effect in patients who undergo cardiac surgery20,21,23,36–38 and the general population.1,39 However, limitations in past studies include a short follow-up of 3 years or less,33,36,38,40 a small sample, and limited numbers of deaths,23,41–46 as well as not accounting for possible confounders, such as chronic illness and smoking.21,47 Certain studies with relatively small sample sizes and short follow-up45,46 found no significant association between non-morbid obesity and mortality for CABG patients. Benedetto et al retrospectively studied 13 963 patients over 5 years and found that, using propensity score matching, obesity did not contribute towards operative mortality, but was related to a decrease in late survival in patients undergoing CABG.41 However, their analysis was not statistically significant because of the small number of morbidly obese patients (N=211).
Other studies with follow-up longer than 3 years12,47 found similar patterns, with a reverse J- or U-shaped relationship between BMI and mortality. Gurm et al found a curvilinear relationship between BMI and 5-year mortality, with higher risk of death associated with BMI extremes in patients who had undergone CABG (N=1526).12 Sarno et al investigated the impact of BMI on 7427 patients who had been treated by percutaneous coronary intervention (PCI), assessing 5-year mortality.37 They found that the “obesity paradox” observed could have been due to a large proportion of elderly patients in the normal BMI group. However, as in our study, obese patients had a higher rate of risk factors compared with the normal BMI group. In contrast, morbidly obese patients were the youngest, constituted the largest group of smokers, and had the highest rates of diabetes. Also congruent with our findings, Hastie et al examined 4880 patients who had undergone PCI for CAD over 5 years, and observed a U-shaped relationship between BMI and mortality, with the highest mortality risk for the underweight group.23 Similarly, Birkmeyer et al found that obesity was not associated with increased mortality (N=11 101 CABG patients) over 4 years.48
The main strengths of our study are the large sample, allowing for robust analyses among BMI categories (particularly underweight and morbidly obese patients), and the long follow-up (5 years). In addition, numerous potential confounding variables were adjusted for, revealing results that were attributable to BMI alone. In particular, although the baseline risk index differed between BMI groups, when this was factored into multivariate analysis, the difference in mortality attributed to BMI was independent of baseline risk index. Limitations include using retrospective data, determination of all-cause mortality only, lack of inclusion of ethnicity, and lack of data related to fitness or weight change before surgery. Additionally, a possible confounding relationship of socioeconomic status with BMI has yet to be studied in this population.
The importance of our findings lies in risk assessment of patients presenting for cardiac surgery and the allocation of resources. Moderate obesity cannot be presumed to predict complications after surgery, whereas underweight and normal weight patients (aggregate BMI <25) may consume additional health care resources. The economic effect of these findings remains to be studied. The validity of BMI as an accurate adiposity measure has been questioned, given muscle mass decline with age,49,50 as it does not account for body composition or the location of adipose tissue.51–53 Nevertheless, several studies have shown that the obesity paradox exists with any measure of adiposity.24,51,54–56 The definition of the BMI categories in the current study are closely based on WHO and Health Canada guidelines (with the exception of “underweight” being considered as BMI <18.5 in these guidelines).13,14 These definitions reflect relative levels of risk to health.14 Following the results of this and other studies confirming an obesity paradox in various clinical situations, we suggest that traditional BMI categorization may need to be revisited.
In summary, although obesity is a well-recognized risk factor for cardiovascular disease, overweight and moderately obese patients showed improved outcomes following CABG and CABG/AVR with respect to patients with “normal” BMI. As outcomes were significantly worse for morbidly obese and underweight patients, focus should be placed on these populations in risk assessment, preparation, and resource allocation prior to cardiac surgery.
Acknowledgments
The authors would like to thank Joelle B. Thorpe, PhD for her insightful comments and assistance with preparing this manuscript for publication.
Disclosures
None.
References
- Adams KF, Schatzkin A, Harris TB, Kipnis V, Mouw T, Ballard-Barbash MD, Hollenbeck A, Leitzmann MF. Overweight, obesity, and mortality in a large prospective cohort of persons 50 to 71 years old. N Engl J Med. 2006;355:763–778. doi: 10.1056/NEJMoa055643. [DOI] [PubMed] [Google Scholar]
- Chen Z, Yang G, Offer A, Zhou M, Smith M, Peto R, Ge H, Yang L, Whitlock G. Body mass index and mortality in china: a 15-year prospective study of 220000 men. Int J Epidemiol. 2012;41:472–481. doi: 10.1093/ije/dyr208. [DOI] [PubMed] [Google Scholar]
- Berrington de Gonzalez A, Hartge P, Cerhan JR, Flint AJ, Hannan L, MacInnis RJ, Moore SC, Tobias GS, Anton-Culver H, Freeman LB, Beeson WL, Clipp SL, English DR, Folsom AR, Freedman M, Giles G, Hakansson N, Henderson KD, Hoffman-Bolton J, Hoppin JA, Koenig KL, Lee I-M, Linet MS, Park Y, Pocobelli G, Schatzkin A, Sesso HD, Weiderpass E, Willcox BJ, Wolk A, Zeleniuch-Jacquotte A, Willett WC, Thun MJ. Body-mass index and mortality among 1.46 million white adults. N Engl J Med. 2010;363:2211–2219. doi: 10.1056/NEJMoa1000367. . [DOI] [PMC free article] [PubMed] [Google Scholar]
- Zheng W, McLerran DF, Rolland B, Zhang X, Inoue M, Matsuo K, He J, Gupta PC, Ramadas K, Tsugane S, Irie F, Tamakoshi A, Gao Y-T, Wang R, Shu X-O, Tsuji I, Kuriyama S, Tanaka H, Satoh H, Chen C-J, Yuan J-M, Yoo K-Y, Ahsan H, Pan W-H, Gu D, Pednekar MS, Sauvaget C, Sasazuki S, Sairenchi T, Yang G, Xiang Y-B, Nagai M, Suzuki T, Nishino Y, You S-L, Koh W-P, Park SK, Chen Y, Shen C-Y, Thornquist M, Feng Z, Kang D, Boffetta P, Potter JD. Association between body-mass index and risk of death in more than 1 million asians. N Engl J Med. 2011;364:719–729. doi: 10.1056/NEJMoa1010679. [DOI] [PMC free article] [PubMed] [Google Scholar]
- McAuley PA, Blair SN. Obesity paradoxes. J Sports Sci. 2011;29:773–782. doi: 10.1080/02640414.2011.553965. [DOI] [PubMed] [Google Scholar]
- Amundson DE, Djurkovic S, Matwiyoff GN. The obesity paradox. Crit Care Clin. 2010;26:583–596. doi: 10.1016/j.ccc.2010.06.004. [DOI] [PubMed] [Google Scholar]
- Stamou SC, Nussbaum M, Stiegel RM, Reames MK, Skipper ER, Robicsek F, Lobdell KW. Effect of body mass index on outcomes after cardiac surgery: is there an obesity paradox? Ann Thorac Surg. 2011;91:42–47. doi: 10.1016/j.athoracsur.2010.08.047. [DOI] [PubMed] [Google Scholar]
- Parlow JL, Ahn R, Milne B. Obesity is a risk factor for failure of “fast track” extubation following coronary artery bypass surgery. Can J Anesth. 2006;53:288–294. doi: 10.1007/BF03022217. [DOI] [PubMed] [Google Scholar]
- Engel AM, McDonough S, Smith JM. Does an obese body mass index affect hospital outcomes after coronary artery bypass graft surgery? Ann Thorac Surg. 2009;88:1793–1800. doi: 10.1016/j.athoracsur.2009.07.077. [DOI] [PubMed] [Google Scholar]
- Tyson GH, Rodriguez E, Elci OC, Koutlas TC, Chitwood WR, Ferguson TB, Kypson AP. Cardiac procedures in patients with a body mass index exceeding 45: outcomes and long-term results. Ann Thorac Surg. 2007;84:3–9. doi: 10.1016/j.athoracsur.2007.03.024. [DOI] [PubMed] [Google Scholar]
- Mullen JT, Moorman DW, Davenport DL. The obesity paradox: body mass index and outcomes in patients undergoing nonbariatric general surgery. Ann Surg. 2009;250:166–172. doi: 10.1097/SLA.0b013e3181ad8935. [DOI] [PubMed] [Google Scholar]
- Gurm HS, Whitlow PL, Kip KE BARI Investigators. The impact of body mass index on short- and long-term outcomes in patients undergoing coronary revascularization: Insights from the bypass angioplasty revascularization investigation (BARI) J Am Coll Cardiol. 2002;39:834–840. doi: 10.1016/s0735-1097(02)01687-x. [DOI] [PubMed] [Google Scholar]
- World Health Organization. 2006. WHO global database on body mass index (BMI). An interactive surveillance tool for monitoring nutrition transition. Available at: http://apps.who.int/bmi/index.jsp?introPage=intro_3.html. Accessed November 10, 2014.
- Health Canada. 2003. Canadian guidelines for body weight classification in adults. Quick reference tool for professionals. Available at: http://www.hc-sc.gc.ca/fn-an/alt_formats/hpfb-dgpsa/pdf/nutrition/cg_quick_ref-ldc_rapide_ref-eng.pdf. Accessed November 10, 2014.
- Elixhauser A, Steiner C, Harris DR, Coffey RM. Comorbidity measures for use with administrative data. Med Care. 1998;36:8–27. doi: 10.1097/00005650-199801000-00004. [DOI] [PubMed] [Google Scholar]
- Quan H, Sundararajan V, Halfon P, Fong A, Burnand B, Luthi J-C, Saunders LD, Beck CA, Feasby TE, Ghali WA. Coding algorithms for defining comorbidities in ICD-9-CM and ICD-10 administrative data. Med Care. 2005;43:1130–1139. doi: 10.1097/01.mlr.0000182534.19832.83. [DOI] [PubMed] [Google Scholar]
- Banack HR, Kaufman JS. The obesity paradox: understanding the effect of obesity on mortality among individuals with cardiovascular disease. Prev Med. 2014;62:96–102. doi: 10.1016/j.ypmed.2014.02.003. [DOI] [PubMed] [Google Scholar]
- Fried LP, Tangen CM, Walson J, Newman AB, Hirsch C, Gottdiener J, Seeman T, Tracy R, Kop WJ, Burke G, McBurnie MA Cardiovascular Health Study Collaborative Research Group. Frailty in older adults: Evidence for a phenotype. J Gerontol A Biol Med Sci. 2001;56:M146–M157. doi: 10.1093/gerona/56.3.m146. [DOI] [PubMed] [Google Scholar]
- Strandberg TE, Strandberg AY, Salomaa VV, Pitkälä KH, Tilvis RS, Sirola J, Miettinen TA. Explaining the obesity paradox: cardiovascular risk, weight change, and mortality during long-term follow-up in men. Eur Heart J. 2009;30:1720–1727. doi: 10.1093/eurheartj/ehp162. [DOI] [PubMed] [Google Scholar]
- Oreopoulos A, Padwal R, Kalantar-Zadeh K, Fonarow GC, Norris CM, McAlister FA. Body mass index and mortality in heart failure: a meta-analysis. Am Heart J. 2008;156:13–22. doi: 10.1016/j.ahj.2008.02.014. [DOI] [PubMed] [Google Scholar]
- Oreopoulos A, Padwal R, Norris CM, Mullen JC, Pretorius V, Kalantar-Zadeh K. Effect of obesity on short- and long-term mortaliy postcoronary revascularization: a meta-analysis. Obesity. 2008;16:442–450. doi: 10.1038/oby.2007.36. [DOI] [PubMed] [Google Scholar]
- Dixon JB, Lambert GW. The obesity paradox-a reality that requires explanation and clinical interpretation. Atherosclerosis. 2013;226:47–48. doi: 10.1016/j.atherosclerosis.2012.11.005. [DOI] [PubMed] [Google Scholar]
- Hastie CE, Padmananbhan S, Slack R, Pell AC, Oldroyd KG, Flapan AD, Jennings KP, Irving J, Eteiba H, Dominiczak AF, Pell JP. Obesity paradox in a cohort of 4880 consecutive patients undergoing percutaneous coronary intervention. Eur Heart J. 2010;31:222–226. doi: 10.1093/eurheartj/ehp317. [DOI] [PubMed] [Google Scholar]
- Lavie CJ, Milani RV, Ventura HO. Obesity and cardiovascular disease: risk factor, paradox and impact of weight loss. J Am Coll Cardiol. 2009;53:1925–1932. doi: 10.1016/j.jacc.2008.12.068. [DOI] [PubMed] [Google Scholar]
- Janssen I. Heart disease risk among metabolically healthy obese men and metabolically unhealthy lean men. Can Med Assoc. 2005;172:1315–1316. doi: 10.1503/cmaj.050121. [DOI] [PMC free article] [PubMed] [Google Scholar]
- Kramer CK, Zinman B, Retnakaran R. Are metabolically healthy overweight and obesity benign conditions? A systematic review and meta-analysis. Ann Intern Med. 2013;159:758–769. doi: 10.7326/0003-4819-159-11-201312030-00008. [DOI] [PubMed] [Google Scholar]
- Ortega FB, Lee D, Katzmarzyk PT, Ruiz JR, Sui X, Church TS, Blair SN. The intriguing metabolically healthy but obese phenotype: cardiovascular prognosis and role of fitness. Eur Heart J. 2013;34:389–397. doi: 10.1093/eurheartj/ehs174. [DOI] [PMC free article] [PubMed] [Google Scholar]
- Ferreira I, Stehouwer CDA. Obesity paradox or inappropriate study designs? Time for life-course epidemiology. J Hypertens. 2012;30:2271–2275. doi: 10.1097/HJH.0b013e32835b4fe0. [DOI] [PubMed] [Google Scholar]
- Strandberg TE, Strandberg AY, Salomaa VV, Pitkälä KH, Tilvis RS. The “obesity paradox”, frailty, disability, and mortality in older men: a prospective, longitudinal cohort study. Am J Epidemiol. 2013;178:1452–1460. doi: 10.1093/aje/kwt157. [DOI] [PubMed] [Google Scholar]
- Allison DB, Faith MS, Heo M, Townsend-Butterworth D, Williamson DF. Meta-analysis of the effect of excluding early deaths on the estimated relationship between body mass index and mortality. Obes Res. 1999;7:342–354. doi: 10.1002/j.1550-8528.1999.tb00417.x. [DOI] [PubMed] [Google Scholar]
- Flegal KM, Graubard BI, Williamson DF, Gail MH. Impact of smoking and preexisting illness on estimates of the fractions of deaths associated with underweight, overweight, and obesity in the US population. Am J Epidemiol. 2007;166:975–982. doi: 10.1093/aje/kwm152. [DOI] [PubMed] [Google Scholar]
- Orpana HM, Berthelot JM, Kaplan MS, Feeny DH, McFarland B, Ross NA. BMI and mortality: results from a national longitudinal study of Canadian adults. Obesity. 2010;18:214–218. doi: 10.1038/oby.2009.191. [DOI] [PubMed] [Google Scholar]
- Diercks DB, Roe MT, Mulgund J, Pollack CV, Jr, Kirk JD, Gibler WB, Ohman EM, Smith SC, Jr, Boden WE, Peterson ED. The obesity paradox in non-ST-segment elevation acute coronary syndromes: results from the can rapid risk stratification of unstable angina patients suppress adverse outcomes with early implementation of the American College of Cardiology/American Heart Association guidelines quality improvement initiative. Am Heart J. 2006;152:140–148. doi: 10.1016/j.ahj.2005.09.024. [DOI] [PubMed] [Google Scholar]
- Stukenborg GJ, Wagner DP, Connors AF. Comparison of the performance of two comorbidity measures, with and without information from prior hospitalizations. Med Care. 2001;39:727–739. doi: 10.1097/00005650-200107000-00009. [DOI] [PubMed] [Google Scholar]
- Sharabiani MTA, Aylin P, Bottle A. Systematic review of comorbidity indices for administrative data. Med Care. 2012;12:1109–1118. doi: 10.1097/MLR.0b013e31825f64d0. [DOI] [PubMed] [Google Scholar]
- Angeras O, Albertsson P, Karason K, Ramunddal T, Matejka G, James S, Lagerqvist B, Rosengren A, Omerovic E. Evidence for obesity paradox in patients with acute coronary syndromes: a report from the Swedish coronary angiography and angioplasty registry. Eur Heart J. 2013;34:345–353. doi: 10.1093/eurheartj/ehs217. [DOI] [PubMed] [Google Scholar]
- Sarno G, Raber L, Onuma Y, Garg S, Brugaletta S, van Domburg RT, Pilgrim T, Pfaffli T, Wenaweser P, Windecker S, Serruys P. Impact of body mass index on the five-year outcome of patients having percutaneous coronary interventions with drug-eluting stents. Am J Cardiol. 2011;108:195–201. doi: 10.1016/j.amjcard.2011.03.023. [DOI] [PubMed] [Google Scholar]
- Van der Boon RMA, Chieffo A, Dumonteil N, Tchetche D, Van Mieghem NM, Buchanan GL, Vahdat O, Marcheix B, Serruys PW, Fajadet J, Colombo A, Carrie D, van Domburg RT, de Jaegere PP PRAGMATIC-Plus Researchers. Effect of body mass index on short- and long-term outcomes after transcatheter aortic valve implementation. Am J Cardiol. 2013;111:231–236. doi: 10.1016/j.amjcard.2012.09.022. [DOI] [PubMed] [Google Scholar]
- Calle EE, Thun MJ, Petrelli JM, Rodriguez C, Heath CW., Jr Body-mass index and mortality in a prospective cohort of US adults. N Engl J Med. 1999;341:1097–1105. doi: 10.1056/NEJM199910073411501. [DOI] [PubMed] [Google Scholar]
- Potapov EV, Loebe M, Anker S, Stein J, Bondy S, Nasseri BA, Sodian R, Hausmann H, Hetzer R. Impact of body mass index on outcome in patients after coronary artery bypass grafting with and without valve surgery. Eur Heart J. 2003;24:1933–1941. doi: 10.1016/j.ehj.2003.09.005. [DOI] [PubMed] [Google Scholar]
- Benedetto U, Danese C, Codispoti M. Obesity paradox in coronary artery bypass grafting: myth or reality? J Thorac Cardiovasc Surg. 2014;147:1517–1523. doi: 10.1016/j.jtcvs.2013.05.028. [DOI] [PubMed] [Google Scholar]
- Sung SH, Wu TC, Huang CH, Lin SJ, Chen JW. Prognostic impact of body mass index in patients undergoing coronary artery bypass surgery. Heart. 2011;97:648–654. doi: 10.1136/hrt.2010.211110. [DOI] [PubMed] [Google Scholar]
- Ardeshiri M, Faritous Z, Haghighi ZO, Hosseini S, Baghaei R. Effect of obesity on mortality and morbidity after coronary artery bypass grafting surgery in Iranian patients. Anesth Pain Med. 2014;4:1–7. doi: 10.5812/aapm.18884. [DOI] [PMC free article] [PubMed] [Google Scholar]
- Ranucci M, Cazzaniga A, Soro G, Morricone L, Enrini R, Caviezel F. Obesity and coronary artery surgery. J Cardiothorac Vasc Anesth. 1999;13:280–284. doi: 10.1016/s1053-0770(99)90264-1. [DOI] [PubMed] [Google Scholar]
- Kim J, Hammar N, Jakobsson K, Luepker RV, McGovern PF, Ivert T. Obesity and the risk of early and late mortality after coronary artery bypass graft surgery. Am Heart J. 2003;146:555–560. doi: 10.1016/S0002-8703(03)00185-6. [DOI] [PubMed] [Google Scholar]
- Syrakas CA, Neumaier-Prauser P, Angelis I, Kiask T, Kemkes BM, Gansera B. Is extreme obesity a risk factor for increased in-hospital mortality and postoperative morbidity after cardiac surgery? Results of 2251 obese patients with BMI of 30 to 50. Thorac Cardiovasc Surg. 2007;55:491–493. doi: 10.1055/s-2007-965599. [DOI] [PubMed] [Google Scholar]
- van Straten AHM, Bramer S, Soliman Hamad MA, van Zundert AA, Martens EJ, Schonberger JP, de Wolf AM. Effect of body mass index on early and late mortality after coronary artery bypass grafting. Ann Thorac Surg. 2010;89:30–37. doi: 10.1016/j.athoracsur.2009.09.050. [DOI] [PubMed] [Google Scholar]
- Birkmeyer NJ, Charlesworth DC, Hernandez F, Leavitt BJ, Marrin CA, Morton JR, Olmstead EM, O’Connor GT. Obesity and risk of adverse outcomes associated with coronary artery bypass surgery. Circulation. 1998;97:1689–1694. doi: 10.1161/01.cir.97.17.1689. [DOI] [PubMed] [Google Scholar]
- Manson JE, Bassuk SS, Hu FB, Stampfer MJ, Colditz GA, Willett WC. Estimating the number of deaths due to obesity: can the divergent findings be reconciled? J Womens Health (Larchmt) 2007;16:168–176. doi: 10.1089/jwh.2006.0080. [DOI] [PubMed] [Google Scholar]
- Robinson S, Cooper C, Sayer AA. Nutrition and sarcopenia: a review of the evidence and implications for preventive strategies. J Aging Res. 2012;2012:1–6. doi: 10.1155/2012/510801. [DOI] [PMC free article] [PubMed] [Google Scholar]
- Lavie CJ, De Schutter A, Patel DA, Milani RV. Body composition and fitness in the obesity paradox—body mass index alone does not tell the whole story. Prev Med. 2013;57:1–2. doi: 10.1016/j.ypmed.2013.03.010. [DOI] [PubMed] [Google Scholar]
- Rothman KJ. BMI-related errors in the measurement of obesity. Int J Obes. 2008;3:S56–S59. doi: 10.1038/ijo.2008.87. [DOI] [PubMed] [Google Scholar]
- Vina J, Borras C, Gomez-Cabrera MC. Overweight, obesity, and all-cause mortality. JAMA. 2013;309:1679. doi: 10.1001/jama.2013.3080. [DOI] [PubMed] [Google Scholar]
- Lavie CJ, De Schutter A, Patel D, Artham SM, Milani RV. Body composition and coronary heart disease mortality—an obesity or a lean paradox? Mayo Clin Proc. 2011;86:857–864. doi: 10.4065/mcp.2011.0092. [DOI] [PMC free article] [PubMed] [Google Scholar]
- Lavie CJ, De Schutter A, Patel DA, Romero-Corral A, Artham SM, Milani RV. Body composition and survival in stable coronary heart disease: Impact of lean mass index and body fat in the “obesity paradox”. J Am Coll Cardiol. 2012;60:1374–1380. doi: 10.1016/j.jacc.2012.05.037. [DOI] [PubMed] [Google Scholar]
- Cole SR, Platt RW, Schisterman EF, Chu H, Westreich D, Richardson D, Poole C. Illustrating bias due to conditioning on a collider. Int J Epidemiol. 2010;39:417–420. doi: 10.1093/ije/dyp334. [DOI] [PMC free article] [PubMed] [Google Scholar]