

Abstract
We have previously developed a line-scanned dual-axis confocal (LS-DAC) microscope with subcellular resolution suitable for high-frame-rate diagnostic imaging at shallow depths. Due to the loss of confocality along one dimension, the contrast (signal-to-background ratio) of a LS-DAC microscope is deteriorated compared to a point-scanned DAC microscope. However, by using a sCMOS camera for detection, a short oblique light-sheet is imaged at each scanned position. Therefore, by scanning the light sheet in only one dimension, a thin 3D volume is imaged. Both sequential two-dimensional deconvolution and three-dimensional deconvolution are performed on the thin image volume to improve the resolution and contrast of one en face confocal image section at the center of the volume, a technique we call sheet-scanned dual-axis confocal (SS-DAC) microscopy.
Confocal microscopy is one of the most important advances in optical imaging and has become an essential tool in the biological sciences as well as for medical diagnostics in recent decades. Using point illumination and pinhole detection, confocal microscopes provide a means of non-destructively imaging intact biological samples in three dimensions (i.e., optical sectioning) with subcellular resolution. Due to the high cost and time demands of the current diagnostic gold standard of histopathology, the ability to rapidly obtain diagnostic images with minimal tissue processing at a low cost is highly desirable. Therefore, by using miniaturized optics and mechanics, along with low-power fiber-coupled laser sources, portable confocal microscopes have been developed for use in clinics and surgical suites [1-10].
Previously, our group developed and miniaturized a dual-axis confocal (DAC) microscope for clinical applications [11, 12]. The DAC architecture differs from a conventional confocal microscope (referred to as a single-axis confocal, or SAC, microscope) in that the illumination and collection paths do not overlap except at the focus. Using diffraction theory and Monte-Carlo simulations, it has been shown that the DAC microscope exhibits superior optical-sectioning capabilities compared with its SAC counterpart [11, 13, 14]. In addition, the use of low-NA optics with a long working distance in the DAC design facilitates the process of miniaturization [12].
In a typical point-scanned DAC microscope, the focal point is raster scanned in the specimen and an image is constructed in a point-by-point fashion. Since imaging speed is often limited by the speed of the laser-scanning mechanism, a point-by-point approach is suboptimal for fast imaging. At frame rates of less than 5 to 10 frames per second, images acquired by portable laser-scanned microscopes are often susceptible to motion artifacts, making them less than ideal for handheld or endoscopic use in clinical settings. To address this concern, we modified the DAC microscope so that instead of mechanically scanning a focal point in two dimensions within the specimen, a long focal line is scanned in one dimension to generate an image in a line-by-line fashion. This was done by adding a cylindrical lens into the illumination optical path of the DAC system (Fig. 1a), thereby creating a line at the focus. The line-scan modification significantly improves the imaging speed of DAC microscopy, simplifies the scanning mechanism, and can potentially increase the signal-to-noise ratio (SNR) of the acquired image compared with a PS-DAC microscope with a similar frame rate and field of view [15].
Figure 1.
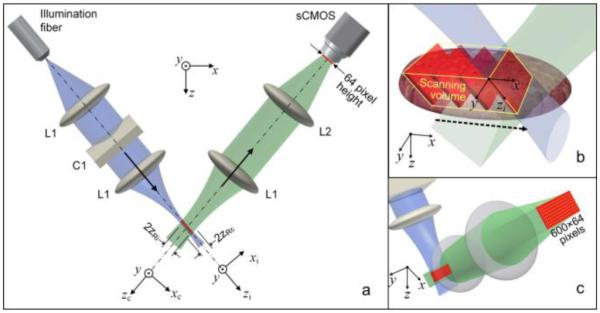
(a) Schematic of the tabletop SS-DAC microscope system. The confocal parameter, 2zR, of the low-NA intersecting beams (illumination and collection beams) is indicated. (b) Zoomed-in view of the 3D volume imaged within the sample. (c) Zoomed-in view of the short (64-pixel tall) oblique light sheet collected by a sCMOS camera.
One of the drawbacks of a LS-DAC microscope is the deterioration in image contrast due to the loss of confocality along the focal line. The resultant higher background for the LS-DAC in turn diminishes its optical-sectioning capability and limits the imaging depth of the system. To address this limitation, we have explored image-processing strategies that take advantage of the out-of-focus information provided by a sCMOS detector array. By utilizing a detector array, scanning the LS-DAC focal line in one dimension allows for the rapid acquisition of a thin image volume consisting of a series of short oblique light-sheets (Fig 1b).
Previously, when using a sCMOS detector for LS-DAC microscopy, we applied a digital confocal slit and discarded the information from the pixels outside of this slit. However, we recognize that there is still relevant information in the pixels that were previously discarded. Therefore, in this study, we analyzed the entire image volume visualized by the sCMOS during sheet-scanned acquisition (Fig. 1c) in order to improve a single en face confocal image at the center of the volume.
Our technique differs from traditional deconvolution methods that are used as an alternative to confocal microscopy to improve resolution and image contrast. Here, we seek to improve a confocal image by leveraging information outside of a confocal slit (through deconvolution) prior to applying a digital slit. This is somewhat analogous to recent efforts, such as pixel-reassignment, which utilize detector arrays and image processing for rapid enhanced-resolution confocal imaging of biological samples [16-19]. In this study, we explore the use of Richardson-Lucy, a restorative deconvolution algorithm, on the sheet-scanned image volume before applying a confocal slit to generate an enhanced confocal image, a process we call sheet-scanned dual-axis confocal (SS-DAC) microscopy. We compare the fluorescence imaging performance of LS-DAC, SS-DAC with sequential 2D deconvolution, as well as SS-DAC with 3D deconvolution. Sequential 2D deconvolution refers to performing deconvolution on each of the individual oblique light sheets imaged by the sCMOS camera, stitching together the deconvolved light sheets to construct an image volume, and then applying a digital confocal slit to retrieve a single 2D en face SS-DAC image. 3D deconvolution refers to performing deconvolution on the entire scanned volume prior to applying a digital confocal slit at the center of the volume to retrieve a single 2D en face SS-DAC image. With SS-DAC, we aim to improve the contrast (signal-to-background ratio), and resolution compared to a standard LS-DAC microscope.
Figure 1 provides a schematic of the SS-DAC system, which utilizes the same optical setup as a LS-DAC system described previously [15]. In brief, a singlemode fiber-coupled 658-nm diode laser is collimated and focused to a ~500-µm-long (FWHM) line in the sample without magnification (NA ~ 0.12). A solid immersion lens (SIL) is used to index match the illumination and collection beams into the sample, increasing the NA of the illumination beam from ~0.12 to ~0.16 [15, 20]. The light from the sample is collected off-axis from the illumination path (with a half-crossing angle of 30 degrees) and imaged onto the sCMOS camera with 5x magnification (the focal length of L2 is five times that of L1). The sample is translated along the x axis in order to image a thin 3D volume (Fig. 1b). Note that the central 32 pixels imaged by the sCMOS camera in the xc direction are acquired within the confocal parameter (twice the Rayleigh range) of both the illumination (2zRi) and collection (2zRc) beam paths and can therefore be approximated as “in focus”.
An image acquired by an optical system can be defined as:
or simply as a convolution:
In short, an image is created by the blurring of an object (sample) by the point-spread-function (PSF) of an optical system [21, 22]. The concept of deconvolution assumes that if the image is the result of an object convolved with a PSF, then it is possible to acquire an estimate of the true object if the observed object (image) and the system PSF are known.
Deconvolution algorithms require an input of a point-spread-function (PSF), which describes the 3D (or 2D) impulse response of the optical system to a point source. The PSF can be modeled computationally or measured empirically.
Theoretically-modeled PSF
Diffraction modeling was performed using FRED (Photon Engineering, Tucson, AZ), a commercial software. The modeled system was identical to the experimental tabletop LS-DAC system and utilized a small (250 nm × 250 nm) Lambertian reflective surface as a point target. The PSF was obtained by recording the signal on a simulated detector array (0.1 micron spacing) as the point target was translated laterally in the x direction.
Experimental PSF
Sub-resolution (250-nm diameter) fluorescent beads (Ex/Em: 660/680, Invitrogin F-8807) were sparsely embedded into a 1.5% agarose solution. The solidified agarose gel was imaged in three dimensions, using the sCMOS camera as a detector, by translating the sample in the x direction only. Individual beads centered at the focal plane were located within the images and their 3D PSFs were obtained. For a 2D PSF, individual sCMOS image frames (oblique light sheets) were chosen in which a fluorescent bead was centered within the image.
All image processing was performed using MATLAB (Mathworks Inc, Natick, MA). A standard Richardson-Lucy (RL) deconvolution algorithm was used in both the 2D and 3D cases for 10 iterations each. The RL algorithm has been developed and studied extensively in the past [23-26]. The basic steps can be summarized as:
-
0. Obtain initial estimate
For each iteration:
1. Calculate relative blur:
2. Find error term:
3. Update estimate:
-
4. Apply non-negative constraint:
if <1, then =0
5. Increment iteration: k = k+1
In this feasibility study, we acquired 64-pixel-tall oblique light-sheets (corresponding to 60 μm within the sample along the xc axis). Although this 64-pixel-tall dimension extends slightly beyond the confocal parameter of the illumination beam, 2zRi ~ 30 μm, only the central pixels (within the confocal parameter) are of value once the confocal slit is applied to the center of the image volume. In addition, prior to deconvolution, a Hanning window is applied to each short light sheet to taper the edges of the 64-pixel-long dimension in order to minimize deconvolution artifacts from sharp (high-frequency) edges. Future work will evaluate the SS-DAC method with smaller subarrays at a higher acquisition rate. For example, the smallest region of interest that our sCMOS detector (Orca Flash 4.0 v2, Hamamatsu Inc.) can acquire in its fastest acquisition mode (~25 kHz) is an 8-pixel-tall rectangular array.
SS-DAC with sequential 2D deconvolution
Each 64-pixel tall oblique light sheet was deconvolved using the 2D PSF obtained previously. A 3D image volume was stitched together with the deconvolved 2D slices. A confocal slit (3-pixel wide) was then applied to the center of the deconvolved image volume to obtain the final confocal image.
SS-DAC with 3D deconvolution
The image volume was stored in a 3D matrix and deconvolved with the 3D PSF obtained previously. A confocal slit (3-pixel wide) was then applied to the center of the deconvolved image volume to obtain the final confocal image.
To directly compare the performance of LS-DAC and SS-DAC, we performed fluorescence microscopy of fresh mouse brain vasculature, intestine, and oral tissues.
Imaging of mouse brain vasculature
AlexaFluor647-conjugated Dextran (Invitrogen, D-22914, 10 mg/mL) was injected retro-orbitally into anesthetized mice to highlight their brain vasculature. The mice were sacrificed immediately and their brains extracted and imaged without further tissue processing.
Imaging of mouse duodenum stained with Methylene Blue (MB)
A segment of the duodenum was obtained from a euthanized mouse and rinsed thoroughly using 1x PBS. One end of the intestine was tied off with a surgical suture and ~2 mL of 1% Methylene Blue (MB) was pipetted into the intestine and allowed to incubate for 5 – 10 minutes before the organ was rinsed with PBS. Trans-lumenal images of the duodenum were obtained from the exterior wall of the duodenum.
Imaging of mouse tongue stained with Methylene Blue (MB)
An excised mouse tongue was stained with approximately 0.5 mL of 1% Methylene Blue (MB) for 10 minutes before it was rinsed thoroughly with 1x PBS. Images were obtained from the top side of the tongue.
Figure 2 provides a comparison of an experimentally measured as well as a simulated intensity PSF of the LS-DAC system, showing good agreement.
Figure 2.
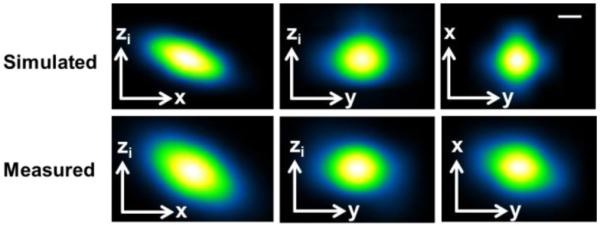
Comparison of the experimentally measured and numerically modeled PSFs. Scale bar = 1 µm.
Results from fluorescence imaging of mouse brain vasculature are shown in Fig. 3 when using SS-DAC with deconvolution (both 2D and 3D) in comparison to LS-DAC microscopy. In this case, since AF647-Dextran is injected to specifically label the brain vasculature, there is minimal background fluorescence, thus establishing a relatively high-contrast baseline condition for SS-DAC and LS-DAC microscopy (Fig. 3). Therefore, although the improvement in resolution is evident (i.e., the vascular details appear sharper in the deconvolved images), the improvement in contrast is not dramatic.
Figure 3.
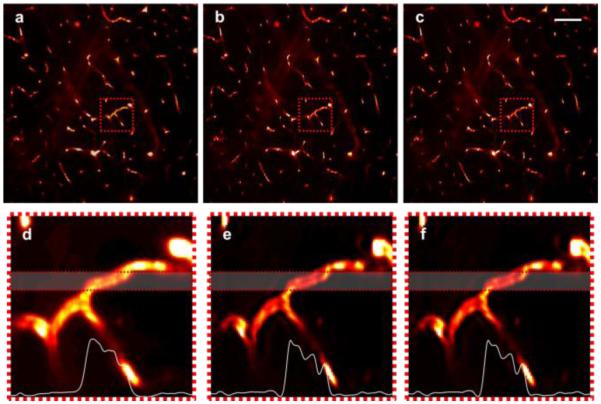
A comparison of fluorescence images of mouse brain vasculature (depth ~100 µm) using (a) LS-DAC, (b) SS-DAC with sequential 2D deconvolution, and (c) SS-DAC with 3D deconvolution, presented with line profiles. The zoomed-in views of the regions outlined in (a-c) are presented in panels (d-f) respectively. Average line profiles from the highlighted region in (d-f) are shown at the bottom of each panel. Scale bar = 100 µm.
In the case of intestinal tissues, MB was used to nonspecifically stain all lumenal structures, resulting in poorer contrast for the LS-DAC images. The features of the duodenal glands appear sharper, and image contrast is moderately improved, in the SS-DAC images (Fig. 4).
Figure 4.
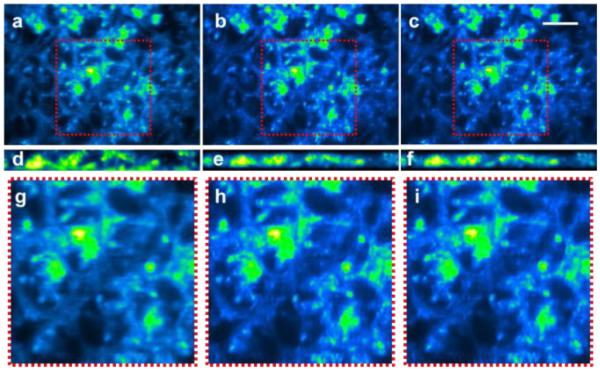
A comparison of mouse duodenum (depth ~100 µm) nonspecifically stained with Methylene Blue and fluorescently imaged using a) LS-DAC, (b) SS-DAC with sequential 2D deconvolution, and (c) SS-DAC with 3D deconvolution. Oblique light sheets, obtained at the center of the image volume, are shown in (d-f). The zoomed-in views of the regions outlined in (a-c) are presented in panels (g-i) respectively. Scale bar = 100 µm.
LS-DAC images of mouse oral tissue (tongue) reveal fungiform and filiform papillae (Fig. 5). The outlines of the numerous filiform papillae surrounding the fungiform papillae are sharper in the SS-DAC images.
Figure 5.
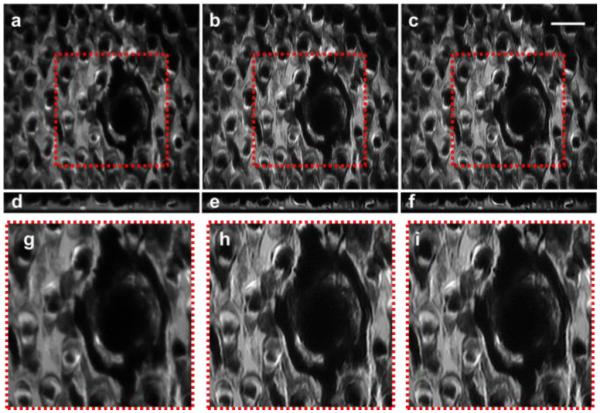
A comparison of mouse tongue (depth ~50 µm) stained non-specifically with Methylene Blue and fluorescently imaged using a) LS-DAC, (b) SS-DAC with sequential 2D deconvolution, and (c) SS-DAC with 3D deconvolution. Oblique light sheets, obtained at the center of the imaging volume are shown in (d-f). The zoomed-in views of the regions outlined in (a-c) are presented in panels (g-i) respectively. Scale bar = 100 µm.
SS-DAC using both 2D and 3D deconvolution methods show similar levels of improvement compared to LS-DAC images. In addition, the deconvolution processing time is approximately the same for both sequential 2D deconvolution (performed over an entire image volume) and 3D deconvolution. The RL algorithm is designed to perform well under relatively high SNR conditions. Results from our experiments confirm that the RL deconvolution algorithm is suitable for processing images obtained under our experimental conditions, i.e. at relatively shallow imaging depths.
In this study, we combine a pseudo-light-sheet microscopy approach with digital image processing using the RL restorative deconvolution algorithm prior to applying a confocal slit and acquiring a final confocal image, a technique referred to as sheet-scanned dual-axis confocal (SS-DAC) microscopy. We are able to improve the resolution in our images compared to images from a basic LS-DAC setup with modest improvements in image contrast. This approach is potentially very useful in low-signal conditions, where it is commonplace to increase the size of the confocal pinhole or slit to improve sensitivity, but at the cost of resolution and contrast. We are exploring the use of SS-DAC microscopy to restore the loss of resolution and contrast resulting from the use of a wide confocal pinhole/slit. We are also exploring methods to speed up the deconvolution process on shorter light sheets (e.g., 8-pixel tall) for potential use in real-time clinical applications with a miniature microscope.
Acknowledgments
The authors acknowledge Mr. Steven Leigh and Miss. Ye Chen for helpful technical insights and discussions about this project. The authors also acknowledge funding support from the NIH / NIBIB R00 EB008557 (Liu), the NIH / NIDCR R01 DE023497 (Liu), and the NIH / NCI R01 CA175391 (Liu).
References
- 1.Jabbour JM, Saldua MA, Bixler JN, Maitland KC. Confocal endomicroscopy: instrumentation and medical applications. Annals of biomedical engineering. 2012;40:378–397. doi: 10.1007/s10439-011-0426-y. [DOI] [PMC free article] [PubMed] [Google Scholar]
- 2.Pitris C, Bouma B, Shiskov M, Tearney G. A GRISM-based probe for spectrally encoded confocal microscopy. Optics express. 2003;11:120–124. doi: 10.1364/oe.11.000120. [DOI] [PubMed] [Google Scholar]
- 3.Sabharwal YS, Rouse AR, Donaldson L, Hopkins MF, Gmitro AF. Slit-scanning confocal microendoscope for high-resolution in vivo imaging. Applied optics. 1999;38:7133–7144. doi: 10.1364/ao.38.007133. [DOI] [PubMed] [Google Scholar]
- 4.Rajadhyaksha M, Anderson RR, Webb RH. Video-rate confocal scanning laser microscope for imaging human tissues in vivo. Applied optics. 1999;38:2105–2115. doi: 10.1364/ao.38.002105. [DOI] [PubMed] [Google Scholar]
- 5.Liu JT, Loewke NO, Mandella MJ, Levenson RM, Crawford JM, Contag CH. Point-of-care pathology with miniature microscopes. Analytical cellular pathology. 2011;34:81–98. doi: 10.3233/ACP-2011-011. [DOI] [PMC free article] [PubMed] [Google Scholar]
- 6.Dickensheets DL, Kino GS. Micromachined scanning confocal optical microscope. Optics letters. 1996;21:764–766. doi: 10.1364/ol.21.000764. [DOI] [PubMed] [Google Scholar]
- 7.Carlson K, Chidley M, Sung KB, Descour M, Gillenwater A, Follen M, Richards-Kortum R. In vivo fiber-optic confocal reflectance microscope with an injection-molded plastic miniature objective lens. Applied optics. 2005;44:1792–1797. doi: 10.1364/ao.44.001792. [DOI] [PubMed] [Google Scholar]
- 8.Kester RT, Christenson T, Kortum RR, Tkaczyk TS. Low cost, high performance, self-aligning miniature optical systems. Applied optics. 2009;48:3375–3384. doi: 10.1364/ao.48.003375. [DOI] [PMC free article] [PubMed] [Google Scholar]
- 9.Sanai N, Snyder LA, Honea NJ, Coons SW, Eschbacher JM, Smith KA, Spetzler RF. Intraoperative confocal microscopy in the visualization of 5-aminolevulinic acid fluorescence in low-grade gliomas. Journal of neurosurgery. 2011;115:740–748. doi: 10.3171/2011.6.JNS11252. [DOI] [PubMed] [Google Scholar]
- 10.Al-Gubory KH, Houdebine LM. In vivo imaging of green fluorescent protein-expressing cells in transgenic animals using fibred confocal fluorescence microscopy. European journal of cell biology. 2006;85:837–845. doi: 10.1016/j.ejcb.2006.03.007. [DOI] [PubMed] [Google Scholar]
- 11.Liu JT, Mandella MJ, Crawford JM, Contag CH, Wang TD, Kino GS. Efficient rejection of scattered light enables deep optical sectioning in turbid media with low-numerical-aperture optics in a dual-axis confocal architecture. Journal of biomedical optics. 2008;13:034020. doi: 10.1117/1.2939428. [DOI] [PubMed] [Google Scholar]
- 12.Liu JT, Mandella MJ, Loewke NO, Haeberle H, Ra H, Piyawattanametha W, Solgaard O, Kino GS, Contag CH. Micromirror-scanned dual-axis confocal microscope utilizing a gradient-index relay lens for image guidance during brain surgery. Journal of biomedical optics. 2010;15:026029. doi: 10.1117/1.3386055. [DOI] [PMC free article] [PubMed] [Google Scholar]
- 13.Chen Y, Liu JT. Optimizing the performance of dual-axis confocal microscopes via Monte-Carlo scattering simulations and diffraction theory. Journal of biomedical optics. 2013;18:066006. doi: 10.1117/1.JBO.18.6.066006. [DOI] [PMC free article] [PubMed] [Google Scholar]
- 14.Chen Y, Wang D, Liu JT. Assessing the tissue-imaging performance of confocal microscope architectures via Monte Carlo simulations. Optics letters. 2012;37:4495–4497. doi: 10.1364/OL.37.004495. [DOI] [PMC free article] [PubMed] [Google Scholar]
- 15.Wang D, Chen Y, Wang Y, Liu JT. Comparison of line-scanned and point-scanned dual-axis confocal microscope performance. Optics letters. 2013;38:5280–5283. doi: 10.1364/OL.38.005280. [DOI] [PMC free article] [PubMed] [Google Scholar]
- 16.Sheppard CJ, Mehta SB, Heintzmann R. Superresolution by image scanning microscopy using pixel reassignment. Optics letters. 2013;38:2889–2892. doi: 10.1364/OL.38.002889. [DOI] [PubMed] [Google Scholar]
- 17.Muller CB, Enderlein J. Image scanning microscopy. Physical review letters. 2010;104:198101. doi: 10.1103/PhysRevLett.104.198101. [DOI] [PubMed] [Google Scholar]
- 18.Wu Y, Ghitani A, Christensen R, Santella A, Du Z, Rondeau G, Bao Z, Colon-Ramos D, Shroff H. Inverted selective plane illumination microscopy (iSPIM) enables coupled cell identity lineaging and neurodevelopmental imaging in Caenorhabditis elegans. Proceedings of the National Academy of Sciences of the United States of America. 2011;108:17708–17713. doi: 10.1073/pnas.1108494108. [DOI] [PMC free article] [PubMed] [Google Scholar]
- 19.York AG, Parekh SH, Dalle Nogare D, Fischer RS, Temprine K, Mione M, Chitnis AB, Combs CA, Shroff H. Resolution doubling in live, multicellular organisms via multifocal structured illumination microscopy. Nature methods. 2012;9:749–754. doi: 10.1038/nmeth.2025. [DOI] [PMC free article] [PubMed] [Google Scholar]
- 20.Liu JT, Mandella MJ, Friedland S, Soetikno R, Crawford JM, Contag CH, Kino GS, Wang TD. Dual-axes confocal reflectance microscope for distinguishing colonic neoplasia. Journal of biomedical optics. 2006;11:054019. doi: 10.1117/1.2363363. [DOI] [PMC free article] [PubMed] [Google Scholar]
- 21.Swedlow JR. Quantitative fluorescence microscopy and image deconvolution. Methods in cell biology. 2013;114:407–426. doi: 10.1016/B978-0-12-407761-4.00017-8. [DOI] [PubMed] [Google Scholar]
- 22.Wallace W, Schaefer LH, Swedlow JR. A workingperson's guide to deconvolution in light microscopy. BioTechniques. 2001;31:1076–1078. doi: 10.2144/01315bi01. 1080, 1082 passim. [DOI] [PubMed] [Google Scholar]
- 23.Llacer J, Nunez J. Image Reconstruction and Restoration. SPIE; 1994. Ghost images and feasibility of reconstructions with the Richardson-Lucy algorithm. [Google Scholar]
- 24.Lucy LB. An iterative technique for the rectification of observed distributions. Astronomical Journal. 1974;79:745. [Google Scholar]
- 25.Richardson WH. Bayesian-Based Iterative Method of Image Restoration. J. Opt. Soc. Am. 1972;62:55–59. [Google Scholar]
- 26.Holmes TJ, Liu YH. Richardson-Lucy/maximum likelihood image restoration algorithm for fluorescence microscopy: further testing. Applied optics. 1989;28:4930–4938. doi: 10.1364/AO.28.004930. [DOI] [PubMed] [Google Scholar]