

Abstract
Methods currently available for the measurement of oxygen concentrations (oximetry) in viable tissues differ widely from each other in their methodological basis and applicability. The goal of this study was to compare two novel methods, particulate-based electron paramagnetic resonance (EPR) and OxyLite oximetry, in an experimental tumor model. EPR oximetry uses implantable paramagnetic particulates, whereas OxyLite uses fluorescent probes affixed on a fiber-optic cable. C3H mice were transplanted with radiation-induced fibrosarcoma (RIF-1) tumors in their hind limbs. Lithium phthalocyanine (LiPc) microcrystals were used as EPR probes. The pO2 measurements were taken from random locations at a depth of ~3 mm within the tumor either immediately or 48 h after implantation of LiPc. Both methods revealed significant hypoxia in the tumor. However, there were striking differences between the EPR and OxyLite readings. The differences were attributed to the volume of tissue under examination and the effect of needle invasion at the site of measurement. This study recognizes the unique benefits of EPR oximetry in terms of robustness, repeatability and minimal invasiveness.
INTRODUCTION
Many types of solid tumors are characterized by significant spatial and temporal heterogeneity in oxygenation. This is due in part to chaotic vasculature under elevated interstitial fluid pressure leading to compromised blood flow and regions of hypoxia. Tumor hypoxia is strongly linked to the poor outcome after chemotherapy or radiotherapy in several human malignancies (1, 2). Further, hypoxic tumors are biologically more aggressive. For example, it has been reported that hypoxic sarcoma or cervical cancers tend to metastasize (3, 4). Reports that poorly oxygenated tumors are more aggressive and less susceptible to treatment suggest that the tumor oxygenation status is an important parameter for cancer treatment (5, 6). The observation of substantial inter- and intratumor heterogeneities among tumors of similar histology and location further emphasizes the importance of the measurement of hypoxia in individual tumor/patients. In addition, the ability to monitor changes in the partial pressure of oxygen (pO2) after treatment could also have profound implications in the planning of effective follow-up therapeutic strategies (5, 6). In particular, radiotherapy could benefit from modulated treatment based on regional variations in pO2. Thus there has been considerable interest in techniques capable of measuring spatial and temporal heterogeneity in tumors that may help predict treatment outcomes (7).
Some of the techniques reported to be useful for the measurement of oxygen concentration in tumors include polarographic electrodes (8), fluorescence-based techniques (9), comet assays (10), immunohistochemical techniques (11–13), optical spectroscopy (14), magnetic resonance spectroscopy (7, 15), and positron emission tomography (16). Electron paramagnetic resonance (EPR) and OxyLite oximetry are two novel methods that share several similarities including their suitability for point measurements of pO2 in tissues and a higher sensitivity at the hypoxic conditions that occur in tumors. A comparison of the features of EPR and OxyLite oximetry is provided in Table 1. EPR oximetry uses implantable paramagnetic particulates (17–19), while OxyLite uses a fluorescent probe attached to a fiberoptic cable (9). Both techniques use probes that do not consume oxygen. EPR oximetry uses changes in the EPR linewidth caused by the interaction of paramagnetic molecular oxygen with the paramagnetic probe to determine pO2 (20). OxyLite consists of an optical fiber that carries light pulses that are used for inducing fluorescence in the ruthenium (II) chloride complex attached to the tip of the fiberoptic cable. The lifetime of fluorescence determines pO2, because it is inversely proportional to the oxygen tension at the tip (9). Although neither of these methods has been used clinically, they have the potential to be useful for oxygen measurements in humans. The goal of this study was to compare the two methods in an experimental tumor model. The study used a radiation-induced fibrosarcoma (RIF-1) tumor implanted in the hind limb of mice. The measurements were made from random locations within the tumor immediately and 48 h after implantation of the LiPc probe. The present study established EPR oximetry for reliable measurements of oxygen concentration in viable tissues and emphasized the unique capability of noninvasive and repeated measurements from the same site.
TABLE 1.
A Comparison of Important Features of EPR and OxyLite Oximetry
| Feature | EPR | OxyLite |
|---|---|---|
| Operation/principle | Oxygen-induced changes in the EPR linewidth | Oxygen-induced changes in the fluorescence lifetime |
| Probe | Paramagnetic microcrystalline particulate (LiPc) | Fluorescent probe (solid ruthenium chloride) |
| Probe size | Large number of crystals 2–5 μm wide and 10–60 μm long | 220-μm diameter |
| Oxygen consumption | None | None |
| Mode | Temporal (spatial possible under certain conditions) | Temporal (point measurement only) |
| Data acquisition | Seconds | Seconds, but requires several minutes stabilization |
| Range | 0–760 mmHg or higher | 0–100 mmHg |
| Accuracy | 0.1 mmHg (LiPc) | 0.7 mmHg up to 10 mmHg 10% above 10 mmHg |
| Sensitivity/drift | Sensitivity increases at low pO2 No drift |
Sensitivity increases at low pO2 Drift increases at low pO2 |
| Response time to 90% | 1 s | 5 s |
| Effect of Temperature | Negligible | Yes |
| Repeatability | Repeatable for days/months from the same site of implantation | No |
MATERIALS AND METHODS
Materials
Lithium phthalocyanine (LiPc) was synthesized in our laboratory as described (21). OxyLite probes were purchased from Oxford Optronix, UK.
Animal Preparation
The animal studies were done under a protocol approved by the Institutional Laboratory Animal Care and Use Committee of The Ohio State University. Female C3H mice, obtained from Charles River Laboratories (Wilmington, MA) were used. One million RIF-1 cells were implanted in the subcutaneous tissue of the right hind limb. The tumors were ~350 mm3 in volume at the time of pO2 measurements. All surgical procedures and measurements were performed under ketamine/xylazine anesthesia (200 mg/kg body weight, 14 mg/kg body weight i.p.). Two groups of mice were used: (1) a day 0 group of 58 mice in which the EPR and OxyLite pO2 measurements were performed immediately after the implantation of the EPR probe and (2) a day 2 group of 43 mice in which the EPR and OxyLite measurements were performed 48 h after implantation of the EPR probe.
EPR Measurements
For EPR oximetry, about 10 μg of LiPc microcrystalline powder was implanted within the tumor at a depth of ~3 mm using a 22-gauge needle. The EPR measurements were performed, after 30 min of implantation, using an L-band (1.2 GHz) spectrometer with the following settings: incident microwave power, 210 μW; sweep width, 0.2 mT; modulation amplitude, 5 μT; modulation frequency, 100 kHz. The peak-to-peak widths of the first-derivative EPR spectra were converted to pO2 using a calibration curve (21). The duration of the EPR readings was ~5 min. An infrared lamp was used to maintain the body temperature within 36–37°C.
OxyLite Measurements
OxyLite probes (with ruthenium chloride complex) come precalibrated at 37°C. Their response is non-linearly dependent on temperature. A 22-gauge needle was used to place the probe into the tumor, but the needle was withdrawn, leaving the probe (attached to the cable) behind in the tissue. Readings were taken for about 10 min after stabilization, while stabilization took anywhere from 10 to 30 min. A heating pad was used to keep the body temperature of the mice within 36–37_C. In a few selected experiments in each group, the temperature of the tumor tissue was monitored using a dual (pO2 and temperature) OxyLite probe. The OxyLite measurements were performed at multiple sites (up to four) within the same tumor at a depth of ~3 mm.
Histological Study
Tumors were isolated and fixed in 10% paraformaldehyde, made into paraffin blocks, and sectioned into 4-μm slices. The slices were stained with α-actin (smooth muscle, stained for blood vessels) and DAPI (a nuclear stain). Slides were observed under an inverted light microscope with an epifluorescence attachment that enabled collection of fluorescent images (Nikon TE-2000U). Digital macrophotographs of the paraffin blocks were also taken.
Statistical Analysis and Reporting
The mean pO2 values are expressed as means ± SEM. The significance levels between mean pO2 values were determined using the Student’s unpaired t test. Values of P < 0.05 were considered significant. The Mann-Whitney U test was used to determine significance levels between median values.
RESULTS AND DISCUSSION
One EPR and up to four OxyLite readings were taken from each tumor. The data were obtained from independent sites at a depth of ~3 mm in the tumor. Two sets of data were collected. In the first set, both the EPR and OxyLite data were obtained immediately after the implantation of the EPR probe (day 0). In the second set, the data were obtained 48 h after the implantation of the EPR probe (day 2). Figure 1 shows the OxyLite pO2 values plotted relative to the EPR pO2 values for each tumor on day 0 and day 2. Both sets of data showed significant scatter within the set as well as differences in the nature of scatter between sets. In general, the OxyLite values were more scattered than the EPR values. Whereas the scatter of data within the set is attributed to the well-established spatial heterogeneity of pO2 in RIF-1 tumors, the differences between the sets (day 0 and day 2) are most likely due to measurement artifacts. The EPR implant occupies a considerably larger volume (~400-μm diameter of a spherical deposit) when compared to the size of the OxyLite probe (220 μm) (22). The smaller size of the OxyLite probe could allow display of a large variance among multiple sites in the heterogeneous tumor. On the other hand, the EPR probe would report the mean value of pO2 averaged over a relatively large volume in the tumor, thereby resulting in a reduced variance/scatter of readings compared to OxyLite.
FIG 1.

EPR and OxyLite pO2 values in RIF-1 tumor. The plot shows the pO2 values obtained from random sites in the tumor using EPR and OxyLite oximetry. Two sets of data are shown: (1) measured immediately after implantation of EPR probe (day 0) and (2) measured 48 h after implantation of the EPR probe (day 2). The OxyLite measurements were made at multiple sites (up to four) and plotted as a function of a single EPR measurement obtained from the same tumor. The measurements were made on a total of 53 tumors. The data show significant scatter within the set as well as differences in the nature of scatter between sets.
Figure 2 shows the mean pO2 values of EPR and OxyLite on day 0 and day 2. The mean pO2 of the EPR/day 0 set was 7.7 ± 0.6 mmHg. A significant reduction in the mean pO2 (5.5 ± 0.7 mmHg) was observed on day 2. A similar trend was observed in the case of median pO2 values. The EPR measurements on day 0 were made immediately after the implantation of the probe, i.e. from a freshly implanted site. The trauma associated with the implant, as well as possible rupture of microvasculature, could lead to a higher pO2 on day 0. The lower pO2 on day 2 could be due to the fact that, by then, the tissue had been able to recover from the trauma caused by the needle insertion. It might be argued that an increase in the tumor size during this period (48 h) could also contribute to the observed decrease in pO2. Our earlier study (23) using repeated measurements during RIF-1 tumor growth did not show any significant variation of pO2 in the size range used in the present experiments. Thus the decrease in pO2 on day 2 cannot be attributed to the effect of increasing tumor size.
FIG 2.

Mean ± SEM EPR and OxyLite readings. The number of values (N) and median of the groups shown in the plot are (Group: N, median): EPR/day 0: 58, 7.3 mmHg; EPR/day 2: 43, 5.0 mmHg; OxyLite/ day 0: 60, 2.8 mmHg; OxyLite/day 2: 105, 3.9 mmHg. *Significantly different from EPR/day 0; **significantly different from OxyLite/day 0.
Further, EPR oximetry showed a higher mean pO2 on day 0 compared to that of the OxyLite on day 0. The EPR probe implant would occupy a greater volume (33.5 × 106 μm3, assuming a 400-μm-diameter spherical deposit) in the tissue compared to the OxyLite probe (5.7 × 106 μm3, corresponding to a diameter of 220 μm). The approximately six-fold larger volume of the EPR probe would result in a higher probability of the probe being closer to a well-perfused region of tissue, such as the proximity of a major blood vessel. This could explain why the EPR pO2 data values are higher compared to the OxyLite values on day 0. Further, the 22-gauge needle (0.71 mm diameter) used for the implantation of the probes would cause microvascular rupture and bleeding. Although the needles were removed in both cases, leaving the probes in the tissue, the OxyLite probe was still attached to the fiber-optic cable, while the EPR probe was left in the tissue. Thus the OxyLite probe could exert pressure at the site of measurement causing decreased perfusion and hence lower pO2 at the site. Furthermore, movement of the fiber-optic cable may cause fluctuations in pressure, causing instability in the measurements.
There was a reasonable agreement between the mean pO2 values obtained using the two techniques on day 2. The difference between the mean pO2 values of EPR/day 2 (5.5 ± 0.7 mmHg) and OxyLite/day 2 (6.2 ± 0.7 mmHg) was not significant. On the other hand, the OxyLite values showed a significant difference between day 0 (3.9 ± 0.5 mmHg) and day 2 (6.2 ± 0.7 mmHg). The fact that the OxyLite/day 2 value is more comparable to that of EPR day 0/2 suggests that the OxyLite day 0 readings may be suspect. At present there is no good explanation for this observation. It is possible that the trauma associated with the fresh implantation of the EPR probe on day 0 prior to OxyLite measurements could be responsible. However, this needs to be verified.
To understand the nature of tissue damage caused by the probe implantation, we performed histological analyses on excised tissues. Figure 3 shows visual images as well as stained sections of the tumor. The unstained visual image of EPR/day 0 tissue (panel A) shows significant hemorrhage (red color), suggesting rupture of microvasculature and bleeding. The hemorrhage is not observed on day 2. Also, OxyLite probe insertion seems to cause extensive hemorrhage, as is evident by the red surrounding tissue. The histological staining also reveals tissue damage in both cases. The smooth muscle α-actin staining of blood vessels (red color in panel B), nuclear staining (blue color, panel C), and bright-light image (panel D) indicate a void space (indicated by dashed enclosure in panel C) in the tissue at the sites of EPR implant on day 2 and OxyLite. The histological results strongly emphasize the difference between an invasive measurement made immediately after implantation of the probe and a noninvasive measurement performed later (day 2 in this case) using EPR oximetry. While EPR oximetry enables the noninvasive measurements to be made days and weeks after implantation of the probe, this is not possible with OxyLite.
FIG 3.

Effect of the probe implant on the tissue. Sections from RIF-1 tumor prepared after completion of pO2 measurements on the day of implantation (EPR day 0 and OxyLite) and 48 h after (EPR day 2) are shown. Panel A: Unstained visual image (macrophotography) showing the deposition of EPR and OxyLite probes; panel B: fluorescence image of smooth muscle (α-actin) staining showing blood vessels; panel C: fluorescence image of DAPI staining showing nuclei; panel D: a bright-light image of panels B/C. The probe implants are recognized from the void space indicated by the dashed enclosure in panel C.
A histogram representation of the pO2 data obtained using EPR and OxyLite is shown in Fig. 4. The OxyLite data show more hypoxia and right-skewness compared to EPR data. In many tumors, including RIF-1 tumors, Eppendorf electrode measurements have always shown significantly right-skewed pO2 histograms (24). The present observation that the EPR pO2 values are significantly less skewed seems to suggest the importance of the probe size in the measurement of pO2. As we noted before, the probe sizes are significantly different among the three methods. To explain the differences in the distribution of data obtained from OxyLite, EPR and Eppendorf microelectrode methods, computer simulations were performed. The diameters of microelectrode and OxyLite probe were 12 μm and 220 μm, respectively. The diameter of the deposit of LiPc crystals (EPR) was assumed to be 400 μm, approximated to a spherical deposit. Since most tumors are reported to have a right-skewed distribution because of their hypoxic nature and wide variance, we included both a right-skewed and normal distribution input model in the simulation.
FIG 4.

Histogram of the pO2 data. The OxyLite data for day 0 and day 2 show a substantial population of lower pO2 values and considerable right-skewness. On the other hand, the EPR data show a normal distribution.
The simulation was performed as follows. The tumor was represented by a 512 × 512 matrix where the value of each matrix element represented the local pO2. The ratios of areas for microelectrodes, OxyLite and EPR probes were 1:9:25 pixels. Although these ratios do not map to the exact ratios of the actual probe sizes, they were nevertheless sufficient to describe the effect of probe size on the data distribution. The simulation used a random selection of a set of pixels, for example, 1 pixel for microelectrode, 9 contiguous pixels for OxyLite, or 25 contiguous pixels for EPR. The average value was calculated from the selected set of pixels. Two kinds of initial random pO2 distributions (inputs) were used: a normal distribution and a right-skewed distribution. The results from the three oximetry methods were plotted in a histogram, and the mean, median and skewness values were calculated.
The simulation results, as shown in Table 2 and Fig. 5, revealed the microelectrode data distribution to be very close to the actual distribution (skewness 2.17 compared to the input skew of 2.31). OxyLite, which used a larger probe than the microelectrode, showed a decrease in the amount of skewness (skewness 1.07), while EPR showed a more normal distribution (skewness 0.39). The EPR probe, being present in a large volume in the tissue, is expected to report the average of pO2 values that would most likely include both poorly oxygenated and well-oxygenated regions. On the other hand, in the case of a skewed input, the smaller probes like the microelectrode would show higher numbers of low pO2 values because of less averaging. Thus, while a single pO2 reading using EPR is a better representation of the overall pO2 of the tumor, the averaging effect due to the larger EPR probe size has a tendency to alter skewness that may be inherent to the pO2 distribution in the tumor. In the case of a normal distribution of inputs, all three methods showed a normal distribution.
TABLE 2.
Simulation Results Demonstrating the Effect of Probe Size on the pO2 Readout
| Method of measurement | Skewed distribution
|
Normal distribution
|
||||
|---|---|---|---|---|---|---|
| Mean (mmHg) | Median (mmHg) | Skewness | Mean (mmHg) | Median (mmHg) | Skewness | |
| Actual (input) | 1.50 | 0.91 | 2.31 | 7.59 | 7.59 | 0 |
| Microelectrode | 1.53 | 0.89 | 2.1 | 7.61 | 7.61 | 0.12 |
| OxyLite | 1.47 | 1.39 | 1.22 | 7.60 | 7.60 | 0.14 |
| EPR | 1.51 | 1.49 | 0.37 | 7.60 | 7.58 | 0.09 |
FIG 5.
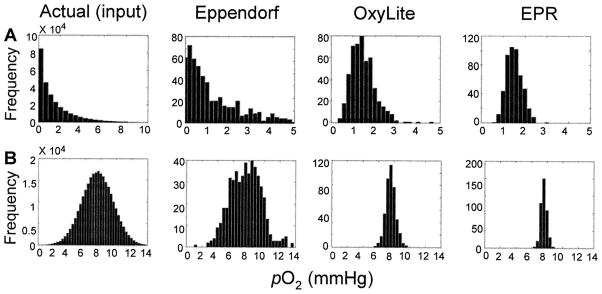
Simulation of the differences in the distribution of pO2 data obtained from OxyLite, EPR, and Eppendorf microelectrode methods. The simulation assumed a 512 × 512 matrix of pO2 values with a normal and right-skewed distribution and calculated the output (pO2 readings) as a function of probe size (Eppendorf microelectrode, OxyLite and EPR). The plots show the histogram of actual input (panel A: right-skewed; panel B: normal distribution) and corresponding outputs by Eppendorf, OxyLite and EPR methods. The mean, median and skewness values are given in Table 2. For methods with a larger probe size, the distribution tends to be normal. While a normal input distribution is preserved in the output irrespective of probe size, a skewed input distribution may tend to become a normal distribution if measured using a relatively large probe.
The magnitude of the skewness also depended on the type of input (actual distribution of pO2). If the input contains gradually varying hypoxic regions with a large core of severely hypoxic region, as shown in Fig. 6A, a large probe size may increase the skewness (panels B and C). This type of input was used by Braun et al. (22) for simulating the effect of probe size between microelectrodes and OxyLite. On the other hand, if the input distribution is random, as shown in Fig. 6D, the skewness decreases as the probe size increases (panels E and F). The random distribution (panel D) is a more accurate representation of input data for our measurements. This is because most of our experimental measurements were away from the core of the tumor. Consequently, our measurements did not include contiguous regions of severe hypoxia, which usually occurs at the center of the tumor. This would explain why the skewness decreased with increasing probe size in our data.
FIG 6.

Effect of pO2 heterogeneity and probe size on the shape of measured pO2 histograms. Tumors with (panel A) a smooth variation of pO2 with severely hypoxic contiguous region and (panel D) a randomly distributed pO2 were used as inputs. The corresponding histograms obtained using microelectrodes (panels B and E) and OxyLite (panels C and F) are shown. In the case of input A, the skewness increases with increasing probe size (panel B, microelectrode, skewness 1.28, compared to panel C, OxyLite, skewness 1.31). In the case of panel D, the skewness decreases with increasing probe size (panel E, microelectrode, skewness 1.26, compared to panel F, OxyLite, skewness 0.64).
It must be noted that the simulation did not take the following into account: (1) Measurements using microelectrodes are usually obtained by stepped movement of the probe, while OxyLite and EPR measurements are from a single site; (2) there are differences in the degree of invasiveness of the three methods; and (3) the EPR implant may not be spherical. Nevertheless, the differences in the probe sizes appear to be a contributing factor in the observed differences in the distribution of data obtained using OxyLite and EPR.
O’Hara et al. (25) have cited differences between EPR oximetry and OxyLite readouts from rat brain and attributed the differences to the variations in the volume, depth and location of measurement. Significant hemorrhage was observed in all the OxyLite tracks, while no bleeding was observed at the site of EPR implants. On the other hand, Elas et al. (26) performed EPR imaging on a murine FSa fibrosarcoma tumor by perfusing with a water-soluble probe and found a good correlation between the EPR and OxyLite data. The goal of our study was to compare “point” measurements of pO2 using particulate probe-based EPR spectroscopy and OxyLite.
Previously, OxyLite had been compared with other techniques, for example, microelectrodes (22, 27), paired cell survival assay (28), BOLD MRI (29, 30), and EPR (25, 31, 32). Braun et al. (22) reported that the discrepancy between microelectrodes and OxyLite was greater in tumors compared to normal tissue. With microelectrodes, less than 20% of the values were <1 mmHg, while over 50% of the OxyLite values were <1 mmHg. A good agreement between the hypoxic cell fractions measured by OxyLite and paired cell survival assays has been observed in tumors of less than 500 mm3 (28). However, OxyLite showed higher hypoxic cell fractions for tumors larger than 500 mm3. Difficulties in the use of OxyLite, such as the stability of the readings, fragile probes, and the probe being extremely sensitive to minor movement, have also been reported (28). It is also evident that the OxyLite method, being an invasive procedure, cannot be used for repeated measurements from the same site. Furthermore, OxyLite requires 10 to 20 min, or sometimes even longer, to stabilize, while EPR oximetry can be done in less than 1 min.
Microelectrodes have also been used for measurement of pO2 in RIF-1 tumors. Adam et al. (24) have reported a median pO2 of 1.2 mmHg in RIF-1 52 to 924-mm3 tumors. Pogue et al. (33) have reported a median pO2 of 12.9 mmHg in 634 ± 203-mm3 tumors. Kavanagh et al. (34) have reported a median pO2 of 1.2 mmHg and a mean of 4.5 ± 0.5 mmHg using Eppendorf.
In summary, the present study compared the oximetric capabilities of EPR and OxyLite for a random sampling of pO2 in a solid tumor. Both EPR oximetry and OxyLite reported pO2 values that were less than 10 mmHg, consistent with the hypoxic nature of the RIF-1 tumors. Despite some common features, including their applicability for point measurements and enhanced sensitivity for pO2 measurements in hypoxic tissues, the two methods showed considerable differences in the measured pO2 values. The differences can be attributed to the spatial heterogeneity of tumor oxygenation and the “examined” area/volume of measurements. The OxyLite data showed a right-skewed distribution while the EPR data showed a more normal distribution. The EPR oximetry, on the other hand, is more consistent, particularly when the measurements are performed 48 h or more after implantation of the probe. The EPR oximetry is not subjected to probe-pressure artifacts and subsequent measurements can be performed noninvasively and repeatedly over long periods.
Acknowledgments
This work was supported by NIH grant R01 EB004031. We thank Nancy Trigg for the critical reading of the manuscript and I. Krishna Mohan for helping with the histological studies.
References
- 1.Hockel M, Knoop C, Schlenger K, Vorndran B, Baussmann E, Mitze M, Knapstein PG, Vaupel P. Intratumoral pO2 predicts survival in advanced cancer of the uterine cervix. Radiother Oncol. 1993;26:45–50. doi: 10.1016/0167-8140(93)90025-4. [DOI] [PubMed] [Google Scholar]
- 2.Okunieff P, Hoeckel M, Dunphy EP, Schlenger K, Knoop C, Vaupel P. Oxygen tension distributions are sufficient to explain the local response of human breast tumors treated with radiation alone. Int J Radiat Oncol Biol Phys. 1993;26:631–636. doi: 10.1016/0360-3016(93)90280-9. [DOI] [PubMed] [Google Scholar]
- 3.Brizel DM, Scully SP, Harrelson JM, Layfield LJ, Bean JM, Prosnitz LR, Dewhirst MW. Tumor oxygenation predicts for the likelihood of distant metastases in human soft tissue sarcoma. Cancer Res. 1996;56:941–943. [PubMed] [Google Scholar]
- 4.Rofstad EK. Microenvironment-induced cancer metastasis. Int J Radiat Biol. 2000;76:589–605. doi: 10.1080/095530000138259. [DOI] [PubMed] [Google Scholar]
- 5.Evans SM, Koch CJ. Prognostic significance of tumor oxygenation in humans. Cancer Lett. 2003;195:1–16. doi: 10.1016/s0304-3835(03)00012-0. [DOI] [PubMed] [Google Scholar]
- 6.Menon C, Fraker DL. Tumor oxygenation status as a prognostic marker. Cancer Lett. 2005;221:225–235. doi: 10.1016/j.canlet.2004.06.029. [DOI] [PubMed] [Google Scholar]
- 7.Gillies RJ, Bhujwalla ZM, Evelhoch J, Garwood M, Neeman M, Robinson SP, Sotak CH, Van Der Sanden B. Applications of magnetic resonance in model systems: Tumor biology and physiology. Neoplasia. 2000;2:139–151. doi: 10.1038/sj.neo.7900076. [DOI] [PMC free article] [PubMed] [Google Scholar]
- 8.Kallinowski F, Zander R, Hoeckel M, Vaupel P. Tumor tissue oxygenation as evaluated by computerized-pO2-histography. Int J Radiat Oncol Biol Phys. 1990;19:953–961. doi: 10.1016/0360-3016(90)90018-f. [DOI] [PubMed] [Google Scholar]
- 9.Griffiths JR, Robinson SP. The OxyLite: A fibre-optic oxygen sensor. Br J Radiol. 1999;72:627–630. doi: 10.1259/bjr.72.859.10624317. [DOI] [PubMed] [Google Scholar]
- 10.Olive PL, Durand RE. Detection of hypoxic cells in a murine tumor with the use of the comet assay. J Natl Cancer Inst. 1992;84:707–711. doi: 10.1093/jnci/84.9.707. [DOI] [PubMed] [Google Scholar]
- 11.Evans SM, Joiner B, Jenkins WT, Laughlin KM, Lord EM, Koch CJ. Identification of hypoxia in cells and tissues of epigastric 9L rat glioma using EF5 [2-(2-nitro-1H-imidazol-1-yl)-N-(2,2,3,3,3-pentafluoropropyl) acetamide] Br J Cancer. 1995;72:875–882. doi: 10.1038/bjc.1995.427. [DOI] [PMC free article] [PubMed] [Google Scholar]
- 12.Koch CJ, Evans SM, Lord EM. Oxygen dependence of cellular uptake of EF5 [2-(2-nitro-1H-imidazol-1-yl)-N-(2,2,3,3,3-pentafluoropropyl)acetamide]: Analysis of drug adducts by fluorescent antibodies vs bound radioactivity. Br J Cancer. 1995;72:869–874. doi: 10.1038/bjc.1995.426. [DOI] [PMC free article] [PubMed] [Google Scholar]
- 13.Raleigh JA, Miller GG, Franko AJ, Koch CJ, Fuciarelli AF, Kelly DA. Fluorescence immunohistochemical detection of hypoxic cells in spheroids and tumours. Br J Cancer. 1987;56:395–400. doi: 10.1038/bjc.1987.213. [DOI] [PMC free article] [PubMed] [Google Scholar]
- 14.Sevick EM, Chance B, Leigh J, Nioka S, Maris M. Quantitation of time- and frequency-resolved optical spectra for the determination of tissue oxygenation. Anal Biochem. 1991;195:330–351. doi: 10.1016/0003-2697(91)90339-u. [DOI] [PubMed] [Google Scholar]
- 15.Swartz HM, Clarkson RB. The measurement of oxygen in vivo using EPR techniques. Phys Med Biol. 1998;43:1957–1975. doi: 10.1088/0031-9155/43/7/017. [DOI] [PubMed] [Google Scholar]
- 16.Gupta AK, Hutchinson PJ, Fryer T, Al-Rawi PG, Parry DA, Minhas PS, Kett-White R, Kirkpatrick PJ, Mathews JC, Menon DK. Measurement of brain tissue oxygenation performed using positron emission tomography scanning to validate a novel monitoring method. J Neurosurg. 2002;96:263–268. doi: 10.3171/jns.2002.96.2.0263. [DOI] [PubMed] [Google Scholar]
- 17.Liu KJ, Gast P, Moussavi M, Norby SW, Vahidi N, Walczak T, Wu M, Swartz HM. Lithium phthalocyanine: A probe for electron paramagnetic resonance oximetry in viable biological systems. Proc Natl Acad Sci USA. 1993;90:5438–5442. doi: 10.1073/pnas.90.12.5438. [DOI] [PMC free article] [PubMed] [Google Scholar]
- 18.Matsumoto A, Matsumoto S, Sowers AL, Koscielniak JW, Trigg NJ, Kuppusamy P, Mitchell JB, Subramanian S, Krishna MC, Matsumoto K. Absolute oxygen tension (pO2) in murine fatty and muscle tissue as determined by EPR. Magn Reson Med. 2005;54:1530–1535. doi: 10.1002/mrm.20714. [DOI] [PubMed] [Google Scholar]
- 19.Pandian RP, Parinandi NL, Ilangovan G, Zweier JL, Kuppusamy P. Novel particulate spin probe for targeted determination of oxygen in cells and tissues. Free Radic Biol Med. 2003;35:1138–1148. doi: 10.1016/s0891-5849(03)00496-9. [DOI] [PubMed] [Google Scholar]
- 20.Ilangovan G, Zweier JL, Kuppusamy P. Mechanism of oxygen-induced EPR line broadening in lithium phthalocyanine microcrystals. J Magn Reson. 2004;170:42–48. doi: 10.1016/j.jmr.2004.05.018. [DOI] [PubMed] [Google Scholar]
- 21.Ilangovan G, Li H, Zweier JL, Kuppusamy P. Electrochemical preparation and EPR studies of lithium phthalocyanine. Part 3: Measurements of oxygen concentration in tissues and biochemical reactions. J Phys Chem B. 2001;105:5323–5330. [Google Scholar]
- 22.Braun RD, Lanzen JL, Snyder SA, Dewhirst MW. Comparison of tumor and normal tissue oxygen tension measurements using OxyLite or microelectrodes in rodents. Am J Physiol Heart Circ Physiol. 2001;280:H2533–2544. doi: 10.1152/ajpheart.2001.280.6.H2533. [DOI] [PubMed] [Google Scholar]
- 23.Ilangovan G, Bratasz A, Li H, Schmalbrock P, Zweier JL, Kuppusamy P. In vivo measurement and imaging of tumor oxygenation using coembedded paramagnetic particulates. Magn Reson Med. 2004;52:650–657. doi: 10.1002/mrm.20188. [DOI] [PubMed] [Google Scholar]
- 24.Adam MF, Dorie MJ, Brown JM. Oxygen tension measurements of tumors growing in mice. Int J Radiat Oncol Biol Phys. 1999;45:171–180. doi: 10.1016/s0360-3016(99)00157-1. [DOI] [PubMed] [Google Scholar]
- 25.O’Hara JA, Hou H, Demidenko E, Springett RJ, Khan N, Swartz HM. Simultaneous measurement of rat brain cortex PtO2 using EPR oximetry and a fluorescence fiber-optic sensor during normoxia and hyperoxia. Physiol Meas. 2005;26:203–213. doi: 10.1088/0967-3334/26/3/006. [DOI] [PubMed] [Google Scholar]
- 26.Elas M, Ahn KH, Parasca A, Barth ED, Lee D, Haney C, Halpern HJ. Electron paramagnetic resonance oxygen images correlate spatially and quantitatively with Oxylite oxygen measurements. Clin Cancer Res. 2006;12:4209–4217. doi: 10.1158/1078-0432.CCR-05-0446. [DOI] [PubMed] [Google Scholar]
- 27.Seddon BM, Honess DJ, Vojnovic B, Tozer GM, Workman P. Measurement of tumor oxygenation: In vivo comparison of a luminescence fiber-optic sensor and a polarographic electrode in the p22 tumor. Radiat Res. 2001;155:837–846. doi: 10.1667/0033-7587(2001)155[0837:motoiv]2.0.co;2. [DOI] [PubMed] [Google Scholar]
- 28.Urano M, Chen Y, Humm J, Koutcher JA, Zanzonico P, Ling C. Measurements of tumor tissue oxygen tension using a time-resolved luminescence-based optical Oxylite probe: Comparison with a paired survival assay. Radiat Res. 2002;158:167–173. doi: 10.1667/0033-7587(2002)158[0167:mottot]2.0.co;2. [DOI] [PubMed] [Google Scholar]
- 29.Baudelet C, Gallez B. How does blood oxygen level-dependent (BOLD) contrast correlate with oxygen partial pressure (pO2) inside tumors? Magn Reson Med. 2002;48:980–986. doi: 10.1002/mrm.10318. [DOI] [PubMed] [Google Scholar]
- 30.Baudelet C, Gallez B. Effect of anesthesia on the signal intensity in tumors using BOLD-MRI: Comparison with flow measurements by laser Doppler flowmetry and oxygen measurements by luminescence-based probes. Magn Reson Imaging. 2004;22:905–912. doi: 10.1016/j.mri.2004.02.005. [DOI] [PubMed] [Google Scholar]
- 31.Jordan BF, Gregoire V, Demeure RJ, Sonveaux P, Feron O, O’Hara J, Vanhulle VP, Delzenne N, Gallez B. Insulin increases the sensitivity of tumors to irradiation: Involvement of an increase in tumor oxygenation mediated by a nitric oxide-dependent decrease of the tumor cells oxygen consumption. Cancer Res. 2002;62:3555–3561. [PubMed] [Google Scholar]
- 32.Jordan BF, Sonveaux P, Feron O, Grégoire V, Beghein N, Gallez B. Nitric oxide-mediated increase in tumor blood flow and oxygenation of tumors implanted in muscles stimulated by electric pulses. Int J Radiat Oncol Biol Phys. 2003;55:1066–1073. doi: 10.1016/s0360-3016(02)04505-4. [DOI] [PubMed] [Google Scholar]
- 33.Pogue BW, Paulsen KD, O’Hara JA, Wilmot CM, Swartz HM. Estimation of oxygen distribution in RIF-1 tumors by diffusion model-based interpretation of pimonidazole hypoxia and Eppendorf measurements. Radiat Res. 2001;155:15–25. doi: 10.1667/0033-7587(2001)155[0015:eoodir]2.0.co;2. [DOI] [PubMed] [Google Scholar]
- 34.Kavanagh MC, Sun A, Hu Q, Hill RP. Comparing techniques of measuring tumor hypoxia in different murine tumors: Eppendorf pO2 histograph, [3H]misonidazole binding and paired survival assay. Radiat Res. 1996;145:491–500. [PubMed] [Google Scholar]