

Abstract
The recent development of salivary proteomics has led to the identification of potential biomarkers for diagnosing patients with primary Sjögren's syndrome (pSS). Here we sought to identify differentially produced salivary metabolites from pSS patients and healthy controls (HCs) that might be used to characterize this disease. We obtained salivary samples from 12 female pSS patients (mean age 44.2 ± 13.01) and 21 age-matched female HCs. The metabolite profiles of saliva were analysed by gas chromatography-mass spectrometry. The total metabolite levels in each of the samples were calculated and compared across the study participants. A total of 88 metabolites were detected across the study samples, 41 of which were observed at reduced levels in the samples frompSS patients. Principal component analysis (PCA) revealed a loss in salivary metabolite diversity in the pSS patient samples compared to the HC samples. The reduced presence of glycine, tyrosine, uric acid and fucose, which may reflect salivary gland destruction due to chronic sialoadenitis, contributed to the loss of diversity. Comparative PCA of the pSS patients revealed the presence of two subpopulations based on their metabolite profiles, and these two subpopulations showed a significant difference in the prevalence of major salivary glanditis (P = 0·014). In this study, we found that the salivary metabolite profile of pSS patients was less diverse than that of HCs and that the metabolite profiles in pSS patients were affected by the presence of major salivary glanditis.
Keywords: major salivary glanditis, metabolomics, saliva, Sjögren's syndrome
Introduction
Primary Sjögren's syndrome (pSS) is an autoimmune disease characterized by salivary and lacrimal gland hypofunction. Mononuclear cell infiltration, followed by tissue destruction, results in the development of oral and ocular dryness. Changes in the quantity and quality of saliva are hallmarks of pSS and are presumed to reflect the disease pathogenesis in the salivary glands.
Whole saliva is a fluid produced by three pairs of major salivary glands, namely the parotid, submandibular and sublingual glands, and numerous minor salivary glands, all of which are located beneath the oral mucosa. Whole saliva is a complex fluid containing a variety of substances, including metabolites, proteins, mRNAs, DNAs, enzymes, hormones, antibodies, anti-microbial constituents and growth factors, and evidence suggests that changes in the levels of these substances are associated with the pathogenesis of various diseases 1. The collection of saliva is a simple, non-invasive and low-cost procedure, and recent technical advances have shown that the analysis of saliva has the potential to monitor the status of various physiological systems 1.
Because the salivary glands are a major site of autoimmune destruction in pSS, changes in salivary components are assumed to reflect the pathogenesis of this disease. Several proteomic studies have shown differential protein expression in the saliva of pSS patients and healthy control subjects (HCs), which could lead to the development of diagnostic biomarkers 2–4. In addition, transcriptome analysis of the saliva from pSS patients and HCs revealed differences in mRNA expression levels 3.
The results of these previous studies did not completely clarify the molecular pathogenesis of pSS, in part because changes observed in the transcriptome and proteome do not always correspond to phenotypical alterations in disease. However, it is possible that the metabolites produced in a given biological system, referred to as the ‘metabolome’, reflect the phenotype more accurately. Thus, metabolomics represents an important complementary approach for assessing the molecular mechanisms involved in disease pathogenesis 5.
Salivary metabolomics analyses have yielded results for various oral diseases, such as oral cancer and periodontal disease 6,7, as well as other types of cancer 8. However, the metabolomics analysis of the saliva from pSS patients has not been reported. Here, we performed a comparative analysis of the metabolite levels in salivary samples from pSS patients and HCs.
Methods
Subjects and sample collection
This study was approved by the ethics committee at Kobe University Graduate School of Medicine. We obtained written informed consent from all of the study subjects, and treated human samples in accordance with the guidelines of Kobe University Hospital. Fourteen female pSS patients, who met the revised American–European Consensus Group (AECG) classification criteria for pSS 9, were enrolled into this study at Kobe University Hospital. Twenty-one age- and sex-matched healthy volunteers, who did not have sicca symptoms, served as HCs. All the study participants were Japanese and non-smokers. Unstimulated whole saliva samples were collected by having the participants spit for 15 min into a container at about 10 a.m. The subjects were also requested to refrain from eating for 2 h prior to saliva collection and to rinse their mouth with water prior to sample collection. The sample volumes were measured after centrifugation at 1500g for 15 min at 4°C, and then the samples were frozen immediately and stored at −80°C until analysis.
Analysis of pSS clinical parameters
Analyses for the presence of anti-nuclear antibody (ANA), rheumatoid factor (RF), anti-Ro antibody, and anti-La antibody were performed at Kobe University Hospital. Other clinical data were collected from the patients’ medical records.
Salivary metabolomics analysis
Salivary metabolomics analysis was performed as described elsewhere 10. Briefly, 50 microlitres of saliva were mixed with 250 μl of a solvent mixture (MeOH : H2O : CHCl3 = 2.5 : 1 : 1) containing 10 μl of 1·0 mg/ml 2-isopropylmalic acid (Sigma-Aldrich, Tokyo, Japan) solution, which served as an internal standard, then the solution was incubated for 30 min at 37°C before being centrifuged at 22100g for 5 min at 4°C. Two hundred and twenty-five microlitres of the resultant supernatant were mixed. After being mixed, the solution was centrifuged at 22100g for 5 min at 4°C, and 250 μl of the resultant supernatant were lyophilized using a freeze dryer. For oximation, 40 μl of 20 mg/ml methoxyamine hydrochloride (Sigma-Aldrich) dissolved in pyridine were mixed with a lyophilized sample. Next, 20 μl of N-methyl-N-trimethylsilyltrifluoroacetamide (MSTFA) (GL Science, Tokyo, Japan) were added for derivatization. The derivatized samples were then centrifuged to remove debris, and the clear supernatants were transferred into vials for gas chromatography–mass spectrometry (GC-MS) analysis.
The GCMS-QP2010 Ultra (Shimadzu Co., Kyoto, Japan) system was used with a fused silica capillary column (CP-SIL 8 CB low bleed/MS; 30 m × 0·25 mm inner diameter; 0·25 μm film thickness; Agilent Co., Palo Alto, CA, USA). The front inlet temperature was 230°C. The helium gas flow rate through the column was 39·0 cm/s. The column temperature was held at 80°C for 2 min, increased incrementally (15°C/min) to 330°C, and maintained at that temperature for 6 min. The samples (1-μl injection volume) were injected in split mode with a split ratio of 1 : 25. The transfer line and ion-source temperatures were 250°C and 200°C, respectively. Twenty scans per second were recorded over a mass range of 85–500 m/z using the Advanced Scanning Speed Protocol (ASSP; Shimadzu Co.). MS data were exported in netCDF format, and the peaks were detected and aligned using MetAlign software (Wageningen UR, the Netherlands). The resulting data were exported as a CSV-format file and analysed using in-house analytical software (AI output), by which peaks were identified and quantified using an in-house metabolite library. For quantification, the peak height of each ion was calculated and normalized to the peak height of 2-isopropylmalic acid.
The data set for the multiple classification analysis was compiled from the metabolite profiling results, and principal component analysis (PCA) was performed using the commercially available SIMCA-P software version 12·0·1 (Umetrics, Umea, Sweden).
Data are expressed as the mean ± standard error (s.e.). Statistical significance was analysed using the Welch's t-test, and P-values ≤ 0·05 were defined as statistically significant.
Results
The demographic and clinical features of the study subjects are summarized in Table1. The subjects consisted of 12 pSS patients and 21 age-matched healthy controls, all of whom were female. As expected, the saliva volumes of the pSS patients were significantly smaller than those of the HCs. Those pSS patients with severely diminished salivary function resulting in saliva volumes that were too small to undergo metabolomics analysis were not included in the study. All the pSS patients who were included into the study had either ocular and/or oral symptoms, and all were positive for one or more autoantibodies. The minor salivary glands were biopsied in five of the 14 pSS patients. Four of the pSS patients had a history of major salivary glanditis, three of which occurred in the parotid gland and one in the sublingual gland.
Table 1.
Characteristics of the study participants
| pSS | Healthy control | ||
|---|---|---|---|
| Number (female) | 12 (12) | 21 (21) | |
| Age | 44·4 ± 13·0 | 46·7 ± 10·24 | P = 0·57 |
| Salivary volume (ml/15 min) | 0·97 ± 1·15 | 5·67 ± 3·37 | P < 0·0001 |
| Disease duration (years) | 6·2 ± 6·2 | ||
| Oral dryness | 11/12 | ||
| Ocular dryness | 8/12 | ||
| Anti SS-A/Ro antibody positivity | 12/12 | ||
| Anti SS-B/La antibody positivity | 2/12 | ||
| ANA positivity | 11/12 | ||
| RF positivity | 2/9 | ||
| Hypergammaglobulinaemia | 6/12 | ||
| Greenspan's focus score > 3 | 2/5 | ||
| Major salivary glanditis | 4/12 |
pSS = primary Sjögren's syndrome; ANA = anti-nuclear antibody; RF = rheumatoid factor.
We identified a total of 88 metabolites across the study subjects, as well as 2-isopropylmalic acid, which was used as an internal control in the GC-MS-based metabolomics analysis system. Five metabolites (2-hydroxypyridine, 5-aminovaleric acid, lactic acid, phosphate, and urea) were too abundant to quantify using our GC-MS system and were omitted from the analysis. As there were significant differences in the saliva volumes of the pSS patients and healthy controls we calculated the total amount of each metabolite present per sample, allowing us to compare the salivary metabolite production among the study participants during the 15-min collection period. The 83 metabolites analysed are listed in Supporting information, Table S1. The levels of 41 of the metabolites were reduced significantly in the pSS patients compared to HCs (Supporting information, Table S1).
PCA score plot analysis showed that the pSS patient scores formed a cluster, whereas the HC scores were scattered (Fig. 1a). This finding suggested that the salivary metabolites present in the pSS group exhibited reduced diversity compared to those of the HC group. The decrease in glycine, tyrosine, uric acid and fucose contributed to the loss of biodiversity in the pSS versus HC salivary samples (Fig. 1b).
Figure 1.
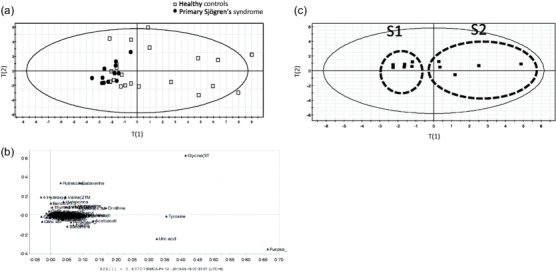
Principal component analysis (PCA) analysis of salivary metabolites. (a) Plot analysis of healthy controls (HC) (◻) and primary Sjögren's syndrome (pSS) (●) PCA scores (PC1 = 0·431, PC2 = 0·192). (b) Loading plot from the PCA analysis comparing salivary metabolite production differences between pSS patients and HCs. (c) PCA analysis of pSS patient scores revealed the presence of two distinct pSS subgroups (PC1 = 0·333, PC2 = 0·297).
PCA analysis of the pSS patient population revealed the presence of two subpopulations (S1 and S2), which exhibited different metabolite profiles (Fig. 1c, Table2).
Table 2.
Clinical characteristics of the primary Sjögren's syndrome (pSS) patients S1 and S2 subgroups
| S1 | S2 | ||
|---|---|---|---|
| Number (female) | 6 (6) | 6 (6) | |
| Age | 37·5 ± 8·7 | 51·33 ± 13·5 | P = 0·082 |
| Volume of saliva (ml/15 min) | 1·35 ± 1·34 | 0·95 ± 0·45 | n.s. |
| Disease duration | 7·3 ± 7·0 | 5·0 ± 5·6 | n.s. |
| Oral dryness | 5/6 | 6/6 | n.s. |
| Ocular dryness | 4/6 | 5/6 | n.s. |
| Anti SS-A/Ro antibody positivity | 6/6 | 6/6 | n.s. |
| Anti SS-B/La antibody positivity | 1/6 | 1/6 | n.s. |
| ANA positivity | 5/6 | 6/6 | n.s. |
| RF positivity | 0/4 | 2/5 | n.s. |
| Hypergammaglobulinaemia | 2/6 | 4/6 | n.s. |
| Greenspan's focus score > 3 | 1/3 | 1/2 | n.s. |
| Major salivary gland glanditis | 0/6 | 4/6 | P = 0·014 |
ANA = anti-nuclear antibody; RF = rheumatoid factor; n.s. = not significant.
The patients of subgroup S2 tended to be older than those in S1 (P = 0·082). There were no significant differences in saliva volume, disease duration or autoantibody positivity between the two subgroups. Notably, however, the prevalence of major salivary glanditis was different in the two subgroups (Table2), and the glycine levels were also different between these two groups (data not shown).
Discussion
The pSS classification criteria from both the American–European Consensus Group (AECG) 9 and the American College of Rheumatology (ACR) 11 are based on the presence of symptoms and serum autoantibodies, and on pathological findings from labial salivary gland biopsies. As there are only three types of ACR criteria and a pSS diagnosis requires positive scores on at least two of them, the diagnostic criteria may place increased importance on the labial salivary gland biopsy, which is an invasive procedure. Salivary proteomics were applied recently to identify biomarker candidates for the diagnosis of pSS using a non-invasive procedure 3,4,12,13. A recent report described the development of a four-component biomarker signature consisting of clusterin, interleukin (IL)-5, fibroblast growth factor 4 and IL-4, which classified successfully 93·8% of patients with pSS and 100% of non-pSS individuals 13.
To our knowledge, there have been no published papers describing salivary metabolomics in pSS, despite the development of salivary proteomics. Salivary metabolomics has been used in the analysis of several diseases, and various disease-specific biomarkers have been discovered 1. In this study, we analysed the metabolite profiles of the whole saliva from 14 pSS patients. Of the 83 metabolites found to be produced over a 15-min period from the salivary glands, 41 were decreased significantly in pSS patients, most probably reflecting salivary gland damage. These findings were supported further by our PCA analysis, which revealed that the salivary samples from pSS patients had less biological diversity than those from HCs.
PCA analysis of the group of pSS patients showed that a history of major salivary glanditis affected the salivary metabolite profiles. Approximately one-quarter of pSS patients exhibit enlarged parotid or submandibular glands during the course of their disease 14, and parotid gland enlargement increases the risk of lymphoma development in these patients 15. The effect of major salivary glanditis on the contents of saliva has not been studied thoroughly. Our finding that salivary glanditis was correlated with metabolite changes indicates that metabolomics findings can reflect disease phenotypes.
Many omics analyses (i.e. genomics, transcriptomics, proteomics) have been performed to examine the pathogenesis and/or identify biomarkers for diseases. The pathogenesis of pSS, which is caused by a combination of genetic and environmental factors, is complex. The integration of omics analyses, especially metabolomics, which is the last step of the omics cascade, and clinical data are promising tools for elucidating the pathogenesis of pSS and other diseases.
Conclusion
Here we have shown that salivary metabolite production was decreased and less diverse in pSS patients, compared to healthy controls. Our finding that salivary metabolite profiles were affected by a history of major salivary glanditis suggests that salivary metabolomics has the potential to uncover prospective biomarkers, which could serve as diagnostic tools for pSS and/or as research tools for probing the underlying pathogenesis of this disease.
Acknowledgments
G. K. conceived the study and was involved in the overall study design and data acquisition and analysis and drafted the manuscript. S. T. contributed data acquisition and analysis. S. S. and K. T. contributed sample collection. Y. I. provided critical input on experimental design and data interpretation. J. S. and A. M. participated in its design, and helped draft the manuscript. All authors helped to critically revise the intellectual content of the manuscript and approved the final submission. This study was carried out by the authors without external funding.
Disclosure
The authors declare that they have no competing interests. The authors declare no support from any institution for the submitted work, no financial relationships with any institutions that might have an interest in the submitted work in the previous 3 years, and no other relationships or activities that could appear to have influenced the submitted work.
Supporting Information
Additional Supporting information may be found in the online version of this article at the publisher's web-site:
Table S1. Comparison of the salivary metabolites in primary Sjögren's syndrome (pSS) patients and healthy controls (HCs).
References
- Zhang A, Sun H, Wang X. Saliva metabolomics opens door to biomarker discovery, disease diagnosis, and treatment. Appl Biochem Biotechnol. 2012;168:1718–27. doi: 10.1007/s12010-012-9891-5. [DOI] [PubMed] [Google Scholar]
- Ryu OH, Atkinson JC, Hoehn GT, Illei GG, Hart TC. Identification of parotid salivary biomarkers in Sjogren's syndrome by surface-enhanced laser desorption/ionization time-of-flight mass spectrometry and two-dimensional difference gel electrophoresis. Rheumatology (Oxf) 2006;45:1077–86. doi: 10.1093/rheumatology/kei212. [DOI] [PubMed] [Google Scholar]
- Hu S, Wang J, Meijer J, et al. Salivary proteomic and genomic biomarkers for primary Sjogren's syndrome. Arthritis Rheum. 2007;56:3588–600. doi: 10.1002/art.22954. [DOI] [PMC free article] [PubMed] [Google Scholar]
- Baldini C, Giusti L, Ciregia F, et al. Proteomic analysis of saliva: a unique tool to distinguish primary Sjogren's syndrome from secondary Sjogren's syndrome and other sicca syndromes. Arthritis Res Ther. 2011;13:R194. doi: 10.1186/ar3523. [DOI] [PMC free article] [PubMed] [Google Scholar]
- Villas-Boas SG, Mas S, Akesson M, Smedsgaard J, Nielsen J. Mass spectrometry in metabolome analysis. Mass Spectrom Rev. 2005;24:613–46. doi: 10.1002/mas.20032. [DOI] [PubMed] [Google Scholar]
- Wei J, Xie G, Zhou Z, et al. Salivary metabolite signatures of oral cancer and leukoplakia. Int J Cancer. 2011;129:2207–17. doi: 10.1002/ijc.25881. [DOI] [PubMed] [Google Scholar]
- Barnes VM, Ciancio SG, Shibly O, et al. Metabolomics reveals elevated macromolecular degradation in periodontal disease. J Dent Res. 2011;90:1293–7. doi: 10.1177/0022034511416240. [DOI] [PubMed] [Google Scholar]
- Sugimoto M, Wong DT, Hirayama A, Soga T, Tomita M. Capillary electrophoresis mass spectrometry-based saliva metabolomics identified oral, breast and pancreatic cancer-specific profiles. Metabolomics. 2010;6:78–95. doi: 10.1007/s11306-009-0178-y. [DOI] [PMC free article] [PubMed] [Google Scholar]
- Vitali C, Bombardieri S, Jonsson R, et al. Classification criteria for Sjogren's syndrome: a revised version of the European criteria proposed by the American–European Consensus Group. Ann Rheum Dis. 2002;61:554–8. doi: 10.1136/ard.61.6.554. [DOI] [PMC free article] [PubMed] [Google Scholar]
- Nakamizo S, Sasayama T, Shinohara M, et al. GC/MS-based metabolomic analysis of cerebrospinal fluid (CSF) from glioma patients. J Neurooncol. 2013;113:65–74. doi: 10.1007/s11060-013-1090-x. [DOI] [PMC free article] [PubMed] [Google Scholar]
- Shiboski SC, Shiboski CH, Criswell L, et al. American College of Rheumatology classification criteria for Sjogren's syndrome: a data-driven, expert consensus approach in the Sjogren's International Collaborative Clinical Alliance cohort. Arthritis Care Res (Hoboken) 2012;64:475–87. doi: 10.1002/acr.21591. [DOI] [PMC free article] [PubMed] [Google Scholar]
- Fleissig Y, Deutsch O, Reichenberg E, et al. Different proteomic protein patterns in saliva of Sjogren's syndrome patients. Oral Dis. 2009;15:61–8. doi: 10.1111/j.1601-0825.2008.01465.x. [DOI] [PubMed] [Google Scholar]
- Delaleu N, Mydel P, Kwee I, Brun JG, Jonsson MV, Jonsson R. High fidelity between saliva proteomics and the biologic state of salivary glands defines biomarker signatures for primary Sjogren's syndrome. Arthritis Rheumatol. 2015;67:1084–95. doi: 10.1002/art.39015. [DOI] [PubMed] [Google Scholar]
- Ehrlich GE. Kelley's textbook of rheumatology, 6th edn. JAMA. 2002;287:117–18. [Google Scholar]
- Baimpa E, Dahabreh IJ, Voulgarelis M, Moutsopoulos HM. Hematologic manifestations and predictors of lymphoma development in primary Sjogren syndrome: clinical and pathophysiologic aspects. Medicine (Balt) 2009;88:284–93. doi: 10.1097/MD.0b013e3181b76ab5. [DOI] [PubMed] [Google Scholar]
Associated Data
This section collects any data citations, data availability statements, or supplementary materials included in this article.
Supplementary Materials
Table S1. Comparison of the salivary metabolites in primary Sjögren's syndrome (pSS) patients and healthy controls (HCs).