Abstract
The antibacterial properties of silver are strongly controlled by the redox couple of silver/silver(I). This work reports the influence of phosphate anions on silver nanoparticle oxidation, which is important given the abundance of phosphate species in biological systems. The three different species of anions were found to have a varying degree of influence on silver oxidation with the order PO43−>HPO42−>H2PO4−. It was found that in the presence of phosphate anions, the silver oxidation potential shifts to a less positive value, which indicated the increasing ease of the oxidation reaction of silver. Given that the interplay between silver and its cation is crucial to its antibacterial properties and significant concentrations of the HPO42− anion are present at biological pH (near neutral), it is essential that the influence of the dibasic anion (HPO42−) on silver oxidation dynamics be considered for biological systems.
Keywords: electrochemistry, ion–silver interactions, nanoparticles, phosphate, silver
With the rise of nanotechnology, many researchers have studied the antibacterial properties of silver nanoparticles.1 However, the exact mechanism of its antibacterial function has led to many discussions and hypotheses.2 It has been claimed that the natural attachment of silver onto the cell membrane disrupts the cell's electron transfer processes.2b-3 Alternatively, others developed the theory where silver is oxidised to silver(I) ion in the environment, and the ion subsequently attaches itself onto the thiol groups present on cell membrane receptors, leading to cell signalling failure and hence cell death.3 The interplay of silver and silver(I) ion influences the antibacterial properties.2b-3 Thus, the dissolution of silver is one of the crucial processes studied to further understand its antibacterial activity. Research has shown that the rate of mass transport to and from the surface is enhanced as the size of the particles reaches the nanoscale, leading to the possible release of higher-energy intermediates.4 As the silver ions diffuse away after formation, it is expected that the rate of silver dissolution increases as the nanoparticle size decreases.5 Apart from the physical properties of the silver nanoparticle which may affect its dissolution, the surrounding environment is also important. Previous electrochemical studies on silver–halide interactions have shown that silver oxidation is favoured in the presence of halide ions such as chloride and iodide ions.6 This is evident by a decrease in the voltammetric peak potential with increasing halide concentration at similar silver surface coverage, signifying the increased ease of silver dissolution in presence of halides.6
In this work, we consider the role of phosphate anions, which complex with silver to give many possible species (e.g. AgPO3, Ag3PO4, Ag2HPO4, Ag4P2O7, and AgxNa1−xPO3).7 Silver phosphate, Ag3PO4, is known to have a strong formation constant of 8.89×10⁻¹⁷ mol4 dm−12.8 Phosphate is commonly found in the environment and various biological systems.9 In the human body, around 1.9 to 3.8 mg of inorganic phosphate can be found in every 100 mL of blood.9a In human sweat, phosphate ion concentrations ranging from 23 μm to 1 mm have been detected.9b Bodies of water, such as rivers and lakes, may contain phosphate ion concentrations of 0.1 μm to 1 μm.9c With phosphate's significant presence in biological systems, we pose the question as to whether the silver–phosphate interaction can have any influence on the silver dissolution process and, hence, the antibacterial properties of silver?
In this work, we study the impact of phosphate anions on silver oxidation. Silver nanoparticle oxidation dynamics in the presence and absence of phosphate ions is probed through electrochemical techniques. In the control experiments, silver is oxidised in sodium nitrate to determine its behaviour in the absence of phosphate ions. Then, silver is oxidised in three different electrolytes of NaH2PO4, Na2HPO4, and Na3PO4 to determine if the different species of phosphate ions influence the silver oxidation dynamics. Silver-nanoparticle-modified glassy carbon electrodes of similar silver surface coverages are used for all experiments for the reason explained below.
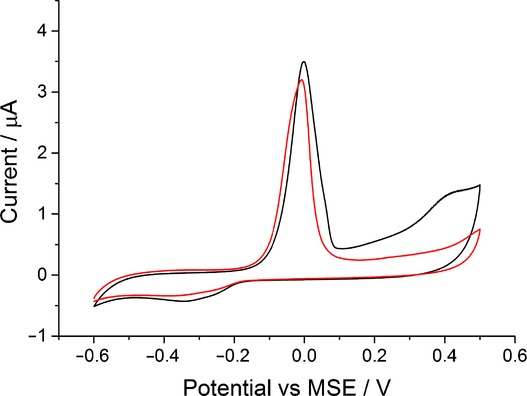
In order to ensure information on silver oxidation is easily obtained, a silver-nanoparticle-modified glassy carbon electrode is used instead of a silver macro electrode. As seen in Figure 1 (black line), in the absence of phosphate ions, a silver macro electrode oxidised in sodium nitrate gives a large current that increases indefinitely. However, with a silver-nanoparticle-modified electrode, a clear silver oxidation signal is seen at 0 V versus mercury/mercurous sulfate reference electrode (MSE) because the amount of silver is limited.10 Therefore, all experiments are performed with silver-nanoparticle-modified electrodes with similar silver coverages to ensure the ease of determining the silver oxidation peak potential. With the information on oxidation potential, the influence of phosphates on silver oxidation can be studied. In addition, the usage of silver nanoparticles also ensures a large surface area for silver–phosphate interaction to take place.
Figure 1.
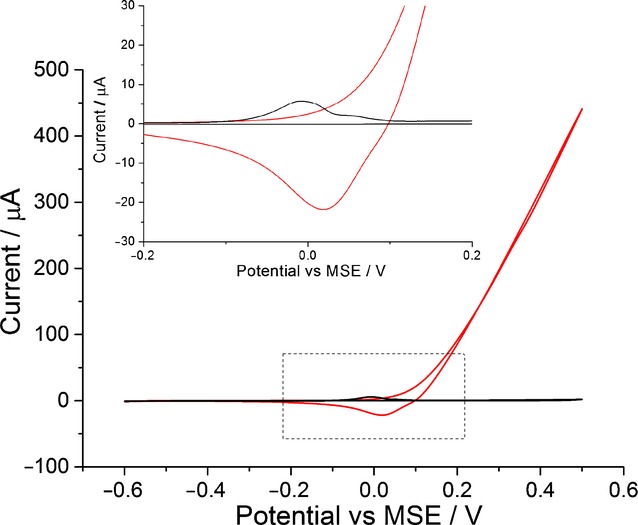
The oxidation of silver in 0.1 m NaNO3 at a scan rate of 0.05 V s−1. Black: Silver-nanoparticle-modified glassy carbon electrode. Red: A silver macro electrode. Inlay: A close up of the voltammogram.
To consider the influence of various phosphate ions on silver oxidation, knowledge of the equilibrium concentrations of the three phosphate species (H2PO4−, HPO42−, and PO43−) in each solution under study is essential. Therefore, the pH of each phosphate solution (NaH2PO4, Na2HPO4, and Na3PO4 in various concentrations) was measured, and the equilibrium concentrations were calculated from the total phosphate concentration, the pH, and the dissociation constants of phosphoric acid.11 (See Table S1 in the Supporting Information) In most Na3PO4 solutions, the PO43− ion prevails, but the concentration of the HPO42− ion is of the same order and should be taken into account; the concentration of the H2PO4− ion is negligible. In Na2HPO4 solutions, hydrogen phosphate (HPO42−) is the dominant species, but content of PO43− and H2PO4− ions is also substantial. NaH2PO4 solution is characterised by insignificant contributions from the PO43− ion and a high concentration of dihydrogen phosphate (H2PO43−). Thus, these three sets of solutions allow us to investigate the electrochemical system in three different pH ranges and to study the influence of three phosphate species on silver oxidation dynamics.
First, the behaviour of silver nanoparticles in trisodium phosphate solutions (Na3PO4) was studied. A voltammogram was recorded in 0.0125 m solution of Na3PO4 containing 0.0875 m NaNO3. As can be seen from the red line of Figure 2, the silver oxidation peak shifted negatively as compared with the control experiment in the absence of any phosphate ions (black line of Figure 2). The voltammetric signal obtained in the absence of phosphate ions (black line) corresponds to silver oxidation to its cation, Ag+.6a The experiment was repeated using solutions of higher Na3PO4 concentrations.
Figure 2.
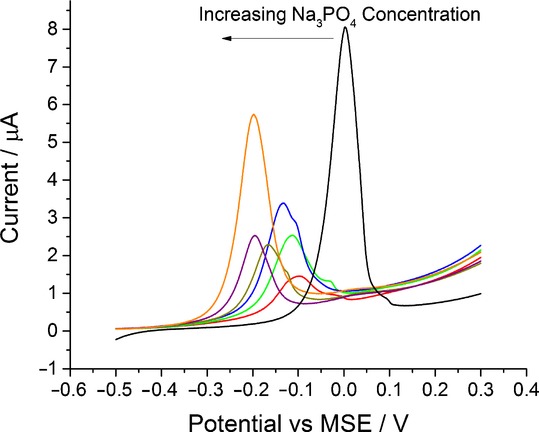
A close up of cyclic voltammogram representing the oxidation of silver nanoparticles on a glassy carbon electrode at a scan rate of 0.05 V s−1. Black: scan in 0.1 m NaNO3. Red: 0.0125 m Na3PO4 and 0.0875 m NaNO3. Green: 0.025 m Na3PO4 and 0.075 m NaNO3. Blue: 0.05 m Na3PO4 and 0.05 m NaNO3. Dark yellow: 0.1 m Na3PO4. Purple: 0.2 m Na3PO4. Orange: 0.3 m Na3PO4. Each data point consists of a minimum of three repeats.
As seen in Figure 2, the increase in Na3PO4 concentration leads to a notable cathodic shift of the oxidation peak potential. It is likely caused by the formation of a complex between silver and phosphate ions. This complexation favours the silver oxidation process thus decreasing the oxidation potential. The assumption about the complex formation can also be supported by the shape of oxidation peaks observed at low phosphate concentrations (red, green, and blue lines of Figure 2). The splitting of the peaks can be understood in terms of insufficient amount of phosphate ions adjacent to the electrochemical interface, leading to two voltammetric signals which correspond to silver complex and silver ion formation; this is similar to the case of silver oxidation in the presence of chloride ions.6a
In order to understand the nature of the complex formed, the dependences of the peak potential on the negative common logarithm of equilibrium concentrations of phosphate ion species were studied. As we can neglect the concentration of H2PO4− ion in Na3PO4 solutions, it was sensible to investigate the oxidation peak potential shift observed in Figure 2 as a function of −log[PO43−] and −log[HPO42−]. Figure 3 shows that the peak potential varies linearly with an increase of [PO43−] at a slope of 68±5 mV/decade with r2=0.973 and at a slope of 100±5 mV/decade (r2=0.987) with increasing [HPO42−].
Figure 3.
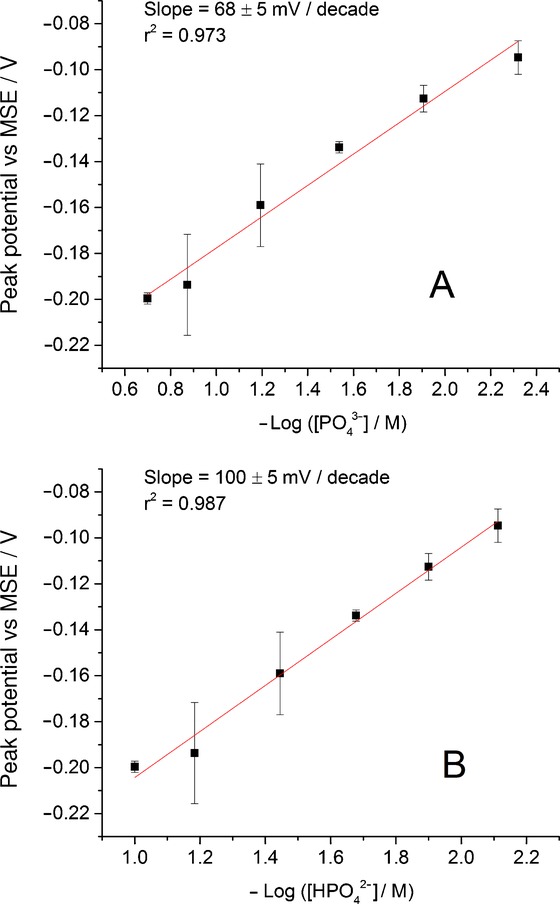
Variation in the peak potential for the oxidation of silver nanoparticles as a function of negative common logarithm of equilibrium concentration of PO43− ion (A) and HPO42− ion (B) in Na3PO4 solutions. Values represent the mean ±S.E.M. of n=3 measurements.
The obtained slope value in the case of PO43− ions is close to the Nernstian response. This allows us to suggest that the oxidation process can possibly be described as a one-to-one reaction of the Ag+ with the PO43− following the electrochemical step. Hence, it is unlikely that silver phosphate (Ag3PO4) is the main initial product in this study. However, given the wide variety of silver–phosphate complexes that are possible, the complexation ratio of one silver to one phosphate is plausibly the initial product.
From Figure 2, it should be noted that dependences of the oxidation peak area, or the charge, on phosphates concentration are irregular. This is likely due to the insufficient reproducibility of the glassy carbon electrode modification by means of the drop-casting technique. Therefore, in the present study, we do not consider the variation in the oxidation peak area or height.
Next, the influence of the HPO42− anion on silver oxidation dynamics was examined. Cyclic voltammograms were recorded in 0.1 m, 0.2 m, and 0.3 m disodium hydrogen phosphate (Na2HPO4) solutions. Figure 4 summarizes the results, and it is seen that only a slight cathodic shift of silver oxidation peak potential can be noted with increasing Na2HPO4 concentration.
Figure 4.
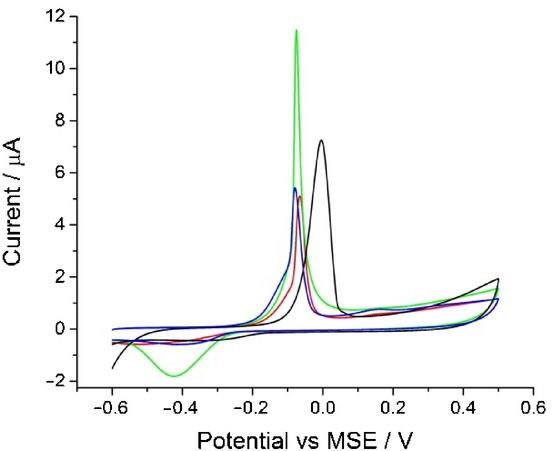
The oxidation of silver nanoparticles on a glassy carbon electrode at a scan rate of 0.05 V s−1. Black: scan in 0.1 m NaNO3. Red: 0.1 m Na2HPO4. Green: 0.2 m Na2HPO4. Blue: 0.3 m Na2HPO4. Each data point consists of a minimum of three repeats.
The plots of peak potential against −log[phosphate species] are depicted in Figure S1 in the Supporting Information. In this case, the obtained gradient values are 48±5 mV/decade and 32±3 mV/decade for [PO43−] and [HPO42−], respectively. These values are lower than those for Na3PO4 solutions. The calculated slope values indicate that HPO42− ions have a less significant influence compared to the tribasic ion.
For the H2PO4− anion, its influence on silver oxidation dynamics is negligible. This can be observed from the voltammetric data obtained in 0.1 m solution of NaH2PO4 and presented in Figure 5. Despite a high concentration of dihydrogen phosphate ions (H2PO43−) and considerable content of hydrogen phosphates (HPO42−) (see Table S1 in the Supporting Information), the oxidation peak potential remained constant. This is likely due to the insignificant concentration of PO43− ions in solution. Thus, it can be concluded that PO43− ion has the strongest effect on silver oxidation dynamics among the three species.
Figure 5.
The oxidation of silver nanoparticles on a glassy carbon electrode in 0.1 m NaNO3 (black) and 0.1 m NaH2PO4 (red) at a scan rate of 0.05 V s−1. Each data point consists of a minimum of three repeats.
Another way to reveal which ions affect the silver oxidation process to the greatest extent is to compare oxidation peak potentials observed on voltammograms recorded in different solutions with approximately equal equilibrium concentrations of various phosphate species. The extracted data are summarised in Table S2 in the Supporting Information. Considering solutions of nearly the same concentrations of PO43− and HPO42− ions about 0.2 m and 0.0002 m, it can be noted that the presence of PO43− ion in both cases shifts the oxidation peak potential in the negative direction more effectively than the same content of HPO42− ion. In case of 0.1 m solutions of phosphate ions, it seems that HPO42− ion strongly influences the oxidation process. However, taking into account the values of confidence interval, the shift in peak potentials observed in 0.2 m and 0.3 m of Na3PO4 solutions can be interpreted as equal.
The obtained results allow us to conclude that the tribasic ion PO43− has a greater influence on silver oxidation compared with its counterparts. The dibasic ion HPO42− is likely to influence the silver oxidation process as well, though to a lesser extent than tribasic PO43−. Complex formation between silver(I) and phosphate during the silver nanoparticle oxidation process in an alkaline medium likely leads to the cathodic shift of oxidation potential, that is, to the facilitation of silver oxidation. At biological pH (near neutral), insignificant concentrations of the PO43− ion would be present; rather, the main ion present would be the dibasic ion of HPO42−. Thus, in biological systems, the influence of the dibasic anion (HPO42−) on silver oxidation dynamics must be considered.
Experimental Section
Chemicals: Na3PO4⋅12 H2O (98 %) was received from May and Baker, Dagenham, UK. AgNO3 (>99 %), NaBH4 (99 %), Na2HPO4 (>99 %), and NaH2PO4⋅2 H2O (≥99 %) were ordered from Sigma–Aldrich, Dorset, UK. Fisons Scientific Equipment, Loughborough, UK, supplied NaNO3 (>99.5 %). Trisodium citrate (Na3C6H5O7, >99 %,) was supplied by BDH Laboratory Supplies, Poole, UK. Concentrated HNO3 (>70 %) and concentrated HCl (∼37 %) were supplied by Fisher Scientific, Loughborough, UK. Ultrapure water from Millipore with resistivity not less than 18.2 MΩ⋅cm was used to prepare all solutions.
Nanoparticle synthesis and characterisation: Citrate-capped silver nanoparticles were synthesised using the following method:12 First, seeds were grown by adding 1 % (w/v) citrate solution (20 mL) and water (75 mL) in a round-bottom flask heated to 70 °C for 15 min. In quick succession, 1 % (w/v) HNO3 solution (1.7 mL) and 0.1 % (w/v) freshly prepared NaBH4 solution (2 mL) were added into the reaction mixture. The suspension was kept under vigorous stirring for 1 h at 70 °C before cooling to rt. Water was added to the resulting suspension to give 100 mL of silver nanoparticle seeds. Next, 1 % citrate solution (2 mL) and water (80 mL) were brought to a boil for 15 min. Seed solution (10 mL) was added into the reaction mixture. 1 % AgNO3 solution (1.7 mL) was added to the mixture and held at reflux with vigorous stirring for 1 h before cooling to rt. The resulting silver nanoparticle suspension was brought to a volume of 100 mL with water, to give a total silver concentration of 1.1 mm in the suspension. All glassware was cleaned thoroughly with aqua regia (a mixture of concentrated HCl and HNO3, 3:1) prior to silver nanoparticle synthesis. The silver nanoparticles are sized electrochemically via ‘nano-impacts’ and found to have a radius of 10.9±1.9 nm (for details, see the section entitled “Anodic particle coulometry” in the Supporting Information)
Voltammetry: A three-electrode system in a Faraday cage was controlled by a μAutolab III (Metrohm-Autolab BV, Utrecht, The Netherlands) for the electrochemical experiments. A glassy carbon electrode of 3.0 mm diameter (CH instruments, Austin, USA) was used as the working electrode. The electrode was polished to a mirror finish on diamond sprays from Kemet (Kent, UK) in the size sequence of 3.0 μm, 1.0 μm, and 0.1 μm. A standard MSE (mercury/mercurous sulfate reference electrode [Hg/Hg2SO4, K2SO4 (saturated)], +0.62 V vs standard hydrogen electrode) was obtained from BASi (West Lafayette, USA).11 A platinum mesh (99.99 %) was supplied from Goodfellow Cambridge Ltd, Huntingdon, UK. All electrochemical measurements were thermostated at 25±1 °C.
Silver-nanoparticle-modified glassy carbon electrode: The silver nanoparticle suspension was diluted with ultrapure water by a factor of 10 and contained a total concentration of 0.11 mm of silver. The working electrode was drop cast with 3 μL of the diluted nanoparticle suspension and dried under nitrogen flow. The nanoparticle-modified electrode was used for electrochemical experiments immediately. Cyclic voltammetry was swept starting from −0.6 V versus MSE to +0.5 V and then reductively back to −0.6 V to perform the electrochemical experiments. Each experiment was performed three times.
UV/Vis spectroscopy: A UV/Vis spectrometer (U-2001, Hitachi, Mannheim, Germany) was used to perform the spectroscopy scan of a wavelength from 700 nm to 250 nm at a scan rate of 400 nm min−1. The two light sources of tungsten iodide and deuterium gave the required wavelength. For UV/Vis analysis, the nanoparticle suspension was diluted by a factor of 24 for the measurement, and a signal was observed at 393 nm, indicating the presence of silver nanoparticles in the suspension (see Figure S2 in the Supporting Information).13
Acknowledgments
D. V. N. is supported by Saint Petersburg State University (grant no. 12.42.1266.2014 and 12.38.219.2015). H. S. T. is supported by the National Research Foundation (NRF), Singapore under its Environmental and Water Technologies (EWT) PhD Scholarship Programme and administered by the Environment and Water Industry Programme Office (EWI). The research leading to these results has received partial funding (C. B. M. and R. G. C.) from the European Research Council under the European Union's Seventh Framework Programme (FP/2007–2013)/ERC Grant Agreement no. [320403].
Supporting Information
As a service to our authors and readers, this journal provides supporting information supplied by the authors. Such materials are peer reviewed and may be re-organized for online delivery, but are not copy-edited or typeset. Technical support issues arising from supporting information (other than missing files) should be addressed to the authors.
Supplementary
References
- 1a.Nowack B, Krug HF, Height M. Environ. Sci. Technol. 2011;45:1177–1183. doi: 10.1021/es103316q. [DOI] [PubMed] [Google Scholar]
- 1b.Ruparelia JP, Chatterjee AK, Duttagupta SP, Mukherji S. Acta. Biomater. 2008;4:707–716. doi: 10.1016/j.actbio.2007.11.006. [DOI] [PubMed] [Google Scholar]
- 1c.Vaseeharan B, Ramasamy P, Chen JC. Lett. Appl. Microbiol. 2010;50:352–356. doi: 10.1111/j.1472-765X.2010.02799.x. [DOI] [PubMed] [Google Scholar]
- 1d.Suresh AK, Pelletier DA, Wang W, Moon JW, Gu B, Mortensen NP, Allison DP, Joy DC, Phelps TJ, Doktycz MJ. Environ. Sci. Technol. 2010;44:5210–5215. doi: 10.1021/es903684r. [DOI] [PubMed] [Google Scholar]
- 2a.Liu J, Sonshine DA, Shervani S, Hurt RH. ACS Nano. 2010;4:6903–6913. doi: 10.1021/nn102272n. [DOI] [PMC free article] [PubMed] [Google Scholar]
- 2b.Su H-L, Chou C-C, Hung D-J, Lin S-H, Pao I-C, Lin J-H, Huang F-L, Dong R-X, Lin J-J. Biomaterials. 2009;30:5979–5987. doi: 10.1016/j.biomaterials.2009.07.030. [DOI] [PubMed] [Google Scholar]
- Lapresta-Fernández A, Fernández A, Blasco J. TrAC Trends Anal. Chem. 2012;32:40–59. [Google Scholar]
- Batchelor-McAuley C, Tschulik K, Neumann CCM, Laborda E, Compton RG. Int. J. Electrochem. Sci. 2014;9:1132–1138. [Google Scholar]
- Ma R, Levard C, Marinakos SM, Cheng Y, Liu J, Michel FM, Brown GE, Lowry GV. Environ. Sci. Technol. 2012;46:752–759. doi: 10.1021/es201686j. [DOI] [PubMed] [Google Scholar]
- 6a.Toh HS, Batchelor-McAuley C, Tschulik K, Compton RG. Analyst. 2013;138:4292–4297. doi: 10.1039/c3an00843f. [DOI] [PubMed] [Google Scholar]
- 6b.Toh HS, Tschulik K, Batchelor-McAuley C, Compton RG. Analyst. 2014;139:3986–3990. doi: 10.1039/c4an00741g. [DOI] [PubMed] [Google Scholar]
- 7a.Weast RC, editor. CRC Handbook of Chemistry and Physics 1974–1975, 55th ed. Ohio: CRC Press; 1974. p. 135. [Google Scholar]
- 7b.Hall A, Swenson J, Adams S, Meneghini C. Phys. Rev. Lett. 2008;101:195901. doi: 10.1103/PhysRevLett.101.195901. [DOI] [PubMed] [Google Scholar]
- Lange's Handbook of Chemistry, 15th ed(Ed.: A. Dean. Inc, New York: McGraw-Hill; 1999. [Google Scholar]
- 9a.Havard RE, Reay GA. Biochem. J. 1925;19:882–887. doi: 10.1042/bj0190882. [DOI] [PMC free article] [PubMed] [Google Scholar]
- 9b.Harvey CJ, LeBouf RF, Stefaniak AB. Toxicol. in Vitro Toxicol. In. Vitro. 2010;24:1790–1796. doi: 10.1016/j.tiv.2010.06.016. [DOI] [PubMed] [Google Scholar]
- 9c.Oram B. Phosphates in the Environment. Water Research Center, Dallas, PA (USA); www.water-research.net/index.php/phosphates (accessed: February 4, 2015)
- Toh HS. Batchelor-McAuley C. Tschulik K. Uhlemann M. Crossley A. Compton RG. Nanoscale. 2013;5:4884–4893. doi: 10.1039/c3nr00898c. [DOI] [PubMed] [Google Scholar]
- Weast RC. CRC Handbook of Chemistry and Physics 1974–1975, 55th ed. pp. Florida: CRC Press; 2012. p. 120. [Google Scholar]
- Wan Y, Guo Z, Jiang X, Fang K, Lu X, Zhang Y, Gu N. J. Colloid Interface Sci. 2013;394:263–268. doi: 10.1016/j.jcis.2012.12.037. [DOI] [PubMed] [Google Scholar]
- 13a.Evanoff DD, Jr, Chumanov G. J. Phys. Chem. B. 2004;108:13957–13962. doi: 10.1021/jp0475640. . [DOI] [PubMed] [Google Scholar]
- 13b.Evanoff DD, Jr, Chumanov G. ChemPhysChem. 2005;6:1221–1231. doi: 10.1002/cphc.200500113. . [DOI] [PubMed] [Google Scholar]
Associated Data
This section collects any data citations, data availability statements, or supplementary materials included in this article.
Supplementary Materials
Supplementary


