Abstract
The field of nanoparticle (NP) sizing encompasses a wide array of techniques, with electron microscopy and dynamic light scattering (DLS) having become the established methods for NP quantification; however, these techniques are not always applicable. A new and rapidly developing method that addresses the limitations of these techniques is the electrochemical detection of NPs in solution. The ‘nano-impacts’ technique is an excellent and qualitative in situ method for nanoparticle characterization. Two complementary studies on silver and silver bromide nanoparticles (NPs) were used to assess the large radius limit of the nano-impact method for NP sizing. Noting that by definition a NP cannot be larger than 100 nm in diameter, we have shown that the method quantitatively sizes at the largest limit, the lower limit having been previously reported as ∼6 nm.1
Keywords: nano-impacts, nanoparticles, silver, silver chloride, size
Introduction
The field of nanoparticle (NP) sizing encompasses a wide array of techniques, with electron microscopy and dynamic light scattering (DLS) having become the established methods for NP quantification. These techniques, however, are not always applicable. Electron microscopes are ex situ, have an inherently high cost associated with their operation, and require drying of the sample, which has been shown to promote particle agglomeration.2 Optical techniques such as DLS, whilst in situ, suffer from the inability to characterise polydisperse or optically opaque samples, as well as being challenged by smaller NPs. Nanoparticle tracking analysis (NTA) is an alternative in situ light-scattering technique which tracks individual NPs and can be accurate for sizing both monodisperse and polydisperse samples. The results strongly depend on the skill and judgement of the operator; through the use of different settings the presence of certain particles can be emphasized or ignored, leading to incorrect size distributions.3 NTA relies on the observation of Brownian motion of the individual particles, and due to variation in the distance travelled per unit time, can often lead to an overestimation of the particle size distribution width.4
A new and rapidly developing method that addresses these issues is the electrochemical detection of NPs in solution. Two predominant methods in this area are by catalytic amplification of current by NPs mediating reactions at the electrode5 or by direct quantitative electrolytic oxidation/reduction of the particle.6,7 Both methods involve the stochastic collision of suspended NPs with the electrode surface and thus allow for the characterisation of individual NPs in the solution phase. The former relies on models of transport to permit size analysis but the latter is extremely robust: measurement of impact charge immediately indicates the number of atoms per particle via Faraday's First Law.
Since the initial work on the direct electrolytic characterisation of silver NPs,7 the area has expanded to include a range of nanomaterials including gold,8,9 nickel,10,11 copper,12 iron oxide,13 mercury chloride,14 indigo,15 and poly(N-vinylcarbazole) (PVK).16 The method has also shown to be applicable via the use of various types of electrodes and electrode materials such as carbon7 and gold17 microdisks, carbon fibre microcylinders,18 liquid hemispheres,14 and random microelectrode assemblies (RAMs).19
Despite a large variety of NP materials having now been characterised,20 the limits of this technique with respect to the size of the particle still needs clarification. Recent work has sought to clarify the lower limit of detection, having achieved successful sizing of 6.3 nm diameter silver NPs by minimising background electrical noise.1 However, the important question of how large a NP can be detected is unresolved.
NPs are by definition limited in having at least one dimension between 1–100 nm.21 It is likely that for large enough particle sizes, complete electrochemical consumption of the particle would cease because of diffusional loss of particles from the interface before exhaustive electrolysis. Thus, there is a likely upper limit to the particle size that can be measured by nano-impacts, for which this paper seeks to address. Current literature elicits the applicability of the direct nano-impact technique for NPs approaching 100 nm diameter with work on large organic15,16 and aggregated silver NPs.22 In addition, recent work has resulted in the successful sizing of large nonaggregated metallic NPs on a RAM.19
In this paper, we report the sizing of spherical AgBr NPs using a microdisk electrode; thus reporting the first such application of the nano-impact technique to a silver halide system and demonstrating quantitative sizing at the NP upper limit. We further report the sizing of Ag NPs via impacts building on earlier work19 but reporting the effect of ionic strength and the need for care in this respect in so far as quantitative sizing is required. Ionic strength effects on NP systems may include aggregation/agglomeration but also, as with all dynamic electrochemical measurements, can profoundly influence the interfacial electron transfer.
Results and Discussion
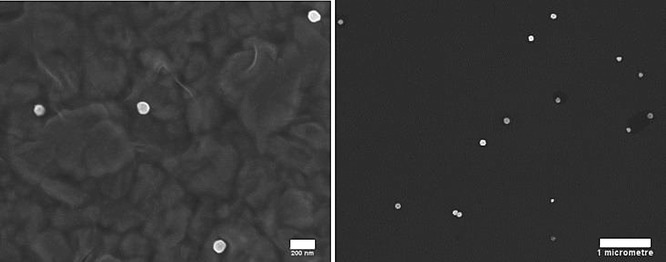
Synthesised AgBr and commercially available Ag NPs were characterised by SEM; Figures 1 and 12 show the images at low and high magnification for AgBr and Ag. AgBr NPs stabilised with gelatine were electrochemically characterised after drop-casting on a glassy carbon (GC) macrodisk and successfully sized by the nano-impact method, showing the ability to size silver halide NPs of high polydispersity through quantitative reduction of colliding particles.
Figure 1.

SEM images of AgBr NPs. Black scale bars: 200 nm (left), 1 μm (right).
Figure 2.
SEM images of Ag NPs showing near-spherical shape of the particles. White scale bars: 200 nm (left), 1 μm (right).
Second, near-spherical citrate-capped silver NPs were characterised using a RAM in low electrolyte concentration to demonstrate the effect of lower ionic strength on sizing of NPs approaching the upper limit of the nanoscale.
Silver bromide NP characterisation
To first establish the electrochemical behaviour of the synthesised AgBr NPs, stripping voltammetry was conducted on a GC macrodisk. Figure 3 shows a cyclic voltammogram (CV) of drop-cast particles, scanning first reductively then oxidatively. No well-defined AgBr reduction peak is apparent; instead, sharp reductive features (spikes) are observed at potentials lower than −0.75 V vs. a saturated mercury sulfate electrode (MSE). This type of voltammetric response has been previously attributed to a nucleation overpotential required for particle reduction14 and can be associated with reduction of AgBr to Ag:
| 1 |
Figure 3.
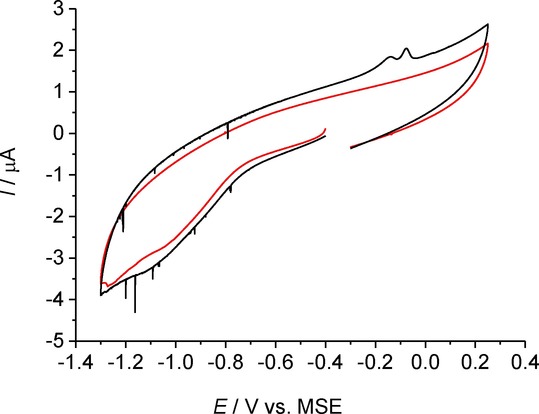
Cyclic voltammetry in 0.10 m NaNO3 at 25 mV s−1. Red: Bare GC macroelectrode. Black: GC macroelectrode drop-cast with 400 pmol AgBr suspension.
The appearance of a double oxidation peak at −0.14 V and −0.08 V on the reverse scan indicates the formation of two oxidation products, most likely AgBr and Ag+:
| 2 |
| 3 |
The formation of both Ag+ and the silver halide during electrochemical silver oxidation has been previous reported and indicates successful reduction of AgBr to Ag in the scanned potential window.23,24 The mixture of oxidation products is most likely caused by the presence of bromide from the reduction of AgBr NPs.
As no clearly defined reduction peak was observed in the stripping voltammetry, initial impact experiments were conducted at a potential far more negative than the onset of the observed reductive features. Figure 4 shows the current-time transient in the absence and presence of AgBr NPs at −1.00 V vs MSE, whereby reductive features are observed only in the presence of the NPs. These spikes are indicative of direct electrolytic impacts and suggest the first successful detection of stochastic silver halide impacts.
Figure 4.
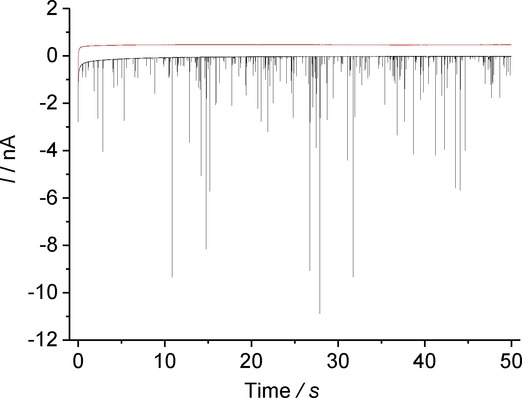
Chronoamperometry at −1.00 V vs. MSE. Red: 0.10 m NaNO3. Black: 0.10 m NaNO3 and AgBr NPs (total [AgBr]=18.8 μgml−1). Lines offset by 0.5 nA for clarity.
To investigate the effect of applied potential on the impact features, the voltage was varied, and the average area of the spikes calculated. Figure 5 shows the average spike area (charge) plotted as a function of applied potential. A clear switch on after −0.75 V is observed, with the average spike charge reaching a steady value consistent with full electrolysis of the particle. The errors reflect the number of impacts measured for each data point which vary significantly. This onset corresponds with the earliest observable reductive features in the stripping voltammetry of the drop cast particles and indicates a significant nucleation overpotential for the reduction of impacting AgBr NPs as seen with the drop-cast particles.
Figure 5.
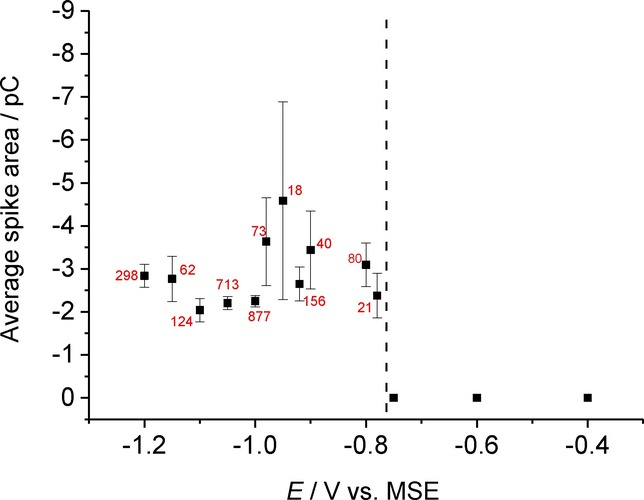
Average spike area as a function of applied potential in 0.10 m NaNO3. Dotted line indicates the switch-on potential for AgBr NP reduction. The numbers by each point indicate the number of spikes averaged to produce each data point.
The individual spike charges were summarised across this range and a size distribution calculated using the equation:15
| 4 |
where Mw is the molecular weight, Q is the charge, and ρ is the NP density. Figure 6 shows the calculated electrochemical size distribution when compared to scanning electron microscopy (SEM). The sizing of the particles is in very close agreement with SEM results, with the average diameter of the NPs found to be 92 nm and 93 nm, respectively. This confirms the accurate electrochemical sizing of silver halide NPs and shows the applicability of this technique to metal compound materials approaching the limit of the nanoscale.
Figure 6.
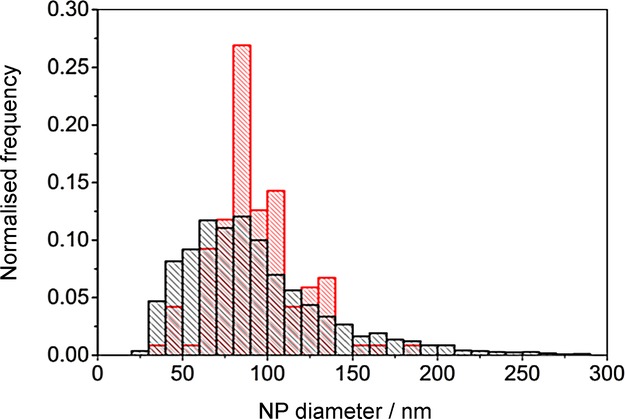
Size distribution of AgBr NPs. Black: electrochemical sizing summarised over potentials from −0.78 to −1.20 V vs. MSE. Red: sizing from SEM.
Silver NP characterisation
Past nano-impact experiments have been conducted mostly in high ionic media and yielded excellent agreement with conventional sizing techniques.25 Recent work on the coulometric sizing of quasi-spherical NPs has used a supporting electrolyte concentration of 0.10 m and gave good agreement between SEM imaging and coulometric sizing.19 Lower concentrations of the supporting electrolyte have also been successfully used to characterise smaller (30 nm diameter) Ag particles.26 In the present work we investigate the effect of reduced ionic strength on the electrochemical characterisation of large ∼100 nm quasi-spherical Ag NPs via nano-impacts. An electrolyte concentration of 20 mm potassium chloride was chosen for the experiments. A random assembly of microelectrodes (RAM) was used during the experiments due to the higher signal-to-noise ratio and an increase in the number of the observable impacts resulting from an increased surface area as compared to a single microelectrode.24
First the electrochemical behaviour of silver NPs was determined through cyclic voltammetry of the experimental solution (1.4 mL of stock Ag NPs in 8.6 mL of 20 mm potassium chloride) on the RAM electrode in order to determine the oxidation potential of the NPs in the lower concentration of electrolyte scanning, first oxidatively then reductively. Figure 7 shows a cyclic voltammogram in the presence (black) and absence (red) of the NPs. No distinctive features are observed in the absence of NPs (red line). A clear oxidative peak is observed at +0.145 V vs. a saturated calomel electrode (SCE) in the presence of the NPs, which is in good agreement with previous reports,19 and no further peaks were observed in the CV. The oxidation peak corresponds to formation of Ag+ species by a one-electron oxidation:
| 5 |
Figure 7.
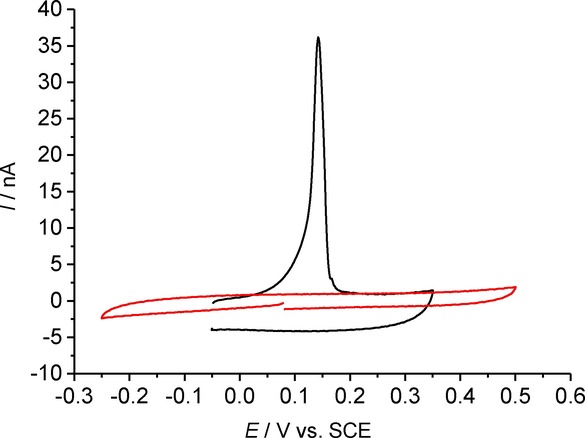
Cyclic voltammetry of Ag NPs suspended in 20 mm KCl at 100 mVs−1 on RAM electrode.
For chronoamperometry experiments, a potential of +0.60 V vs. SCE was chosen in order to ensure complete oxidation of the particles. The applied potential of +0.60 V is approximately 400 mV in excess of the potential required for the stripping. Hence it is certainly sufficient for Ag oxidation in the light of our previous experience.
Figure 8 shows the obtained current-time transient in the presence (black line) and the absence (red line) of the NPs, whereby the spikes are only observed in the presence of the Ag NPs. The spikes correspond to direct electrolytic impacts and are due to the oxidation of the colliding silver nanoparticles. The resultant spikes were analysed, and the resultant size distribution was calculated using Equation 1. Figure 9 shows the calculated electrochemical size distribution in comparison to the SEM data. The mean spherical diameter was determined from nano-impacts to be 85 nm. From the SEM images, the mean spherical diameter was 100 nm. For further confirmation, nanoparticle tracking analysis (NTA) of the silver NPs was performed using a NanoSight LM10 (NanoSight, Amesbury, UK), equipped with a sample chamber with a 638 nm laser. The sample was measured for 60 s with automatic settings at 30 frames per second. The software used for capturing and data analysis was the Nanosight NTA 2.3. The size distribution shown in Figure 10 has the mean diameter of 106 nm and standard deviation of 33 nm. The data is in good agreement with the SEM image analysis which shows a similar mean diameter; however, a significantly larger standard deviation is observed (33 nm from the NTA vs. 4 nm from the SEM), which may be caused by an artificial broadening.4 The size distributions obtained from the three techniques are in close agreement, but the nano-impact sizing distribution for the 20 mm potassium chloride concentration is smaller. This discrepancy is attributed to the reduced electrolyte concentration. The apparent smaller diameter might likely be caused by incomplete dissolution of the silver nanoparticles. By contrast, according to the literature, excellent agreement with the SEM data was obtained for 0.10 m potassium chloride.19 This suggests that in order for a particle to undergo complete oxidation, potential drop across the interface must be minimized, which is only achieved for the higher concentration of the supporting electrolyte as observed for molecular electrochemistry.23
Figure 8.
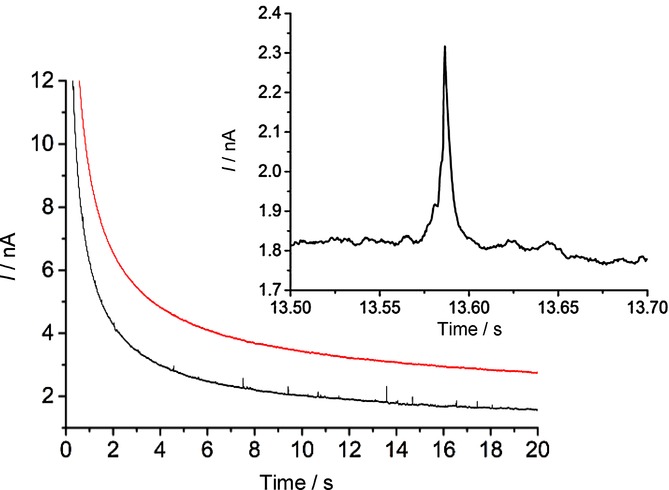
Chronoamperometry at +0.60 V vs. SCE. Red: 20 mm KCl. Black: 20 mm KCl and Ag NPs (total [Ag]=2.8 μgml−1). Lines offset by 1 nA for clarity. Inset shows zoomed-in region from 13.50–13.70 s.
Figure 9.
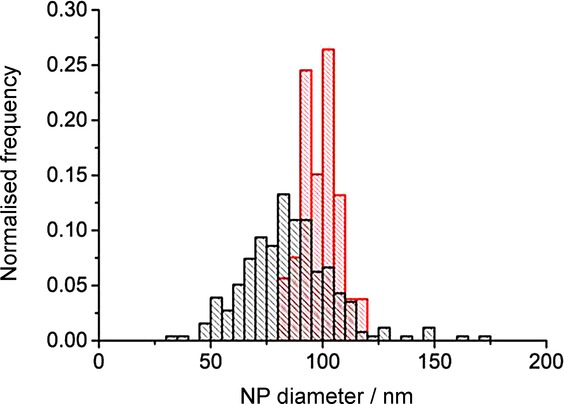
Size distribution Ag NPs. Red: electrochemical sizing from nano-impacts in 20 mm KCl. Black: sizing from SEM.
Figure 10.
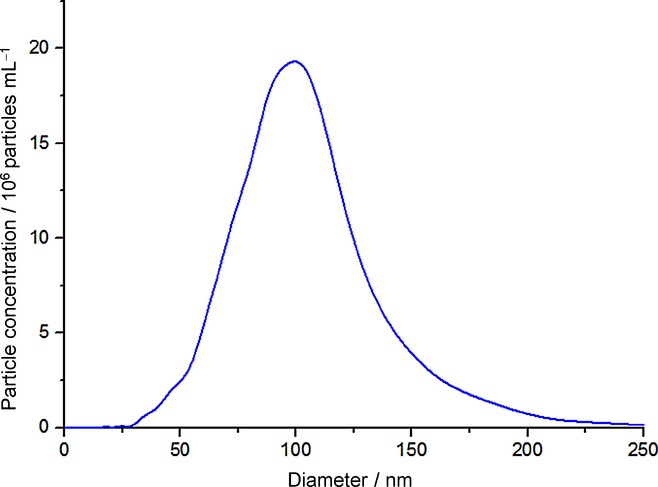
Size distribution of Ag NPs obtained from nanoparticle tracking analysis.
Conclusions
The successful sizing of large, high-density AgBr NPs demonstrates the ability of the nano-impact technique to characterise particles across the entirety of the nanometre range. With the recent advancements herein, the technique has been shown to size particles over five orders of magnitude in charge, spanning 6–100 nm in diameter. However, results for the oxidation of well-studied Ag NPs, does show the choice of electrolyte can affect the reliability of the sizing obtained for large NPs. For complete dissolution, an electrolyte concentration in excess of 0.10 m should be used to ensure complete electrolysis of the studied particle. Therefore, with carefully chosen electrolyte composition, the nano-impact methodology has shown great potential for different material types and is continuing to establish itself as an alternative and effective method for the characterisation of electroactive NPs.
Experimental Section
Chemicals
Silver citrate-capped NPs of 100 nm diameter were purchased from nanoComposix (San Diego, USA) as an aqueous suspension. AgNO3 (99 %), [Ru(NH3)6]Cl3 (98 %), and KCl (99 %) were supplied by Sigma–Aldrich (Dorset, UK). NaBr (99 %) was purchased from M&B laboratories (Sydney, Australia). Gelatine powder and KNO3 (99.5 %) were obtained from VWR (Soulbury, UK). All solutions were prepared using ultrapure Millipore water of resistivity 18.2 MΩ cm at 298 K. For Ag NP nano-impacts characterization, stock silver citrate-capped NP solution was added to the electrolyte. N2 was used to thoroughly degas electrolyte solutions prior to electrochemical study.
Electrodes
All electrochemical experiments utilised a three-electrode system in a Faraday cage thermostated at 25 °C.
For AgBr experiments, an Autolab PGSTAT 302N was used from Metrohm-Autolab (BV, Utrecht, Netherlands), fitted with an extremely-low-noise (ECD) module for reduction of background noise for impact experiments. The working electrodes used were a 3.0 mm GC macrodisk from CH Instruments (Austin, USA) and a 11.3 μm diameter carbon microdisk from BASi (West Lafayette, USA). The reference electrode was a saturated MSE (equivalent to +0.64 V vs. normal hyrdrogen electrode, NHE)23 also from BASi, and the counter was a platinum wire from Goodfellow Ltd. (Cambridge, UK). All working electrodes were polished with 1, 0.3, and 0.05 μm alumina powder from Buehler (Coventry, UK) before each experiment.
Citrate-capped Ag NP experiments were performed using a three-electrode setup with an Autolab II potentiostat (Metrohm Autolab BV, Utrecht, Netherlands). A platinum mesh counter electrode was used for experiments, and potentials were applied against an SCE reference electrode (equivalent to +0.24 V vs. NHE).27 Anodic particle impacts were performed using a random array of microelectrodes (RAM) as the working electrode. The RAM was kindly supplied by Prof. S. Fletcher28 (Loughborough University, Leicestershire UK) and constructed using approximately 3200 microfibres of radius 7.0 μm, dispersed in a nonconductive epoxy, with an electrode spacing on average of 70 μm. The working electrode was polished before each experiment with 0.3 μm alumina (Buehler, Coventry, UK) to ensure a clean and reproducible surface.
All NP impact data was analysed using Signal Counter software (developed by Dario Omanovic Centre for Marine and Environmental Research, Zagreb, Croatia).29 Origin Pro 9.0 (Origin Lab Corporation, Northampton, USA) was used for data visualization and histogram analysis.
NP Preparation and characterisation by SEM
AgBr NPs were prepared as previously reported.30 A 25 mL three-necked flask containing gelatin (0.75 g) in H2O (10 mL) was heated to 35 °C and stirred at 350 rpm by a magnetic stirrer. To this, 2.0 m AgNO3 (5 mL) and 2.0 m NaBr (5 mL) were injected simultaneously and left to stir for 5 min. The resulting suspension was transferred to a Faulken tube and kept in dark conditions. The set-up and storage vessel were encased in foil throughout to minimise light exposure.
SEM images of the AgBr and Ag NPs were taken on a high-resolution SEM (LEO Geminin 1530, Zeiss, Jena, Germany). To prepare the samples, the NP suspensions were sonicated for 5 s prior to being drop-cast on a TEM-grid-modified SEM sample holder. Figure 1 and 2 show the images at low and high magnification for AgBr and Ag. Processing of these images was conducted using Image J public domain software, and found the particles to have a spherical diameter of 93 nm for AgBr and 98 nm for Ag, and standard deviations of 25 nm and 8 nm respectively.
Acknowledgments
T. R. B., S. V. S., and R. G. C. acknowledge funding from the European Research Council (ERC) under the European Union's Seventh Framework Programme (FP/2007–2013)/ERC Grant Agreement no. [320403].
References
- Batchelor-McAuley C, Ellison J, Tschulik K, Hurst PJ, Boldt R, Compton RG. Unpublished results. doi: 10.1039/c5an00474h. [DOI] [PubMed] [Google Scholar]
- Loget G, Lee TC, Taylor RW, Mahajan S, Nicoletti O, Jones ST, Coulston RJ, Lapeyre V, Garrigue P, Midgley PA, Scherman OA, Baumberg JJ, Kuhn A. Small. 2012;8:2698–2703. doi: 10.1002/smll.201200546. [DOI] [PubMed] [Google Scholar]
- Filipe V, Hawe A, Jiskoot W. Pharm. Res. 2010;27:796–810. doi: 10.1007/s11095-010-0073-2. [DOI] [PMC free article] [PubMed] [Google Scholar]
- Finder C, Wohlgemuth M, Mayer C. Part. Part. Syst. Charact. 2004;21:372–378. [Google Scholar]
- Xiao X, Bard AJ. J. Am. Chem. Soc. 2007;129:9610–9612. doi: 10.1021/ja072344w. [DOI] [PubMed] [Google Scholar]
- Zhou YG, Rees NV, Compton RG. Chem. Phys. Lett. 2011;514:291–293. [Google Scholar]
- Zhou YG, Rees NV, Compton RG. Angew. Chem. Int. Ed. 50:4219–4221. doi: 10.1002/anie.201100885. [DOI] [PubMed] [Google Scholar]; Angew. Chem. 2011;123 [Google Scholar]
- Zhou YG, Rees NV, Pillay J, Tshikhudo R, Vilakazi S, Compton RG. Chem. Commun. 2012;48:224–226. doi: 10.1039/c1cc16407d. [DOI] [PubMed] [Google Scholar]
- Qiu D, Wang S, Zheng Y, Deng Z. Nanotechnology. 2013;24:505707. doi: 10.1088/0957-4484/24/50/505707. [DOI] [PubMed] [Google Scholar]
- Stuart EJE, Zhou YG, Rees NV, Compton RG. RSC Adv. 2012;2:6879–6884. [Google Scholar]
- Zhou YG, Haddou B, Rees NV, Compton RG. Phys. Chem. Chem. Phys. 2012;14:14354–14357. doi: 10.1039/c2cp42940c. [DOI] [PubMed] [Google Scholar]
- Haddou B, Rees NV, Compton RG. Phys. Chem. Chem. Phys. 2012;14:13612–13617. doi: 10.1039/c2cp42585h. [DOI] [PubMed] [Google Scholar]
- Tschulik K, Haddou B, Omanović D, Rees NV, Compton RG. Nano Res. 2013;6:836–841. [Google Scholar]
- Bartlett TR, Batchelor-McAuley C, Tschulik K, Jurkschat K, Compton RG. ChemElectroChem. 2015;2:522–528. [Google Scholar]
- Cheng W, Zhou XF, Compton RG. Angew. Chem. Int. Ed. 52:12980–12982. doi: 10.1002/anie.201307653. [DOI] [PubMed] [Google Scholar]; Angew. Chem. 2013;125 [Google Scholar]
- Zhou XF, Cheng W, Batchelor-Mcauley C, Tschulik K, Compton RG. Electroanalysis. 2014;26:248–253. [Google Scholar]
- Stuart EJ, Tschulik K, Batchelor-McAuley C, Compton RG. ACS Nano. 2014;8:7648–7654. doi: 10.1021/nn502634n. [DOI] [PubMed] [Google Scholar]
- Ellison J, Batchelor-Mcauley C, Tschulik K, Compton RG. Sens. Actuators B. 2014;200:47–52. [Google Scholar]
- Sokolov SS. Batchelor-McAuley C. Tschulik K. Fletcher S. Compton RG. Unpublished results [Google Scholar]
- Rees NV. Electrochem. Commun. 2014;43:83–86. [Google Scholar]
- SCENIHR, Opinion on the scientific basis for the definition of the term “nanomaterial”, European Union, 2010 http://ec.europa.eu/health/scientific_committees/consultations/public_consultations/scenihr_cons_13_en.htm.
- Rees NV, Zhou YG, Compton RG. ChemPhysChem. 2011;12:1645–1647. doi: 10.1002/cphc.201100207. [DOI] [PubMed] [Google Scholar]
- Brolo AG, Sharma SD. Electrochim. Acta. 2003;48:1375–1384. [Google Scholar]
- Toh HS, Batchelor-McAuley C, Tschulik K, Compton RG. Analyst. 2013;138:4292–4297. doi: 10.1039/c3an00843f. [DOI] [PubMed] [Google Scholar]
- Tschulik K, Batchelor-McAuley C, Toh HS, Stuart EJ, Compton RG. Phys. Chem. Chem. Phys. 2014;16:616–623. doi: 10.1039/c3cp54221a. [DOI] [PubMed] [Google Scholar]
- Toh HS, Jurkschat K, Compton RG. Chem. Eur. J. 2015;21:2998–3004. doi: 10.1002/chem.201406278. [DOI] [PubMed] [Google Scholar]
- Bard AJ, Faulkner LR. Electrochemical Methods, 2nd ed. New York, NY: John Wiley&Sons; 2001. pp. 24–29. pp. . [Google Scholar]
- Fletcher S. Electrochem. Commun. 1999;1:502–512. [Google Scholar]
- Ellison J, Tschulik K, Stuart EJ, Jurkschat K, Omanovic D, Uhlemann M, Crossley A, Compton RG. ChemistryOpen. 2013;2:69–75. doi: 10.1002/open.201300005. [DOI] [PMC free article] [PubMed] [Google Scholar]
- Johansson KP, Marchetti AP, McLendon GL. J. Phys. Chem. 1992;96:2873–2879. [Google Scholar]


