Abstract
In this study, we developed a simple and robust semi-automatic method to measure the right ventricle to left ventricle (RV-to-LV) transit time (TT) in mice using 2-[18F]fluoro-2-deoxy-D-glucose (FDG) positron emission tomography (PET). The accuracy of the method was first evaluated using a 4-D digital dynamic mouse phantom. The RV-to-LV TTs of twenty-nine mouse studies were measured using the new method and compared to those obtained from the conventional ROI-drawing method. The results showed that the new method correctly separated different structures (e.g., RV, lung, and LV) in the PET images and generated corresponding time activity curve (TAC) of each structure. The RV-to-LV TTs obtained from the new method and ROI method were not statistically different (P = 0.20; r = 0.76). We expect that this fast and robust method is applicable to the pathophysiology of cardiovascular diseases using small animal models such as rats and mice.
Keywords: Cardiovascular transit time, first-pass angiography, mice, positron emission tomography
I. Introduction
RECENT developments of small animal imaging systems, such as microPET, microCT, and microMRI have drastically changed the study protocols of experimental researches. One of the major attributes of PET technology is its ability to quantify physiological processes noninvasively. The first-pass angiography using small animal PET scanner, however, has not yet been explored. We have demonstrated previously that the spatial and temporal resolutions of a small animal PET scanner (microPET Focus 220; Concorde Microsystems, LLC, Knoxville, TN, USA) were sufficient to follow the time course of activities in different heart structures of a mouse using a bolus injection of FDG (Fig. 1) [1]. With a good FDG bolus (<2 sec) tail-vein injection and fine framing rate (e.g., 0.3 sec/frame), the cardiovascular transit time (TT) between different structures (e.g., RV-to-LV) can be determined [2]. Traditionally, the TT was calculated using the TACs derived from manually-drawn ROIs. The accuracy of ROI-drawing, especially for the small hearts of mice, requires a well-trained nuclear physician or technologist to identify the different cardiac structures in PET images. The calculated transit time, therefore, was sensitive to the volume and location of the ROI. A method that minimizes the operator dependency and improves the reproducibility of data analysis is therefore desirable. In this study, we developed a robust, semi-automatic clustering method that separates different cardiac structures and generates TACs of RV and LV without ROI drawing.
Fig. 1.
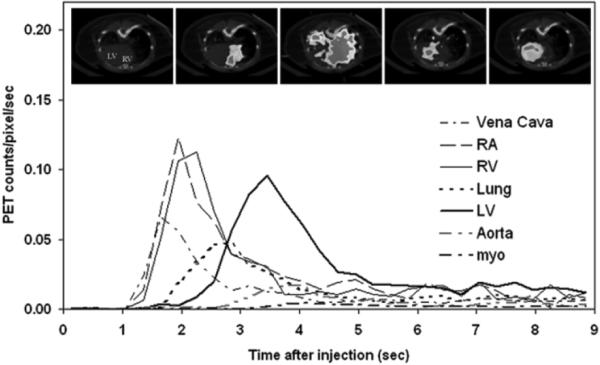
A typical example of first-pass angiography of a mouse FDG-PET study. The graph depicts the first nine seconds time activity curves (TACs) of the inferior vena cava, right atrium (RA), RV, lung, LV, descending aorta and myocardium (myo) following a tail-vein bolus injection of FDG. The TACs of the RV, lung and LV were well separated. The inserts reflect the fused CT and PET images at a mid-ventricular plane acquired at different times after FDG injection. The first insert on the left had no FDG uptake and showed CT image only. Inserts from the left to right were acquired at 0 sec, 2.1 sec, 2.7 sec, 3.1 sec and 10 min after FDG injection.
II. Materials and Methods
A. The Cluster Analysis Method
Cluster analysis (CA) is an exploratory data analysis which sorts different observations into groups in such a way that the degree of association is strong between members of the same group and weak between members of different groups [3]. Among different CA methods, k-Means clustering returns exactly K different clusters of greatest possible distinction using the input data and a user defined cluster number K. We used the algorithm in the built-in function “kmeans” of MATLAB (Mathworks Inc, Natick, MA USA). Our goal was to derive TACs of different cardiac structures without manual ROI drawing. We assumed: 1) There are limited number of structures within the selected PET images; 2) The TACs of RV, lung and LV structures in dynamic PET images are distinct; and 3) The voxel-based TAC in the core of each structure has the least amount of spillover activities from the adjacent structures and therefore represents the best TAC of that structure. Based on these hypotheses, we derived RV and LV TACs by applying k-Means clustering to the transaxial-view, mid-ventricular dynamic PET images. For each image voxel, the values in n scan frames form a vector of length n. Applying k-Means clustering to these vectors, the vectors were separated into a pre-set number of clusters. After the cluster analysis, the Euclidean distance from any point in a cluster to the centroid of the cluster is shorter than the distance to the centroids of all other clusters.
“kmeans” partitions the observations into K mutually exclusive clusters. It returns K centroids and a vector of indices indicating to which of the K clusters it has assigned each observation. The centroid for each cluster is the point to which the sum of distances from all objects in that cluster is minimized. By default, “kmeans” uses an iterative algorithm that minimizes the sum of squared Euclidean distances from each object to its cluster centroid, over all clusters. When “kmeans” is used to partition the PET images, each voxel-wise TAC is treated as an observation. If we include only the image voxels of K structures, we expect that the “kmeans” will segment and partition the PET TACs into K mutually exclusive clusters and the centroid of each cluster will be the TAC with the least amount of spillover activities.
The program we implemented starts by asking the user to select an image plane at the middle level of the LV chamber. The user then selects three early time frames from the display that show maximum activities of RV, lung and LV, respectively. Subsequently, the program uses these image planes to generate masks that contain mainly the structures of RV, lung, LV, and minimum amount of background tissue to restrict the voxels for cluster analysis. The planes used are the selected mid-ventricular plane and the ones above and below it. Using voxel-wise TACs as input data and cluster number of four, “kmeans” returns a vector of cluster indices (1–4) and four centroids. The indices are mapped back to the masks to generate three cluster images. The cluster numbers and corresponding centroids of RV and LV were identified. The RV-to-LV TT is then calculated using the equations described in the next section.
B. RV-to-LV Transit Time Calculation
After a bolus injection of FDG through a tail vein, ideally the FDG activity should clear entirely from RV or LV after a period of time. Because of recirculation, the tail of each curve does not drop to zero (see Fig. 1). To eliminate the recirculation portion from the RV and LV TACs, we fit an exponential curve to the clearance phase of the curve [2]. The mean-arrival-time (TA; defined as the average time for the bolus to arrive at a certain structure after injection) of RV and LV was calculated using (1)
| (1) |
where Ci is the recirculation-corrected blood curve, i equals to 1 for RV and 2 for LV and t0 is the injection time (t0 = 0). The transit time of RV to LV was then calculated as the difference of the mean-arrival-times for the two structures.
C. Phantom Studies
The simulations in this study were performed based on a 4D digital mouse phantom (Segars et al., 2004). The main program “mphan_main” of this phantom generation software models the shapes of mouse organs with nonuniform rational B-spline surfaces and models the heart motion based on gated magnetic resonance imaging [4]. The program allows user specified parameters such as heart motion and time activity curves to produce a set of dynamic mouse images. Using measured TACs of RV, lung, LV, aorta, myocardium, liver and body background from a real mouse FDG-PET study (Fig. 2) and the parameters in Table I, we generated dynamic mouse images (nonsmoothed) using “mphan_main”. The mouse heart simulations were in 64 × 64 × 64 image matrices. A second set of dynamic mouse images (smoothed) were generated by applying a 3-D Gaussian filter to the nonsmoothed images. The parameters of the filter were listed in Table I. We used these two sets of dynamic simulations to evaluate the accuracy of the clustering method.
Fig. 2.
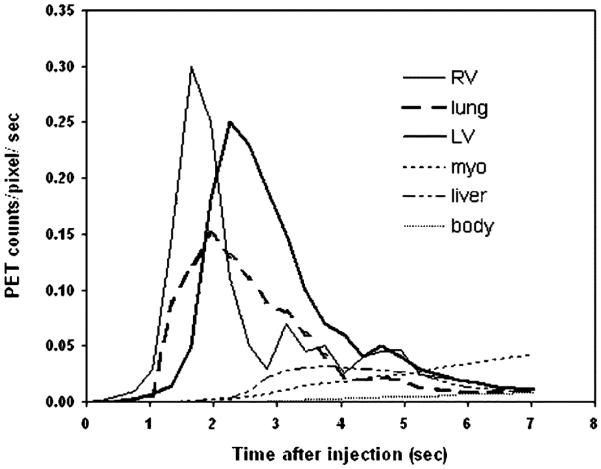
The TACs of RV, lung, LV, myocardium (myo), liver, and body background (body) used in the phantom simulations. The TACs were obtained from a real mouse FDG-PET study. The same TAC was used for LV and aorta.
TABLE I.
Parameters of Phantom Simulations
| Simulations |
||
|---|---|---|
| non-smoothed | smoothed | |
|
| ||
| filter (FWHM) | NA | in plane = 1.75mm axial = 1.75 mm |
| heart rate | 10/sec | 10/sec |
| respiratory rate | l/0.37sec | 1/0.37sec |
| pixel size | 0.25 mm | 0.25 mm |
| plane separation | 0.25 mm | 0.25 mm |
| framing sequences | 24 × 0.3sec | 24 × 0.3sec |
D. Mouse Studies
Twenty-nine dynamic FDG-PET scans of 10 minutes were performed in 25 mice (CL57/BL6; male; 22–39 g). The mice were the cohorts from several studies and under different physiological conditions such as nonfasting, fasting, insulin introduction, surgical intervention (i.e., incision and insertion of a catheter into a femoral artery). Before the scan, a catheter (Gauge 29 with 2–3 cm of PE20 tubing) was inserted into the tail vein of the mouse under anesthesia (1.5~2% isoflurane). The mouse was then placed in the PET scanner and body temperature was monitored [5]. A few seconds after PET acquisition was started, a bolus of <1 mCi FDG (50 μl or less) was injected into the tail vein through the catheter. The dynamic PET data was collected in list mode for 10 minutes. After the PET study, whole-body CT images were acquired (microCAT, Imtek Inc., Knoxville, TN, USA) for attenuation correction [6]. The PET data were reconstructed into images with pixel size of 0.4 mm and plane thickness of 0.8 mm. The dynamic sequences were thirty frames of 0.3 sec and one frame of 531 sec. A framing rate of 0.3 second was used because of the short transit time between RV and LV (~1 sec) and the noises in the TACs. Among framing rates of 0.2–0.5 seconds, we found a framing rate of 0.3 seconds produced TACs with best signal-to-noise ratios and good temporal resolution. The RV and LV TACs had signal-to-noise ratios ranging from 1.5 to 4.7 during the transit period. The signal-to-noise ratio was calculated as the mean count rate divided by the count rate of one standard deviation. The filtered backprojection algorithm was used for image reconstruction, producing images with FWHM = 1.8 mm at the center of FOV. Dead-time and radiation-decay were corrected.
The RV and LV TACs of 29 mouse studies were generated by both the clustering and the ROI methods. For the ROI method, the 3-dimensional, cylindrical ROIs of RV and LV were manually drawn by a nuclear physician who is specialized in small animal imaging (coauthor: MK). The ROI-drawing and TAC generation were performed using a public domain imaging tool (AMIDE, Stanford, CA, USA)[7]. For the clustering method, only the first 7.2 seconds PET data were used. The data were in 24 dynamic frames, 0.3 sec per frame. The TTs were subsequently calculated using the RV and LV TACs derived from these methods.
E. Statistical Analysis
The RV-to-LV TTs of 29 mouse studies obtained from the clustering and the ROI methods were compared using paired, Student’s t test. Correlation coefficients (r) of body weights vs. RV-to-LV TTs were calculated. The RV-to-LV TTs of three groups of animals were compared using one-way ANOVA. The body weights of group 1 were less than 25 g; group 2 were between 25 and 30 g and group 3 were larger than 30 g. In all tests, p ≤ 0.05 was considered statistically significant.
III. Results
A. Phantom Study
Fig. 3 shows some simulated phantom images at the mid-heart level. The high spatial resolution of the nonsmoothed phantom images demonstrated that the respiratory and cardiac motions did not drastically affect the image quality. The resolution of the smoothed images revealed significant partial volume effects, such as reduced counts plus added spillover activities, comparable to those due to the limited scanner resolution. Fig. 4 shows the structural images obtained by our method. Certain voxels of the original PET images were missing from the structural images due to the masking (see Materials and Method). The method correctly separated different structures in both nonsmoothed and smoothed phantom studies. The shape and the magnitude of the RV and LV TACs [Fig. 5(a)] in the nonsmoothed phantom images were almost identical to those of the simulated curves (Fig. 2). Although the RV and LV TACs [Fig. 5(b)] derived from the smoothed phantom images had lower counts due to the partial volume effect, the TAC profiles were very similar to the simulated TACs. These results confirm that the centroids of different clusters obtained by the clustering method had correct TACs of the corresponding structures and had minimum spillover activities. In Fig. 5(c) and 5(d), we depict two examples of the recirculation correction that we applied. By using the recirculation-corrected RV and LV curves and (1), we obtained the RV-to-LV TTs of 0.94 and 0.95 seconds for the nonsmoothed and smoothed phantom studies, respectively. The TT from the simulated RV and LV curves in Fig. 2 was 0.94 second.
Fig. 3.
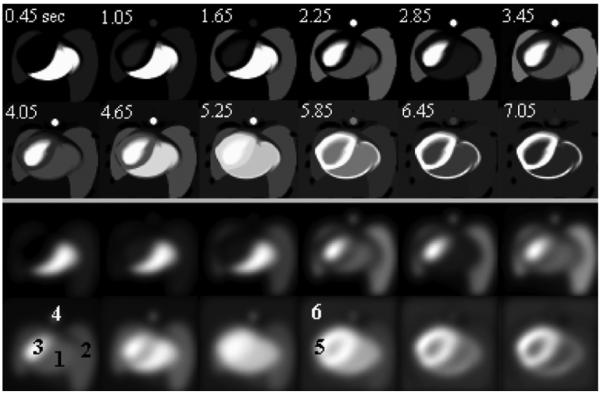
Sample transaxial-view images of phantom simulations at the level of LV (top two rows: nonsmoothed; bottom two rows: smoothed). The relative grey-scale was used. Time sequences (in seconds) were labeled in the nonsmoothed images. The structures of RV, lung, LV, aorta, myocardium (myo), and body background were labeled as “1” to “6” in the smoothed images, respectively. Liver structure did not appear at the transaxial level of these images.
Fig. 4.
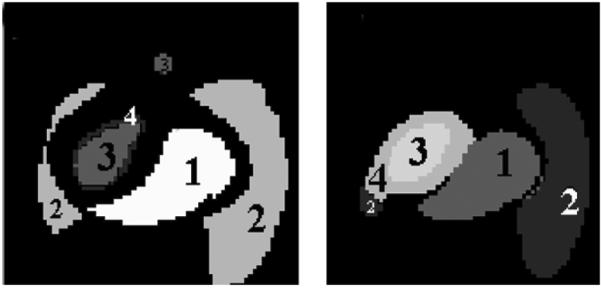
The structural images (left: nonsmoothed; right: smoothed) of phantom studies generated by our method. The labels of “1”, “2” and, “3” reflect the RV, lung and LV structures separated by the clustering method.
Fig. 5.
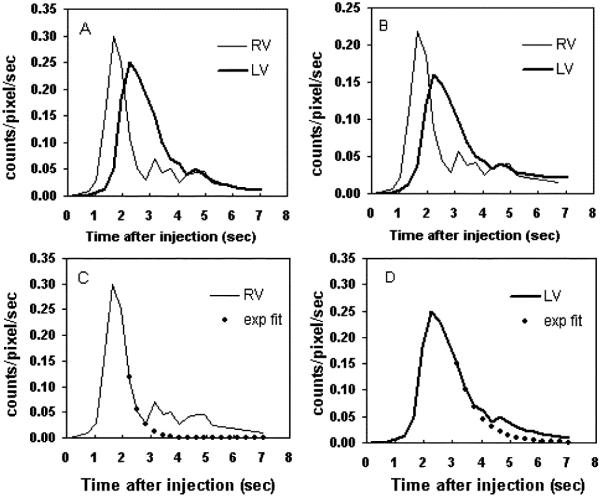
The RV and LV TACs obtained from the (a) nonsmoothed and (b) smoothed phantom images by using the clustering method. The recirculation corrections of RV and LV curves in (a) are shown in subplots (c) and (d), respectively.
B. Mouse Studies
A typical set of results is shown in Fig. 6. For all 29 mice studies, the clustering method separated the RV, lung and LV correctly. The 4th structure was usually a thin ring surrounding either the RV or LV. The TAC profiles of the RV and LV were similar to those obtained by the ROI method [Fig. 6(c)]. The magnitudes of the curves of the two methods are different mainly due to variations in ROI size. For example, very small ROIs were frequently placed at the centers of the structures by the ROI method. The RV-to-LV TTs calculated from the clustering method and the ROI method were 0.58 and 0.65 seconds, respectively, for this mouse. Fig. 7 shows the results of both methods for mouse studies. The RV-to-LV TTs from the two methods were not significantly different (n = 29; paired t test; p = 0.20) with a correlation coefficient of 0.76 [Fig. 7(c)]. The correlations of body weights with the RV-to-LV TTs were 0.47 and 0.39 for the clustering and the ROI methods, respectively. When the data were divided into three groups according to body weights, there were significantly (p = 0.05) different RV-to-LV TTs between the small and the large animal groups (Table II).
Fig. 6.
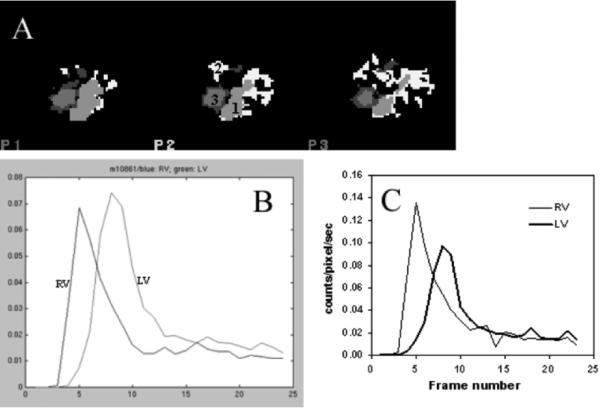
(a) Structural images and (b) RV and LV TACs of a mouse study generated by the clustering method. The CA method separated the RV, lung and LV (labeled as “1”, “2”, and “3” for RV, lung, and LV, respectively). (c) RV and LV TACs obtained from the same mouse using the ROI method.
Fig. 7.
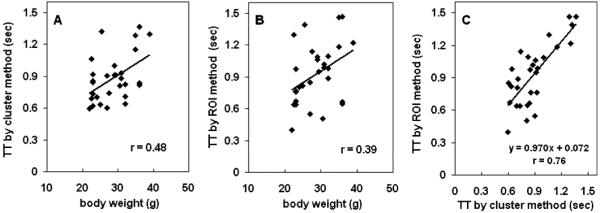
TTs of mouse studies obtained from the (a) clustering and (b) ROI methods. (c) Correlation of TTs obtained from the two methods.
TABLE II.
The RV-to-LV TTs of 29 Mice Studies Obtained by Using the Clustering and the ROI Methods
| N | Body weight (g) | RV-to-LV (seconds) |
||
|---|---|---|---|---|
| Clustering Method |
ROI Method |
|||
| group I | 9 | 22.89 ± 0.55 | 0.78 ± 0.15a | 0.77 ± 0.25b |
| group 2 | 8 | 27.40 ± 1.70 | 0.88 ± 0.23 | 0.98 ± 0.25 |
| group 3 | 12 | 33.80 ± 2.71 | 0.96 ± 0.25 a | 1.01 ± 0.30 b |
: p = 0.05;
: p = 0.07
IV. Discussion
We demonstrated that first-pass angiography using small animal PET scanner is feasible despite the small size and rapid heart rates of mice. Using simulation data, we validated the accuracy of the cluster analysis derived RV and LV TACs. With the growth of genetic engineering, transgenic mice have become popular animal models to study human cardiovascular diseases. Many FDG-PET mouse studies can now be designed to noninvasively measure the cardiovascular responses due to pharmacological or surgical intervention. We expect that this simple and robust method is applicable to studying the pathophysiology of cardiovascular diseases in small animal models. Although the programs were developed for mouse studies, the same program is usable for human PET study.
There are several advantages of the clustering method: 1) The method is simple and easy to use. It requires only the selection of an image plane and the identification of three time frames (i.e., RV, LV, and lung phases). The TACs can be generated in seconds instead of minutes compared with the ROI method, and the results have minimum spillover activities. 2) The method is easy to implement. The cluster analysis routines are available commercially in many products such as SAS (SAS Institute Inc., Cary, NC, USA) and Matlab (Mathworks Inc, Natick, MA USA). 3) The clustering method is robust and reproducible. The TT values of the CA are insensitive (data not shown) to the frames chosen as long as the selected image plane crosses the LV. The variation of the calculated TTs based on the clustering method is expected to be smaller than that of the ROI method due to the reduced user interventions [e.g., Fig. 7(a) and Table II]. 4) The CA method requires only 10 seconds of the initial PET data. The method can provide an extra physiological index (i.e., RV-to-LV TT) for monitoring the mouse under study, if it is applied to a PET study designed for other purposes. 5) The method can be easily extended for calculating the cardiac output. Using the RV or LV TAC derived by the cluster analysis, the cardiac output can be calculated by using the Stewart-Hamilton equation (CO = injected activity/area under TACs). Validation of our method in determination of the cardiac output in mouse is currently under investigation.
The current study evaluated the cardiovascular transit time from RV to LV only. We have demonstrated previously that the spatial and temporal resolution of state of the art small animal scanners were sufficient to follow the time course of activities in different parts of the heart. Good separation among these TACs however required an optimum bolus injection of a small volume of FDG dose. In many cases, the TACs, such as RA and RV, LA and aorta overlapped due to fast transits (see Fig. 1). Among the calculated TTs of different structures (including lung), the RV-to-LV TT had the least variation. The method can be easily extended if TT between other structures is desired.
In this study, we did not find a strong correlation (r = 0.48 and r = 0.39 for the clustering and the ROI method, respectively) between body weight and RV-to-LV TT [Fig. 7(a) and 7(b)]. There was, however, a significantly different (p=0.05) RV-to-LV TTs between the small (<25 g) and the large (>30 g) mouse groups (Table II). The small variation among each subgroup suggested the reproducibility of the RV-to-LV TT. Mouse studies under different treatments (i.e., different physiological conditions) were used (see Material and Methods) which may have masked the correlation normally expected between body weight and the RV-to-LV TT. The main purpose of this study was to evaluate the new method and compare it to the ROI method. In the future, we plan to evaluate this correlation in experiments with less variable physiological conditions.
V. Conclusion
In this study, we developed a simple and robust semi-automatic method to measure the RV-to-LV transit time in mice using dynamic FDG-PET without manual ROI drawing. We expect that this method is applicable to studying the pathophysiology of cardiovascular diseases in small animal models.
Acknowledgment
The authors would like to acknowledge the contributions of Dr. N. Satyamurthy, UCLA cyclotron unit for FDG preparation; Dr. D. Stout, P. Chow, J. Edwards, and V. Dominguez, UCLA Crump Institute for Molecular Imaging, and the microPET facility for their technical assistance.
This work was supported in part by DOE cooperative agreement DE-FC03-02ER63420 and NIH Grant RO1-EB001943.
Contributor Information
Hsiao-Ming Wu, Department of Molecular and Medical Pharmacology, David Geffen School of Medicine, UCLA, Los Angeles, CA 90095 USA, (cwu@mednet.ucla.edu).
Michael C. Kreissl, Department of Molecular and Medical Pharmacology, David Geffen School of Medicine, UCLA, Los Angeles, CA 90095 USA
Heinrich R. Schelbert, UCLA-DOE Institute for Molecular Medicine, Los Angeles, CA 90095 USA and also with the Department of Molecular and Medical Pharmacology, David Geffen School of Medicine, UCLA, Los Angeles, CA 90095 USA
Waldemar Ladno, Department of Molecular and Medical Pharmacology, David Geffen School of Medicine, UCLA, Los Angeles, CA 90095 USA.
Mayumi Prins, Department of Neurosurgery, David Geffen School of Medicine, UCLA, Los Angeles, CA 90095 USA.
Kooresh Shoghi-Jadid, Department of Biomathematics, David Geffen School of Medicine, UCLA, Los Angeles, CA 90095 USA.
Arion Chatziioannou, Department of Molecular and Medical Pharmacology, David Geffen School of Medicine, UCLA, Los Angeles, CA 90095 USA.
Michael E. Phelps, UCLA-DOE Institute for Molecular Medicine, Los Angeles, CA 90095 USA and also with the Department of Molecular and Medical Pharmacology, David Geffen School of Medicine, UCLA, Los Angeles, CA 90095 USA
Sung-Cheng Huang, UCLA-DOE Institute for Molecular Medicine, Los Angeles, CA 90095 USA and also with the Department of Molecular and Medical Pharmacology, David Geffen School of Medicine, UCLA, Los Angeles, CA 90095 USA.
References
- [1].Tai YC, Chatziioannou AF, Yang Y, Silverman RW, Meadors K, Siegel S, Newport DF, Stickel JR, Cherry SR. MicroPET II: design, development and initial performance of an improved microPET scanner for small-animal imaging. Phys. Med. Biol. 2003 Jun.48(11):1519–1537. doi: 10.1088/0031-9155/48/11/303. [DOI] [PubMed] [Google Scholar]
- [2].Peters M, Myers MJ. Physiological Measurements With Radionuclides in Clinical Practice. Oxford Univ. Press; New York: 1998. [Google Scholar]
- [3].Kaufman L, Rousseeuw PJ. Finding Groups in Data: An Introduction to Cluster Analysis. Wiley; New York: Mar. 1990. [Google Scholar]
- [4].Segars WP, Tsui B, Frey EC, Johnson GA, Berr SS. Development of a 4-D digital mouse phantom for molecular imaging research. Molecular Imaging Biol. 2004 May;6(3):149–159. doi: 10.1016/j.mibio.2004.03.002. [DOI] [PubMed] [Google Scholar]
- [5].Stout DB, Chow PL, Gustilo A, Grubwieser S, Chatziioannou AX. Multimodality isolated bed system for mouse imaging experiments. Proc. 2003 Academy of Molecular Imaging Annu. Conf.; Madrid, Spain. pp. 128–129. [Google Scholar]
- [6].Chow PL, Rannou FR, Chatziioannou AF. Attenuation correction for small animal PET tomographs. Phys. Med. Biol. 2005;50:1837–1850. doi: 10.1088/0031-9155/50/8/014. [DOI] [PMC free article] [PubMed] [Google Scholar]
- [7].Loening AM, Gambhir SS. AMIDE: A free software tool for multimodality medical image analysis. Mol. Imag. 2003;2(3):131–137. doi: 10.1162/15353500200303133. [DOI] [PubMed] [Google Scholar]


