

Abstract
Objective:
In this cohort of individuals with and without multiple sclerosis (MS), we illustrate some of the novel approaches that smartphones provide to monitor patients with chronic neurologic disorders in their natural setting.
Methods:
Thirty-eight participant pairs (MS and cohabitant) aged 18–55 years participated in the study. Each participant received an Android HTC Sensation 4G smartphone containing a custom application suite of 19 tests capturing participant performance and patient-reported outcomes (PROs). Over 1 year, participants were prompted daily to complete one assigned test.
Results:
A total of 22 patients with MS and 17 cohabitants completed the entire study. Among patients with MS, low scores on PROs relating to mental and visual function were associated with dropout (p < 0.05). We illustrate several novel features of a smartphone platform. First, fluctuations in MS outcomes (e.g., fatigue) were assessed against an individual's ambient environment by linking responses to meteorological data. Second, both response accuracy and speed for the Ishihara color vision test were captured, highlighting the benefits of both active and passive data collection. Third, a new trait, a person-specific learning curve in neuropsychological testing, was identified using spline analysis. Finally, averaging repeated measures over the study yielded the most robust correlation matrix of the different outcome measures.
Conclusions:
We report the feasibility of, and barriers to, deploying a smartphone platform to gather useful passive and active performance data at high frequency in an unstructured manner in the field. A smartphone platform may therefore enable large-scale naturalistic studies of patients with MS or other neurologic diseases.
There is a need for more sensitive endpoints for clinical trials in chronic neurologic disorders such as multiple sclerosis (MS), in which clinical and radiologic evaluations obtained every few months may not accurately capture the symptomatic fluctuations that affect patients' quality of life (QOL).
New technologies that measure human behavior and function in a naturalistic setting are becoming accessible and practical to deploy to achieve 2 important goals: (1) frequent sampling of patient function to capture intra- and interday variation, and (2) evaluation of patients in their own milieu, which is more relevant to their experience than measures captured in the clinic.
Smartphones, portable and omnipresent, provide an important opportunity to integrate highly granular information across a variety of functional domains.1 Initial smartphone efforts in neurologic research have included symptom assessment2,3 and symptom management.4 Individuals with MS are frequent users of smartphones,5 and electronic platforms (whether tablet6 or Web-based7) can provide an accurate estimate of a patient's performance when benchmarked against standard clinical measures.
In this study we investigated the feasibility of performing frequent smartphone-based assessments of patients with MS and their cohabitants. The overarching goal was to identify operational challenges to deploying a smartphone platform for passive and active data collection in a human observational trial and to identify themes that are likely to improve study design for next-generation smartphone applications. It is important to note that this study was not designed to evaluate the comparative performance of specific smartphone applications against standard paper-and-pencil measures, an important step in future endeavors.
METHODS
Participants.
Pairs consisting of 1 patient with demyelinating disease and 1 healthy cohabitant, all aged 18–55 years, were recruited at the Partners MS Center, a large referral clinical center in the northeastern United States. Cohabitant pairs were recruited to control for common environment. Most patients had a diagnosis of MS by 2005 McDonald diagnostic criteria8 (table 1). Patients were invited to participate by their MS neurologist. Of the 40 pairs screened who met inclusion criteria, 2 pairs did not sign a consent form, so 38 pairs met all study criteria and received phones.
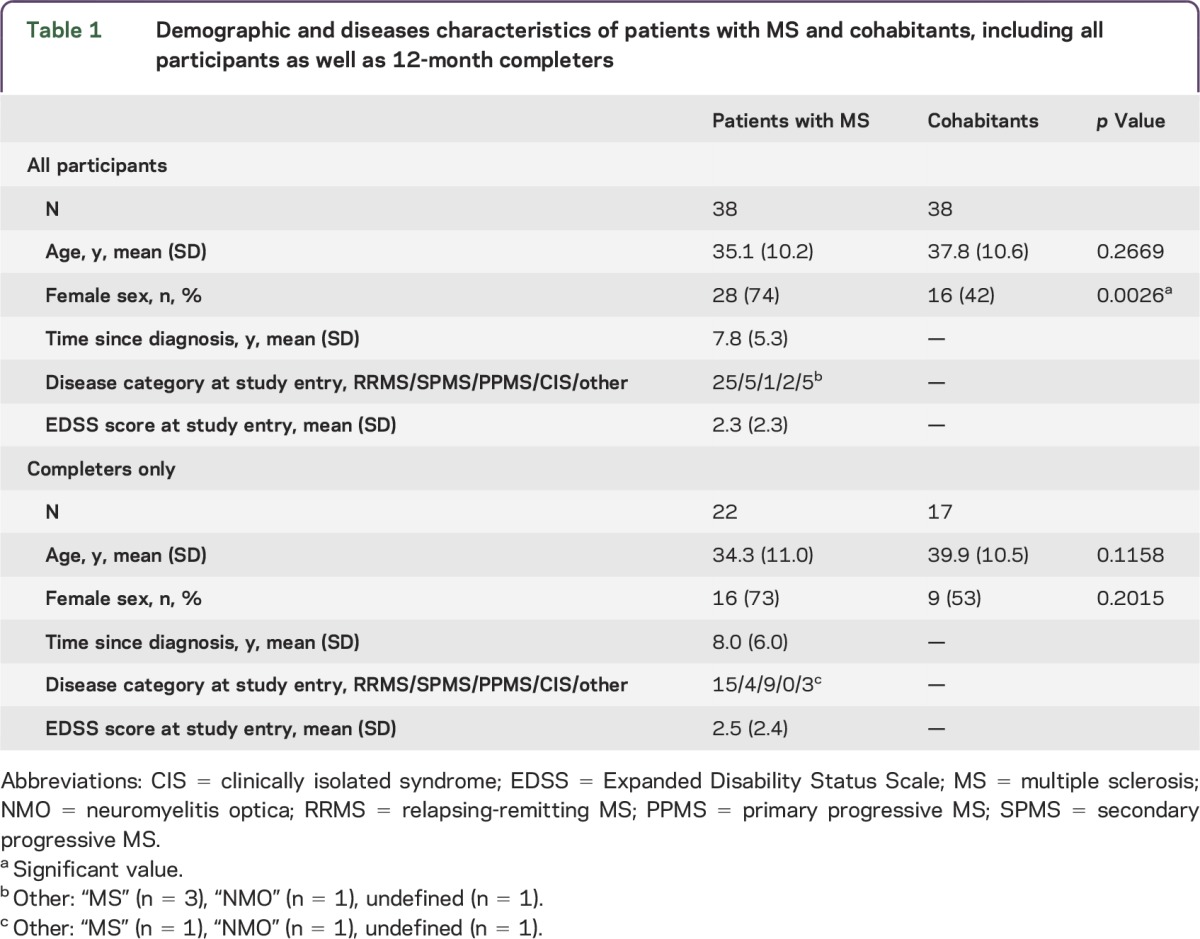
Table 1.
Demographic and diseases characteristics of patients with MS and cohabitants, including all participants as well as 12-month completers
Platform.
Each participant received an Android HTC Sensation 4G smartphone as well as a free cellular phone service plan for the duration of the study.
A custom application suite consisting of 19 tests was designed to (1) assess participant performance (color vision, attention, dexterity, and cognition), and (2) elicit patient-reported outcomes (PROs; fatigue, mood, and QOL) (appendix e-1 and table e-1 at Neurology.org/nn). We directly customized the tests for application on the smartphone, without any modifications to questions in this first assessment (e.g., Ishihara plates, 9-Hole Peg Test, Trails A, and Short Form Health Survey [SF-36]; appendix e-1 and figure e-1).
Protocol.
During the 1-year (365 days) study, participants were prompted daily to access the study application and complete a quasi-randomly assigned test. A participant with 3 consecutive weeks of noncompliance to daily testing was defined as dropping out, and his or her study-sponsored cellular plan was terminated. The first pair enrolled in May 2012. Enrollment closed in January 2013, and the last pair completed the study in January 2014.
Standard protocol approvals, registrations, and patient consents.
Ethical approval for all portions of this study was obtained from the Partners Healthcare Human Research Committee Institutional Review Board.
Statistical analysis.
A range of statistical techniques was used to analyze this extensive longitudinal dataset (appendix e-2). Analyses included descriptive statistics of study participants, Kaplan-Meier curves of time to study dropout, correlations between tests, spline (inflection point) analyses to identify practice effects and other longitudinal trends,9 and multivariable regression models.
RESULTS
Demographic and disease characteristics.
Although the mean age (SD) of the patients with MS (35.1 years [10.2]) and the cohabitants (37.8 years [10.6]) was similar (p = 0.27), there was an expected greater proportion of women among the patients with MS (p < 0.05, table 1). Among the patients with MS, 25 had relapsing-remitting MS, and the mean Expanded Disability Status Scale score was 2.3.
Tolerance of participants to daily data capture in their natural environment.
Among the 76 study participants, a total of 39 (51%; 22 patients with MS and 17 cohabitants) completed the 12 months of daily data collection. Failure to respond to task prompts accounted for 71% of individual participant terminations (appendix e-1 and table e-2).
The likelihood of study discontinuation decreased throughout the year: 50% of participants dropping out did so within 4 months, and 75% did so by 7.25 months (figure 1A). To investigate drivers of dropout rates, we performed a series of Cox proportional hazard regression analyses adjusting for age, sex, and, when appropriate, disease duration. Including all participants, we did not find an association of MS diagnosis with dropout. In patients with MS, we analyzed 18 of the smartphone measurements independently. We found that a low score on the SF-36 Mental Composite Scale (MCS; hazard ratio [HR] = 4.1, p = 0.017) (figure 1B) and a score of 1 or greater on the Impact of Visual Impairment Scale (IVIS; HR = 4.2, p = 0.03) (figure 1C) were nominally related to the likelihood of dropping out. Age, sex, and disease duration did not show an association with dropout in any of these models. IVIS and SF-36 MCS were correlated in patients with MS at the time of first measurement (r = 0.44, p < 0.01), and when they were both included in the model, neither was significant (p > 0.2), indicating that these factors were not independent risk factors for discontinuation.
Figure 1. Patterns of study retention.
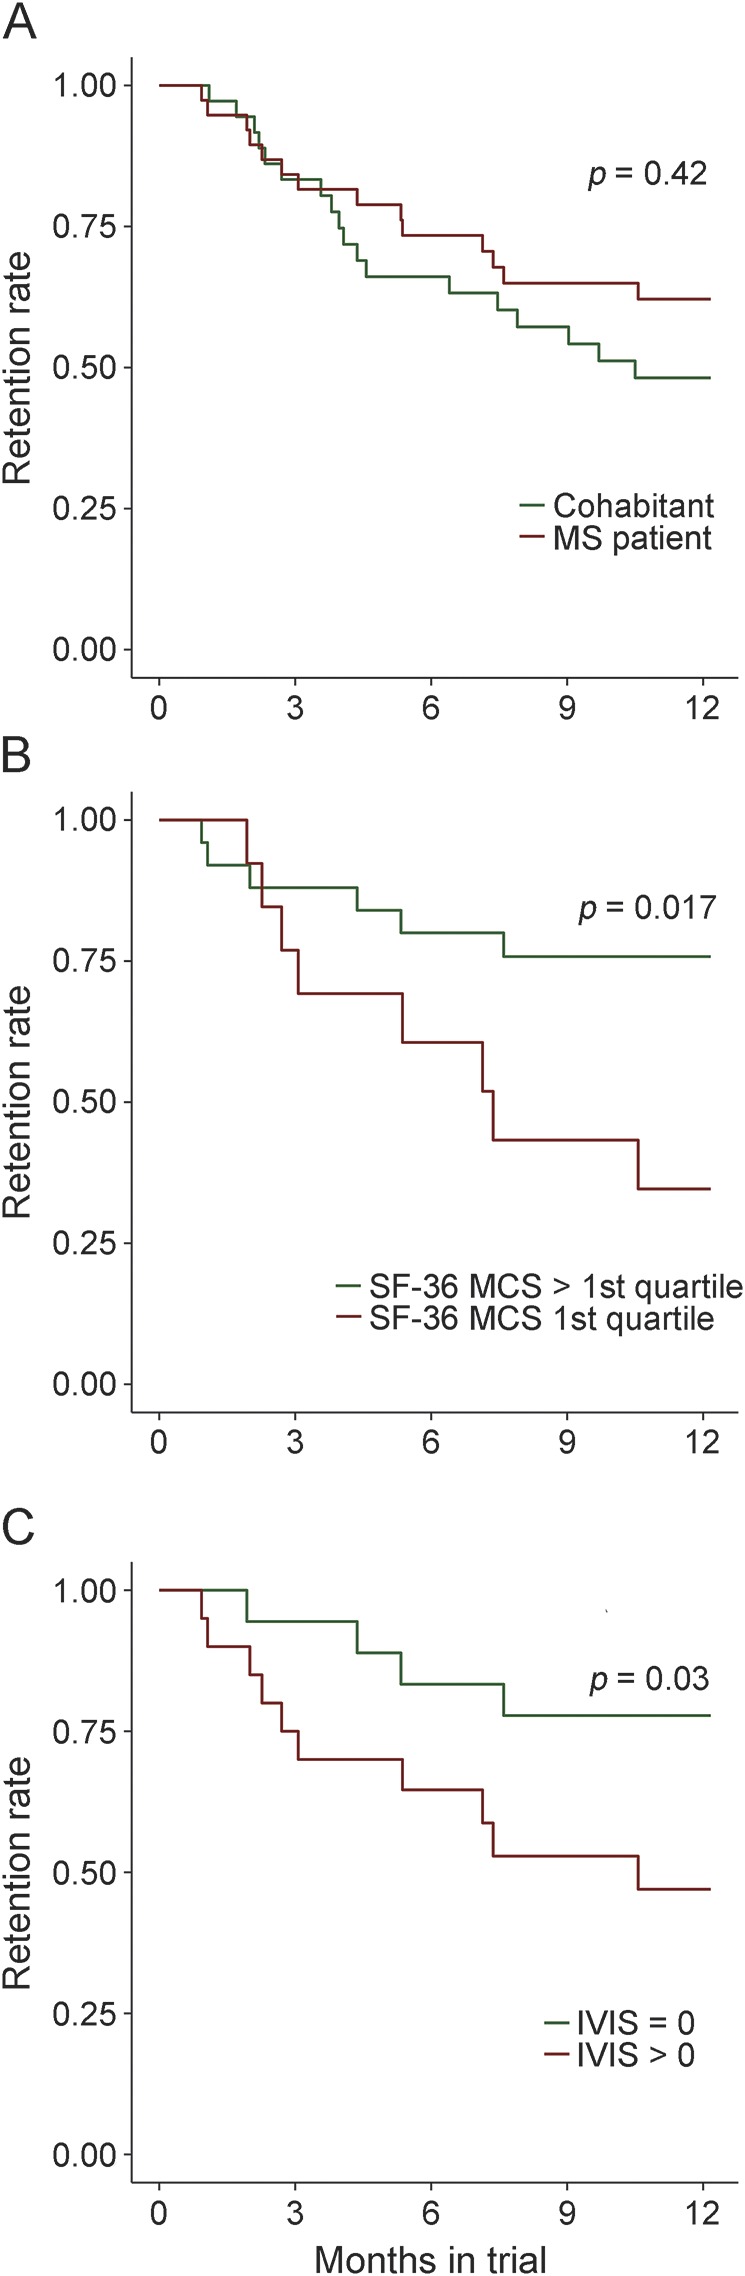
The proportion of individuals actively participating in the study is displayed over the course of the study. (A) The trajectories of the cohabitants and the patients with multiple sclerosis (MS). (B) Patients with MS with subjective cognitive impairment at study entry (defined as an SF-36 Mental Composite Scale [MCS] score in the lowest quartile) were more likely to drop out of the study. (C) Patients with MS with subjective visual impairment at study entry (defined as an Impact of Visual Impairment Scale [IVIS] score >0) were more likely to drop out of the study.
Response variability.
To assess the extent of variability among participants' responses, we first used a principal components (PC) analysis derived from all measures obtained in the study to identify outliers. In general, the range of responses provided by participants was similar, suggesting that the handheld device did not introduce large spurious deviations in responses. Nonetheless, we identified 5 outliers (MS patients 221, 311, and 411 and cohabitants 202 and 262) whose performance lay outside 2 times the interquartile range of either PC1 or PC2 (appendix e-1 and figure e-2), the 2 PCs capturing the greatest fraction of variance in the captured data. Deficits in 1 or 2 functions being tested, rather than technical factors, appeared to drive participants' identification as outliers (IVIS [participant 311], 9-Hole Peg Test [participant 311], Bladder Control Scale [participant 202], Trails A [participants 311 and 411], and Trails B [participants 311, 202, and 221]).
Although the application suite was not intended as a tool to differentiate between patients with MS and cohabitants, in secondary analyses we found that patients with MS reported worse functioning than their cohabitants (p value of <0.05 in 9 PROs analyzed [logistic regression adjusted for age and sex; appendix e-1 and table e-3]). Patients with MS also had lower average scores and greater variance than cohabitants in the performance tests.
Linking symptom (fatigue) fluctuations with external factors (season, daylight, and temperature).
Leveraging one of the advantages of frequent data collection afforded by the smartphone, we assessed whether self-reported fatigue, which patients with MS often link to higher temperatures, varied in relation to external factors. We linked the time and date stamp for each recorded data point for the Modified Fatigue Inventory Scale (MFIS) total score to the ambient temperature (uploaded to the smartphone) and daylight hours (as estimated by a publicly available sinusoidal function for Boston, MA) at the exact time and day of survey completion. Many patients with MS did display fluctuations in perceived level of fatigue over the year (figure 2C), but we found no significant evidence of a fixed effect of daylight hours (p = 0.091) or ambient temperature (p = 0.18) on MFIS (linear mixed-effects regression with random intercepts and slope adjusted for age, sex, and disease duration). As seen in figure 2A, there is clearly heterogeneity in the MS patient population, with a subset of patients displaying significant correlations between MFIS and daylight hours. This structure in the patient population needs to be explored further in larger studies.
Figure 2. Assessment of fluctuation in fatigue scores using environmental data.

The relationship between fatigue (as measured by the Modified Fatigue Impact Scale [MFIS]) and hours of daylight is presented for patients with multiple sclerosis (MS) in (A) and cohabitants in (B). Each participant is represented by one line describing the relation between MFIS and daylight hours. For most participants, there is no significant correlation between fatigue and hours of daylight (represented by gray lines); however, 4 participants represented by colored lines do show a significant increase in MFIS with more hours of daylight, and 1 participant shows the opposite, highlighting the symptomatic heterogeneity among patients with MS. (C) The MFIS total score for patients with MS is presented over the course of the calendar year. Each MS study completer is represented by a different line.
Interrogating visual function: Incorporating established and novel outcome measures.
We selected the Ishihara color plate test of visual function to illustrate the smartphone's ability to collect both active (accuracy) and passive (speed of completion) measures of individual performance (appendix e-1 and figure e-1). As expected, mean accuracy over all trials was lower in patients with MS (88%, n = 38) than in cohabitants (93%, n = 38). In all participants, impaired color vision in either eye was correlated with perceived visual deficits on the IVIS (r = −0.35, p < 0.01), offering some face validity to this measure. In addition to accuracy, however, response speed captured a different deficit among some patients with MS. For example, in one pair, the patient with MS displays a similar response speed to his or her cohabitant but much lower accuracy across the study duration (figure 3A), whereas in another pair (figure 3B), the patient with MS displays a delay in response compared to his or her cohabitant but comparable accuracy. These observations illustrate the manner in which the smartphone can provide a richer perspective on an individual's neurologic performance and its fluctuation over time.
Figure 3. Longitudinal performance of 2 MS–cohabitant participant pairs on Ishihara color testing.

Both response speed and response accuracy are provided for both members of 2 participant pairs (patient with multiple sclerosis [MS] in red and cohabitant in blue) for all Ishihara tests that they completed. (A) The responses of pair 61 when their right eye is queried. Both participants demonstrate a similar response time when their right eye is tested, but there appears to be a deficit in accuracy in the MS patient's right eye. (B) The response of pair 25 when their left eye is queried. The patient with MS has much slower response time than the cohabitant, but both individuals demonstrate similar accuracy.
New outcome measure for assessing patients with MS: Person-specific learning curve.
As with traditional performance tests, we observed an apparent practice effect across all performance tests (Trails A, Trails B, Ishihara, n-back, 9-Hole Peg Test; appendix e-1 and figure e-3). As illustrated by Trails A (figure 4), the mean performance score across the 26 or more times that study completers took this test was closer to the last score recorded than to the first score (figure 4B). Although present in cohabitants, the practice effect was more pronounced in patients with MS (figure 4, C and D). Figure 4A illustrates this trend at the level of one pair. To more rigorously identify the point at which scores stop improving and variance narrows, we applied a spline analysis in the context of a repeated-measures regression and identified the optimal inflection point. In Trails A, we found that the model fit best (as determined by the Akaike information criterion) with an inflection point at 8 trials for patients with MS and 2 trials for cohabitants (figure 4E). Similar inflection points were identified in the 9-Hole Peg test, where optimal inflection points for patients with MS and cohabitants were 7 and 2, respectively (figure 4F). At the participant level, we propose the location of the inflection point as a new outcome measure for MS that relates to an individual's ability to learn a new task (figure 4G). In the current study, almost all study completers attained a plateau after 10 trials (appendix e-1 and figure e-4).
Figure 4. Illustration of a practice effect by examining longitudinal performance measures in patients with MS and cohabitants.

(A) Response time for each trial of the Trails A test performed by a participant pair (patient with multiple sclerosis [MS] and cohabitant) over the course of the study. Each point represents one trial. (B) Comparison of the first, last, and mean values for Trails A in study completers (n = 39). The last value appears to more closely match the mean than the first value does. (C, D) For each Trails A trial, a boxplot of the mean score for all MS (n = 22, C) and cohabitant completers (n = 17, D) is shown. These plots illustrate a gradual decrease in mean scores for all individuals over the duration of the study, with narrowing of the variance as the practice effect wanes. (E, F) Results of the spline analysis for Trails A reveal a longer practice effect, on average, in patients with MS (blue line) than in cohabitants (red line) (E). A similar effect is noted for responses on the 9-Hole Peg Test (F). (G) Illustration of the longitudinal performance of a patient with MS on the Trails A test. The individual scores (black dashes) appear to improve over time. The black solid line represents the inflection point analysis. After 7 trials, the practice effect appears to taper off. The location of the inflection point is determined by finding the maximal R-squared value (red line), which peaks around 7 trials for this individual.
Utility of repeated assessments.
A major challenge to capturing naturalistic data outside of a structured clinical setting is the increased variability in performance due to external factors that might influence a participant's responses. We illustrate this daily fluctuation in performance on 2 tests, Trails A and MFIS total score, in a participant pair (patient with MS and cohabitant, appendix e-1 and figure e-5).
Our hypothesis was that serial measures would enable us to overcome the environmental noise found in any one cross-sectional measure. We compared the correlation matrix for each MS patient's first entry for each of the smartphone suite's measures (figure 5A) to the correlation matrix for each patient's mean score for each measure calculated after removing the first 3 tests (to minimize practice effects) (figure 5B). The number of pairwise correlations among the different tests meeting a suggestive p < 0.05 significance threshold increased from 44 (when using the first measure of each test) to 85 (when using the mean of each test after minimizing the practice effect). Additional thresholds are reported in appendix e-1 and figure e-6.
Figure 5. Pairwise correlations between selected patient-reported outcomes and performance tests in patients with MS.
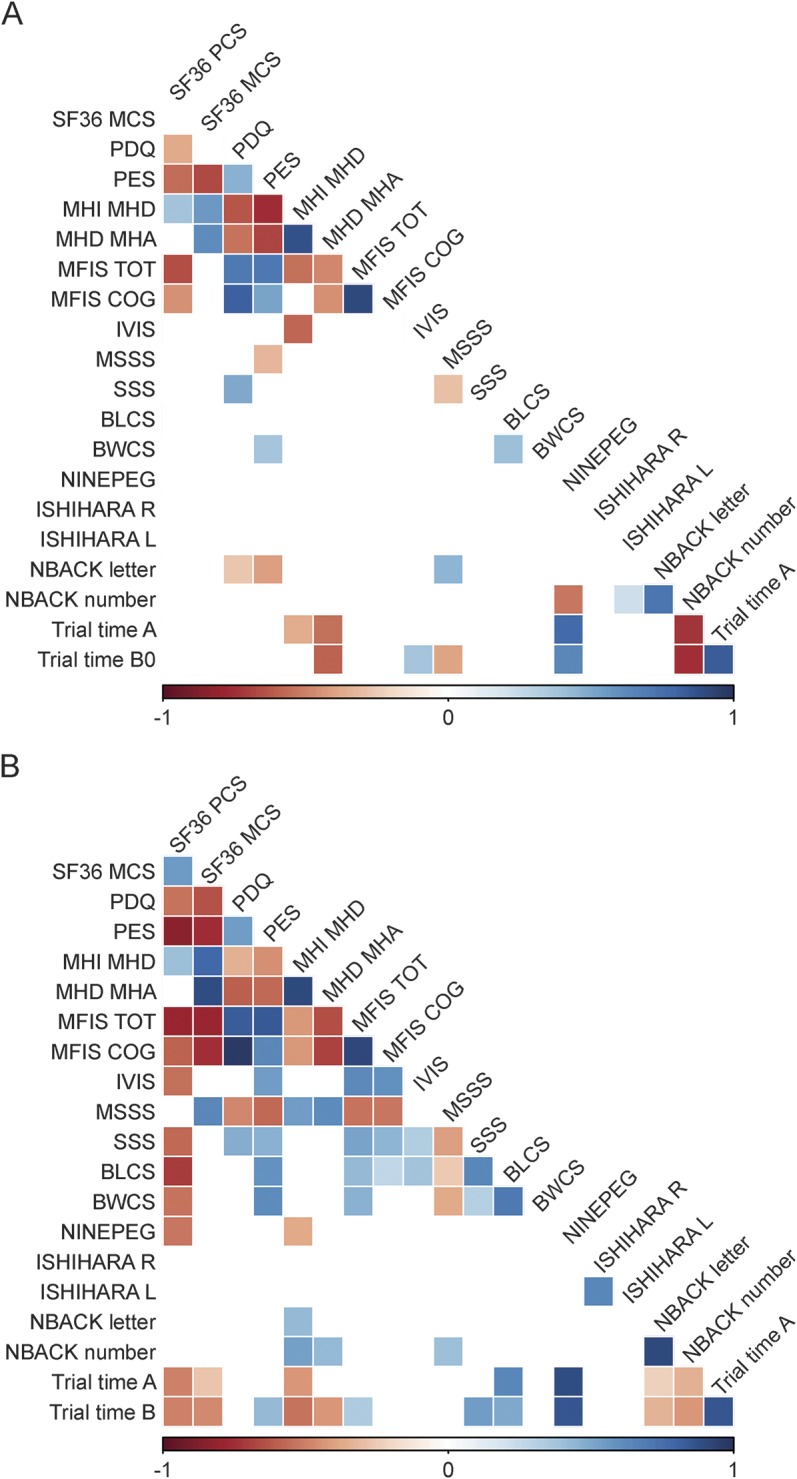
(A) The number of pairwise correlations meeting a nominal p < 0.05 significance when the first measure obtained from each participant is used. (B) The number of pairwise correlations meeting the nominal p < 0.05 threshold when the mean of all responses for an individual patient with multiple sclerosis (MS) is used, omitting a 3-test run-in. The number of significant correlations increases from 46 to 88. The intensity of the color is proportional to the strength of the correlation, with positive correlations denoted in blue and inverse correlations in red.
Having established our approach to mitigating environmental noise, we next sought to determine the point at which ongoing data collection ceases to provide additional information for a given participant. Again using Trails A to illustrate, we compared the inflection points obtained from 26 trials over 12 months to those obtained from 13 trials performed in the first 6 months, for study completers only. The optimal inflection points remained stable when the length of the trial was shortened: 12 of the 13 patients with MS (n = 22) identified as having a clear inflection point in learning when using all 26 trials were also identified when using 13 trials (92.3% overlap); 11 of these 12 patients showed a stable inflection point (±2) between the 2 trial lengths. Thus, a study of half the duration and data points may have been sufficient to accurately capture an individual's inflection point. In an additional approach to estimating an appropriate trial duration, we compared the between-test correlation matrices obtained when using 6- vs 12-month data (using means after the first 3 run-in trials for each test). We found 73 pairwise correlations using 6 months of data, compared with 85 correlations using all 12 months of data (appendix e-1 and figure e-7).
Finally, we again used Trails A to illustrate the statistical power gained to detect differences between cohorts by obtaining repeated assessments. Between our cohort of 22 patients with MS and 17 cohabitants, we had 19% power to detect a difference in Trails A mean post run-in score of 2.6 seconds at an α = 0.05 level using a 2-sample t test, using the SD of mean post run-in values.10,11 This power was 7% when using the SD obtained after the first measurement and 8% when using the SD obtained after the last measurement.
Thus, as anticipated, after allowing time for learning the task, the average measure of performance over time provided a more informative measure of an individual's performance than a random cross-sectional assessment and may provide greater statistical power to detect differences between groups.
DISCUSSION
In this 1-year study, we assessed the feasibility of data collection using the smartphone platform. We saw that both healthy participants and patients with MS are capable of completing daily tasks on a smartphone for 1 year and that new phenotypes can be derived from repeated measures captured over 6 months to 1 year. Thus, deployment of a variety of cognitive and motor tests via the smartphone platform may be a feasible way of overcoming the challenges of naturalistic data collection and of gathering highly granular data that accurately describe disease course.
Our study falls within a wider effort for more patient-powered methods of data collection. Other strategies for the remote assessment of patient symptoms and status include (1) Web-based platforms for assessment of daily symptoms requiring periodic computer log-ins (e.g., patientslikeme.com7); (2) large global MS research registries such as the North American Research Committee on MS, in which participants complete mailed questionnaires12–14; and (3) daily gait measures using accelerometer devices.15,16 All of these efforts document the urgency of finding better ways to define the disability of patients with MS. No one device or approach is sufficient to do this, so we must begin to combine complementary platforms and devices to achieve this goal.
The MSCODES3 study illustrates the potential for collecting previously uncaptured dimensions of MS disability and holds important lessons for planning future studies that will include next-generation applications that are more agile and less burdensome. First, perceived deficits in vision and cognition at study entry are associated with study dropout. In future studies, the interface will need to be improved using user-centered design to enhance study completion rates in individuals with such deficits. Second, subject-specific learning curves will be a feature of repeated data collection, and we propose an inflection-point analysis as an additional dimension of performance. We also provide empirical data on the length of observation needed to establish a robust estimate of an individual's performance; 6 months of data appeared to be sufficient. Finally, a preponderance of participants consistently responded to daily prompts to complete tasks despite not receiving regular clinical or coordinator feedback on their participation. In future studies, the impact of providing each participant with periodic feedback, whether automated or via a personalized coordinator “check-in,” must be assessed as an approach to enhance compliance and study retention. Here, the integration of patient-generated data with clinically generated data is likely to yield important advances in the area of precision medicine.17
Our study had certain limitations. First, it was not designed to identify features distinguishing participants with and without MS. Our data now enable us to design well-powered studies of this type. Second, future studies are needed to identify the panel of tests that is optimal for different MS patient subtypes (including progressive disease). Third, validation of the performance of next-generation smartphone-based tests against specific standard pen-and-paper versions (as has been performed for some of the tests that we deployed6) will be an important step in future smartphone-based endeavors. Fourth, we had significant attrition of participants over the course of the year-long study, which limits the generalizability of our results. Studying the relationship between cognitive deficits and study retention, however, will inform future study designs of this type, which was one of the primary goals of this study. Finally, our results are more illustrative and exploratory than definitive in light of the limited statistical power due to our pilot study design and the number of exploratory analyses performed.
Improving the understanding of the dynamics of our patients' symptomatic fluctuations could help to account for some of the noise in naturalistic data collection. Others have previously reported assessment of circadian rhythms in fatigue using “real-time” monitoring on wrist-worn devices.18 In the future, an improved ability to capture meaningful fluctuations in performance could result in automated flags alerting the user and authorized individuals that a change in clinical function has occurred and should be investigated. Premature today, such a clinical deployment raises important privacy issues that are technologically complex but readily addressable. What we now need to better understand are the concerns of patients regarding their comfort with passive continuous digital data acquisition and what information they may want to access.
Current strategies that rely on intermittent clinical, imaging, and neuropsychological testing in a structured setting clearly provide valuable information but have important limitations, particularly in studying the progressive phase of MS and other neurodegenerative diseases. Much remains to be done in understanding whether and how smartphone-based data can contribute clinically meaningful information; iterative development is required to move beyond traditional tests to more meaningful passively acquired data. Yet harnessing the potential and overcoming the challenges of naturalistically collected data will be an important part of deep patient phenotyping as studies are scaled to the very large sample sizes (n > 5,000) that are necessary for large endeavors such as gene discovery.
Supplementary Material
GLOSSARY
- HR
hazard ratio
- IVIS
Impact of Visual Impairment Scale
- MCS
SF-36 Mental Composite Scale
- MFIS
Modified Fatigue Inventory Scale
- MS
multiple sclerosis
- PC
principal components
- PRO
patient-reported outcome
- QOL
quality of life
- SF-36
Short Form Health Survey
Footnotes
Supplemental data at Neurology.org/nn
AUTHOR CONTRIBUTIONS
R. Bove: drafting/revising the manuscript for content, study concept and design. C.C. White: study concept and design, statistical analysis. G. Giovannoni: drafting/revising the manuscript for content, study concept and design, analysis and interpretation of data, acquisition of data, setting up consortium. B. Glanz: drafting/revising the manuscript for content, analysis and interpretation of data, acquisition of data, study supervision. V. Golubchikov: analysis and interpretation of data, acquisition of data, statistical analysis. J. Hujol: study concept and design, technology lead, architect/developer of Android app, Amazon Storage Service, and data retrieval tool. C. Jennings: drafting/revising the manuscript for content, study concept and design, analysis and interpretation of data. D. Langdon: drafting/revising the manuscript for content, study concept and design, analysis and interpretation of data. M. Lee: study concept and design, acquisition of data, study supervision. A. Legedza: drafting/revising the manuscript for content, analysis and interpretation of data, statistical analysis. J. Paskavitz: drafting/revising the manuscript for content, study concept and design, study supervision. S. Prasad: drafting/revising the manuscript for content, study concept and design, study supervision. J. Richert: drafting/revising the manuscript for content. A. Robbins: study concept and design, analysis and interpretation of data, acquisition of data, study supervision. S. Roberts: study concept and design, contribution of vital reagents/tools/patients, acquisition of data, study supervision. H. Weiner: drafting/revising the manuscript for content, study concept and design, analysis and interpretation of data, contribution of vital reagents/tools/patients, acquisition of data, statistical analysis, study supervision. R. Ramachandran: drafting/revising the manuscript for content, study concept and design, analysis and interpretation of data, acquisition of data, study supervision, obtaining funding. M. Botfield: drafting/revising the manuscript for content, study concept and design, study supervision, obtaining funding. P.L. De Jager: drafting/revising the manuscript for content, study concept and design, analysis and interpretation of data, acquisition of data, statistical analysis, study supervision.
STUDY FUNDING
This study was funded by Vertex Pharmaceuticals Incorporated.
DISCLOSURE
R. Bove received research support from NIH, National MS Society, and American Brain Foundation. C.C. White reports no disclosures. G. Giovannoni is on the scientific advisory board for Biogen-Idec, Fiveprime, Genzyme, GW Pharma, Ironwood, Merck-Serono, Novartis, Roche, Sanofi-Aventis, Synthon BV, Teva, Vertex Pharmaceuticals, Abbvie, and Canbex; received speaker honoraria from Biogen-Idec, Genzyme, GW Pharma, Merck-Serono, Novartis, Roche, and Teva; has been an editor for Multiple Sclerosis and Related Disorders; has consulted for Biogen-Idec, Fiveprime, Genzyme, GW Pharma, Ironwood, Merck-Serono, Novartis, Roche, Sanofi-Aventis, Synthon BV, Teva, Vertex Pharmaceuticals, Abbvie, and Canbex; is on the speakers' bureau for Novartis and Teva; and received research support from Genzyme. B. Glanz received research support from Merck-Serono and NIH. V. Golubchikov is a principal statistical programmer for Vertex Pharmaceuticals. J. Hujol was a software engineer at Vertex. C. Jennings received travel funding for participation in an NIH-funded conference, his spouse is employed by Ironwood Pharmaceuticals, and his spouse receives stock and stock options from Ironwood Pharmaceuticals. D. Langdon is on the scientific advisory board for Bayer and Novartis; received travel funding and/or speaker honoraria from Excemedia, Bayer, Novartis, Biogen, and Teva; is a section editor for Multiple Sclerosis and Related Disorders and European Neurological Review; receives publishing royalties from Psychology Press; has consulted for Bayer, Novartis, and Teva; is on the speakers' bureau for Excemedia, Serono, Bayer, Sanofi-Aventis, and Novartis; and received research support from Bayer, Novartis, and Biogen. M. Lee reports no disclosures. A. Legedza is a biostatistician for Vertex Pharmaceuticals. J. Paskavitz was an employee of Vertex and is currently an employee of Biogen. S. Prasad reports no disclosures. J. Richert is on the editorial board for Journal of Neurotherapeutics, is employed by Biogen, Inc, and holds stock options from them. A. Robbins reports no disclosures. S. Roberts is a director for Vertex Pharmaceuticals. H. Weiner served on the scientific advisory board for The Guthy Jackson Charitable Foundation, Teva, Biogen-Idec, Novartis, Sanofi-Aventis; has consulted for Therapix, Biogen, Novartis, Serono, Teva, and Sanofi; and received research support from National Multiple Sclerosis Society. R. Ramachandran is a director for Vertex Pharmaceuticals Inc. M. Botfeld is Vice President for Vertex Pharmaceuticals and received research support from Vertex Pharmaceuticals. P.L. De Jager is on the scientific advisory board for Teva and Genzyme/Sanofi; received speaker honoraria from Biogen-Idec, Source Healthcare Analytics, Pfizer, and Teva; is on the editorial board for Journal of Neuroimmunology and Multiple Sclerosis Journal; is an associate editor for Neuroepigenetics; and received research support from Biogen-Idec, GSK, Vertex, Genzyme/Sanofi, and National MS Society. Go to Neurology.org/nn for full disclosure forms.
REFERENCES
- 1.Busis N. Mobile phones to improve the practice of neurology. Neurol Clin 2010;28:395–410. [DOI] [PubMed] [Google Scholar]
- 2.Ferreira JJ, Godinho C, Santos AT, et al. Quantitative home-based assessment of Parkinson's symptoms: the SENSE-PARK feasibility and usability study. BMC Neurol 2015;15:89. [DOI] [PMC free article] [PubMed] [Google Scholar]
- 3.Demaerschalk BM, Vegunta S, Vargas BB, Wu Q, Channer DD, Hentz JG. Reliability of real-time video smartphone for assessing National Institutes of Health Stroke Scale scores in acute stroke patients. Stroke 2012;43:3271–3277. [DOI] [PubMed] [Google Scholar]
- 4.Watanabe N, Horikoshi M, Yamada M, et al. Adding smartphone-based cognitive-behavior therapy to pharmacotherapy for major depression (FLATT project): study protocol for a randomized controlled trial. Trials 2015;16:293. [DOI] [PMC free article] [PubMed] [Google Scholar]
- 5.Haase R, Schultheiss T, Kempcke R, Thomas K, Ziemssen T. Modern communication technology skills of patients with multiple sclerosis. Mult Scler 2013;19:1240–1241. [DOI] [PubMed] [Google Scholar]
- 6.Rudick RA, Miller D, Bethoux F, et al. The Multiple Sclerosis Performance Test (MSPT): an iPad-based disability assessment tool. J Vis Exp 2014;e51318. [DOI] [PMC free article] [PubMed] [Google Scholar]
- 7.Bove R, Secor E, Healy BC, et al. Evaluation of an online platform for multiple sclerosis research: patient description, validation of severity scale, and exploration of BMI effects on disease course. PLoS One 2013;8:e59707. [DOI] [PMC free article] [PubMed] [Google Scholar]
- 8.Polman CH, Reingold SC, Edan G, et al. Diagnostic criteria for multiple sclerosis: 2005 revisions to the “McDonald Criteria.” Ann Neurol 2005;58:840–846. [DOI] [PubMed] [Google Scholar]
- 9.Naumova EN, Must A, Laird NM. Tutorial in Biostatistics: evaluating the impact of 'critical periods' in longitudinal studies of growth using piecewise mixed effects models. Int J Epidemiol 2001;30:1332–1341. [DOI] [PubMed] [Google Scholar]
- 10.Machin D, Campbell M, Fayers P, Pinol A. Sample Size Tables for Clinical Studies, 2nd ed Malden, MA: Blackwell Science; 1997. [Google Scholar]
- 11.Zar JH. Biostatistical Analysis, 2nd ed Englewood Cliffs, NJ: Prentice Hall; 1984. [Google Scholar]
- 12.Marrie RA, Cutter G, Tyry T, Campagnolo D, Vollmer T. Validation of the NARCOMS registry: diagnosis. Mult Scler 2007;13:770–775. [DOI] [PubMed] [Google Scholar]
- 13.Marrie RA, Cutter G, Tyry T, Hadjimichael O, Campagnolo D, Vollmer T. Validation of the NARCOMS registry: fatigue assessment. Mult Scler 2005;11:583–584. [DOI] [PubMed] [Google Scholar]
- 14.Marrie RA, Cutter G, Tyry T, Hadjimichael O, Vollmer T. Validation of the NARCOMS Registry: pain assessment. Mult Scler 2005;11:338–342. [DOI] [PubMed] [Google Scholar]
- 15.Sosnoff JJ, Goldman MD, Motl RW. Real-life walking impairment in multiple sclerosis: preliminary comparison of four methods for processing accelerometry data. Mult Scler 2010;16:868–877. [DOI] [PubMed] [Google Scholar]
- 16.Shammas L, Zentek T, von Haaren B, Schlesinger S, Hey S, Rashid A. Home-based system for physical activity monitoring in patients with multiple sclerosis (Pilot study). Biomed Eng Online 2014;13:10. [DOI] [PMC free article] [PubMed] [Google Scholar]
- 17.Gourraud PA, Henry RG, Cree BA, et al. Precision medicine in chronic disease management: the multiple sclerosis BioScreen. Ann Neurol 2014;76:633–642. [DOI] [PMC free article] [PubMed] [Google Scholar]
- 18.Kim E, Lovera J, Schaben L, Melara J, Bourdette D, Whitham R. Novel method for measurement of fatigue in multiple sclerosis: Real-Time Digital Fatigue Score. J Rehabil Res Dev 2010;47:477–484. [DOI] [PubMed] [Google Scholar]
Associated Data
This section collects any data citations, data availability statements, or supplementary materials included in this article.