

Abstract
Purpose
To explore the capability of APT imaging in the detection of hemorrhagic and ischemic strokes using preclinical rat models.
Methods
The rat intracerebral hemorrhage (ICH) model (n = 10) was induced by injecting bacterial collagenase VII-S into the caudate nucleus, and the permanent ischemic stroke model (n = 10) was induced by using a 4-0 nylon suture to occlude the origin of the middle cerebral artery. APT-weighted MRI was acquired on a 4.7T animal imager and quantified using the magnetization transfer-ratio asymmetry at 3.5 ppm from water.
Results
There was a consistently high APT-weighted MRI signal in hyperacute ICH during the initial 12 hours after injection of collagenase, compared to the contralateral brain tissue. When hemorrhagic and ischemic strokes were compared, the hyperacute ICH and cerebral ischemia demonstrated opposite APT-weighted MRI contrasts, namely, hyperintense vs. hypointense compared to the contralateral brain tissue, respectively. There was a stark contrast in APT-weighted signal intensity between these two lesions.
Conclusion
APT-MRI could accurately detect hyperacute ICH and distinctly differentiate hyperacute ICH from cerebral ischemia, thus opening up the possibility of introducing to the clinic a single MRI scan for the simultaneous visualization and separation of hemorrhagic and ischemic strokes at the hyperacute stage.
Keywords: Intracerebral hemorrhage, stroke, APT imaging, CEST imaging, molecular imaging
Introduction
Stroke is a leading cause of death and disability worldwide, and is responsible for approximately five million deaths annually (1). There are two major types of stroke: ischemic and hemorrhagic. Most strokes are ischemic and potentially treatable with thrombolytic therapies that are typically given within hours of symptom onset (2, 3). Hemorrhagic strokes, including intracerebral hemorrhage (ICH) and subarachnoid hemorrhage, account for about 10–20% of all strokes and are associated with poorer prognoses and higher mortality rates (4-6). The fundamental therapies for ischemic and hemorrhagic strokes differ distinctly, and thrombolytic drugs, if administered in patients with hemorrhagic stroke, would have catastrophic consequences. Since it is impossible to determine whether symptoms are due to ischemia or hemorrhage, based on clinical characteristics alone, accurate early detection of hemorrhagic strokes with neuroimaging is crucial for all stroke patients (7, 8).
Head CT is currently the primary neuroimaging modality for the diagnosis of acute stroke in the emergency room (9). The main diagnostic advantage of CT in the hyperacute phase (<12 hours) of stroke is its ability to detect or rule out hemorrhage. However, CT has a limited sensitivity for the identification of early cerebral ischemia in the hyperacute stage. MRI is increasingly being used for the diagnosis of acute strokes. Several studies have shown that gradient-echo MRI sequences are as accurate as CT for the detection of acute hemorrhage, and far superior to CT in the chronic stage (10-12). However, like CT, these gradient-echo MRI sequences are not sensitive for the detection of early ischemia. In addition, diffusion-weighted MRI has excellent capacity to demonstrate hyperacute ischemia (13-15), but it does not seem to be specific for ischemic stroke. Currently, for safety reasons, both CT and MRI are always obtained in many stroke centers in the initial evaluation of patients with stroke. Ideally, patients would only undergo one imaging modality, MRI or CT, in order to expedite treatment and minimize cost. If MRI is used rather than CT, MRI must be able to reliably identify hemorrhagic strokes; moreover, a single MRI scan that can simultaneously detect hemorrhagic strokes and ischemic strokes at the hyperacute stage is very desirable.
Amide proton transfer (APT) imaging (16), a type of chemical exchange saturation transfer (CEST) MRI (17-20), is a potentially important molecular MRI method that can generate contrast based on tissue pH (16) or concentrations of endogenous mobile proteins and peptides (21-23). Technically, APT imaging is based on a change in bulk water intensity due to chemical exchange with magnetically labeled backbone amide protons of endogenous mobile proteins and peptides (16). Thus, specific molecular information can be obtained indirectly through the bulk water signal used for clinical imaging. Previous studies in animals and in humans have demonstrated that APT imaging is capable of early detection of an ischemic lesion (24-28), reflecting local tissue pH reduction even before a diffusion abnormality (24). Such pH reductions are manifested as a low APT-weighted (APTw) signal. In contrast, we hypothesized that hyperacute hemorrhage, containing abundant mobile proteins and peptides, would demonstrate a high APTw signal, and thus, be detectable by APT imaging. In this study, we explored the capabilities of APT imaging for the diagnosis of stroke at the molecular level, using rat models with hyperacute ICH and cerebral ischemia. This novel, non-invasive APT imaging method, which can easily indentify hemorrhage from ischemia at the hyperacute stage, has the potential to significantly improve stroke patient care.
Methods
ICH Model Preparation
Experiments were approved by the Johns Hopkins Animal Care and Use Committee. Following anesthesia with pentobarbital (65 mg/kg, i.p.), Sprague Dawley rats (male; 300-325 g; n = 10) were placed in a stereotactic frame. A midline scalp incision was made, and a burr hole was drilled in the left side of the skull (0.9 mm anterior and 3.0 lateral to bregma). To induce hemorrhage, rats were injected with bacterial collagenase VII-S (0.75 U in 1 μL saline, Sigma) unilaterally at a steady rate (0.1 μl/min, KD Scientific) into the caudate putamen through the burr hole to a depth of 5.5 mm (29-31). After injection, the needle was left in place for an additional 10 min to prevent any reflux. After removal of the needle, the incision was closed using a 5-0 nylon suture.
Ischemia Model Preparation
Sprague Dawley rats (male; 300-325 g; n = 10) were anesthetized initially with 5% isoflurane and maintained with 1.5-2% isoflurane in oxygen-enriched air with spontaneous ventilation. Transient focal cerebral ischemia was induced by occlusion of the left middle cerebral artery (MCA) with the intraluminal filament technique. A 4-0 suture (Covidien, Mansfield, MA) with round tip and silicon coating was inserted from the left external carotid artery into the internal carotid artery, and it reached the circle of Willis to occlude the origin of the middle cerebral artery.
MRI Experiments
We acquired MRI data using a 4.7T horizontal bore animal imager (Bruker Biospin, Billerica, MA) with an actively decoupled cross-coil setup (a 70-mm body coil for radiofrequency transmission and a 25-mm surface coil for signal reception) (Supporting Methods). First, high-resolution T2-weighted (T2w) imaging with a fast spin-echo sequence (echo train length = 8; repetition time (TR) = 3 s; echo time (TE) = 64 ms; slice thickness 1.5 mm; number of averages (NA) = 2) was acquired in both the horizontal plane (5 slices; matrix = 256 × 192; field of view = 42 × 32 mm2) and the coronal plane (7 slices; matrix = 192 × 192; field of view = 32 × 32 mm2).
Then, several quantitative MRI parameters were acquired, including T2 (TR = 3 s; TE =30, 40, 50, 60, 70, 80, and 90 ms; NA = 4), T1 (inversion recovery; pre-delay = 3 s; TE = 30 ms; inversion recovery time = 0.05, 0.3, 0.6, 1.8, 2.5, and 3.5 s; NA = 4), isotropic apparent diffusion constant or ADC (TR = 3 s; TE = 80 ms; b-values = 0, 166.7, 333.3, 500, 666.7, 833.3, and 1,000 s/mm2; NA = 8), blood flow (arterial spin labeling or ASL (32); 3-s labeling at a distance of 20 mm away from the imaging slice; TR = 6 s; TE = 28.6 ms), and APT (frequency-labeling offsets of ±3.5 ppm; TR = 10 s; TE = 30 ms; saturation power = 1.3 μT; saturation time = 4 s; NA = 16). A control image in the absence of radiofrequency saturation was also acquired for APT imaging signal intensity normalization. To reduce the effect of B0 field inhomogeneity on APT imaging, high-order, localized slab shimming (thickness 10.5 mm) was performed around the lesion. In addition, prior to the APT data acquisition, a magnetization transfer spectrum with a low saturation power (0.5 μT) and a narrow offset range (-0.6 to 0.6 ppm, interval 0.05 ppm) was acquired on the same APT slice. The magnetization transfer-spectrum center frequency was determined on the scanner and used to adjust the scanner transmitter frequency. Single-shot, spin-echo, echo-planar imaging was used for all quantitative MRI data acquisition (matrix = 64 × 64; field of view = 32 × 32 mm2; single-slice; slice thickness = 1.5 mm). The image slice was overlapped with one of the coronal T2w images, and all quantitative MRI sequences had the same geometry and location.
Finally, T1-weighted (T1w) images (TR = 700 ms; TE = 10 ms; NA = 10) and T2*-weighted (T2*w) images (TR = 700 ms; TE = 10 ms; NA = 10) were acquired with the same geometry and location as the T2w images.
Image Analysis
Data processing procedures were performed by Interactive Data Language (IDL, version 7; Exelis Visual Information Solutions, Inc., Boulder, CO). The images were interpolated to 384 × 384. The T1 map, T2 map, and ADC map were fitted using the following equations: I = A + B exp (-TI/T1) (where A and B are two other fitting parameters in addition to T1), I = I0 exp (-TE/T2), and I = I0 exp (-b ADC), respectively. The cerebral blood flow (CBF) map was reconstructed from images with and without labeling, using previously described methods (32). The APTw images were calculated based on the magnetization transfer ratio (MTR) asymmetry at ±3.5 ppm with respect to the water signal (16): MTRasym(3.5 ppm) = Ssat(-3.5 ppm)/S0 - Ssat(+3.5 ppm)/S0, where Ssat and S0 are the signal intensities with and without selective radiofrequency irradiation, respectively. The obtained images were interpolated to 384 × 384, thresholded based on the S0 image, and displayed using a window of -6% to 6%. For the quantitative analysis, we used the signal abnormalities on ADC maps as a basis for defining regions of interest. We used contralateral normal-appearing, relatively homogenous brain tissue for comparison. Ventricles and perilesional edema were excluded.
Statistical Analysis
The average APTw imaging intensities for the ICH, cerebral ischemia, and the corresponding contralateral brain tissue were calculated for each group, and the results were represented as mean ± standard deviation. We calculated the APTw MRI contrasts between the ICH and the contralateral brain tissue, as well as between the ischemia and the contralateral brain tissue. A paired t-test was used to determine whether these contrasts were significant. Moreover, a one-way analysis of variance test, followed by the Turkey test, was used to compare the differences in APTw intensities for the ICH and cerebral ischemia. 95% confidence intervals were calculated for the mean contrasts. The level of significance was set at P < 0.05.
Results
Hyperacute ICH Can Be Detected by APT Imaging
We first explored the radiographic features of hyperacute ICH in a rat model, using APT and several routine (T2w, T2*w, and T1w) MRI sequences. T2w MRI, acquired on the 4.7T animal imager, revealed that all rats (n = 10) developed a hemorrhagic lesion in the brain (Supporting Fig. S1). The hematoma expanded steadily and reached its maximum size (3–5 mm in diameter) at six hours post-injection. On routine T2w, T2*w, and T1w images (Fig. 1), the ICH was hypointense with respect to the contralateral brain tissue during the initial hours after the injection of collagenase and became heterogeneous (hypointense to hyperintense) at 12 hours after the injection of collagenase. Scattered foci of isointensity to slight hyperintensity could be seen on T2w images during the initial hours post-injection, and a rim of hypointensity could be observed on T2w and T1w images at 12 hours post-injection. The T2*w images demonstrated a larger lesion, but this apparent increase in size is due to the susceptibility effect between tissue and blood. The appearance of the ICH on routine MRI sequences changed over time and varied between cases (33, 34), which greatly complicates the diagnosis of ICH in the clinic.
Fig. 1.
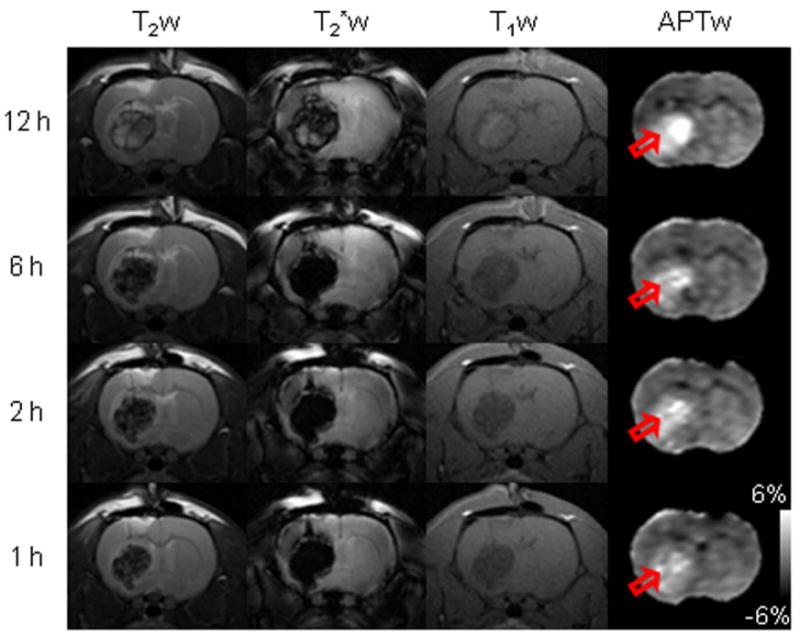
Representative routine and APTw MR images of hyperacute ICH in rats. T2w images demonstrated a well-circumscribed mass of hypointensity (with scattered foci of isointensity to slight hyperintensity) relative to the contralateral brain tissue during the initial 1-6 hours after the injection of collagenase. The lesion became heterogeneous (hypointense to hyperintense, with a rim of hypointensity) at 12 hours after the injection of collagenase. T2*w images also demonstrated a well-circumscribed mass, hypointense during the initial 1-6 hours and heterogeneous (hypointense to hyperintense) at 12 hours. T1w images showed hypointensities in the lesion during the initial 1-6 hours and slight hyperintensities (with a rim of hypointensity) at 12 hours. Notably, APTw images showed consistent hyperintensities in the lesion (red open arrow) at these hyperacute time points.
On obtained APTw images (Fig. 1), the ICH was consistently hyperintense (compared to the contralateral normal brain tissue) at all hyperacute time points. In hyperacute hemorrhage, the hematoma subsequent to vessel rupture consists of a collection of red blood cells (which are rich in hemoglobin), white blood cells, platelet clumps, and protein-rich serum (9). Therefore, the APTw hyperintensity observed in hyperacute ICH should reflect the presence of abundant mobile proteins and peptides and the gradual accumulation of blood in the growing lesion. Notably, our data showed that APTw hyperintensity is the characteristic feature of hyperacute ICH, unique from many conventional MRI sequences. The use of APT MRI has the potential to accurately identify ICH in the hyperacute stage at the molecular level.
Hyperacute ICH and Cerebral Ischemia Can Be Differentiated by APT Imaging
We further assessed the radiographic features of an ischemic stroke model in rats (n = 10), using the same MRI protocol as that for the ICH model. This permanent ischemic stroke model was created by inserting a 4-0 nylon suture into the lumen of the internal carotid artery to occlude the origin of the middle cerebral artery. The result (Supporting Fig. S2) agrees with the notion that decreased pH in the ischemic brain (about 0.5 units (35)) leads to decreased exchange rates for amide protons, and thus, the decreased APTw MRI signal (about 2% (36)).
To demonstrate the value of APT imaging in detecting both hyperacute ICH and cerebral ischemia, we compared the multi-parametric MRI features of these two pathologies in rat models, using T2, T1, isotropic ADC, CBF, and APTw sequences. In all cases of ICH, T2 maps showed heterogeneous, but primarily hypointense signal in the lesions, and T1 maps showed heterogeneous, but primarily hyperintense signal in the lesions, compared to the contralateral brain tissue (Fig. 2). However, as expected, both T2 and T1 maps were not sensitive enough to detect early ischemia at one and six hours post-occlusion. In hyperacute cerebral ischemia, the mismatch between diffusion and perfusion abnormalities is typically used to discover the salvageable penumbra and predict tissue outcome (13-15). However, neither ADC nor CBF maps were very specific for ICH and ischemia, demonstrating primary hypointensities in both types of lesions, except for some hyperintense ADC signal inside the ICH. Notably, APTw images showed a quite different APTw MRI appearance in ICH (hyperintense compared to the contralateral brain tissue) and cerebral ischemia (hypointense compared to the contralateral brain tissue); thus, a stark APTw contrast in signal intensity can be observed between these two pathologies.
Fig. 2.
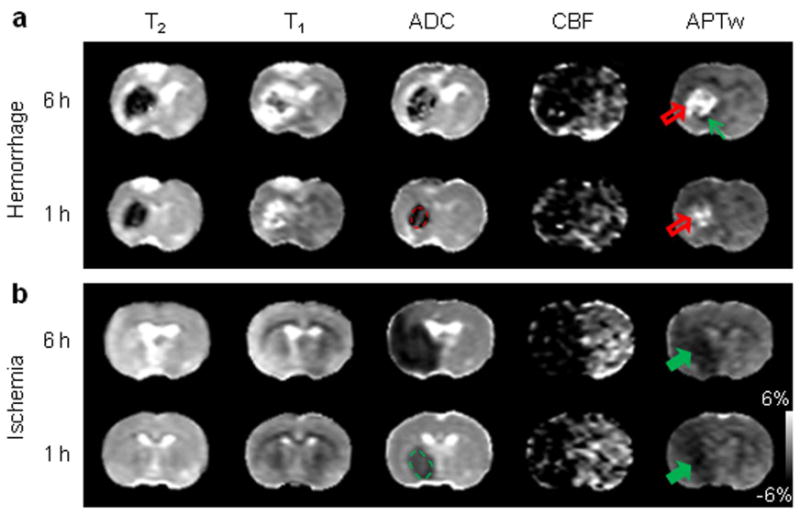
Comparison of multi-parametric MRI features of hyperacute ICH and cerebral ischemia. a: ICH at one and six hours after the injection of collagenase (red open arrow). b: Cerebral ischemia at one and six hours after occlusion of the middle cerebral artery (green solid arrow). The display windows are T2 (25 to 75 ms), T1 (1 to 2 sec), ADC (0.4 to 1.2×10⁻⁹ m2/sec), blood flow (0 to 120 ml/100g/min), and APTw (-6% to 6% of the bulk water signal intensity). ADC and CBF maps showed a primarily hypointense signal in both pathologies. Areas of perfusion abnormality are larger than areas of diffusion abnormality. APTw MRI showed hyperintensity in ICH (red open arrow), but hypointensity (green solid arrow) in cerebral ischemia at both time points. Possible perihematomal ischemia (APTw hypointense, green thin arrow) was seen at six hours post-injection. APT MRI provided a stark image contrast between ICH and cerebral ischemia at the hyperacute stage. Examples of regions of interest for quantitative image analysis are shown with yellow dashed lines.
The superior value of APT MRI in distinguishing intracranial hemorrhage from cerebral ischemia was also demonstrated in a rat with both subdural hemorrhage and cerebral ischemia (Fig. 3), in which completely opposite APTw MRI signals were apparent (hyperintensity vs. hypointensity compared to the contralateral brain tissue, respectively).
Fig. 3.
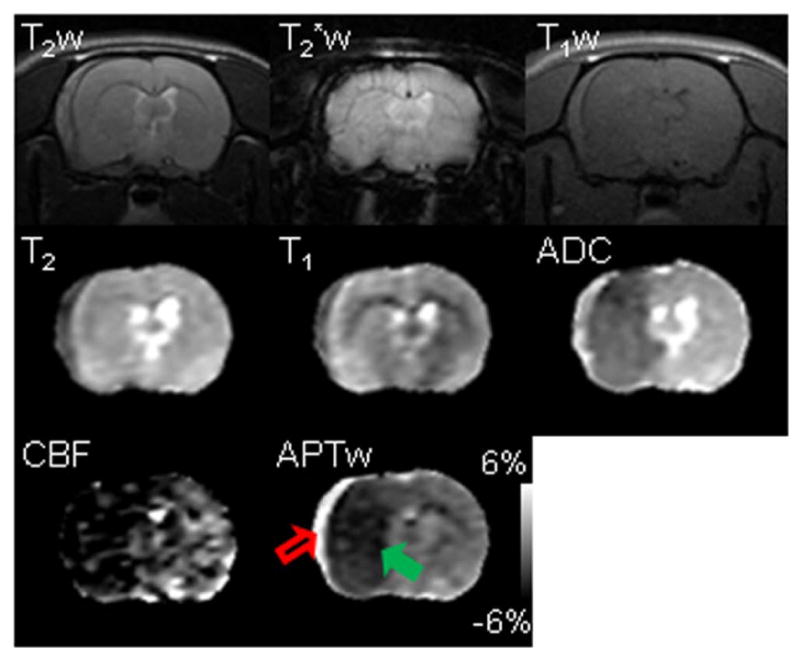
Multi-parametric MRI features of subarachnoid hemorrhage (red open arrow) and cerebral ischemia (green solid arrow) in a rat at one hour post MCAO. Subarachnoid hemorrhage was induced by injury to the vessel when preparing the MCAO model. This rat was sacrificed after MRI, and the subarachnoid hemorrhage was confirmed by the direct observation. The display windows are T2 (25 to 75 ms), T1 (1 to 2 sec), ADC (0.4 to 1.2×10⁻⁹ m2/sec), blood flow (0 to 120 ml/100g/min), and APTw (-6% to 6% of the bulk water signal intensity). APTw MRI demonstrated the starkest contrast between the hematoma and ischemia (hyperintense or hypointense with respect to the contralateral tissue, respectively).
Histologic evaluation (Supporting Methods) was performed to confirm the APTw MRI findings in rat models of hyperacute ICH and cerebral ischemia (Fig. 4). We acquired brain samples at 12 hours post-injection/occlusion, and selected coronal brain sections at the level of MR images for Cresyl violet staining (Nissl staining). Low-magnification histology images clearly showed the injured regions, which were consistent with MRI results. High-magnification histology images revealed a lack of Cresyl violet-stained positive cells in both the hemorrhagic and ischemic lesions, indicating a marked neuronal loss in the damaged areas; moreover, needle- or star-shaped hemoglobin crystals and broken red blood cells were obviously observed in the core of the ICH lesion, which could be the histopathologic basis of the opposite APTw MRI signals in hyperacute ICH and cerebral ischemia. Unlike the subarachnoid hemorrhage (Fig. 3), the edge of the ICH was actually mixed blood (APTw hyperintensity) and some brain tissue (APTw hypointensity). Therefore, the APTw signal appeared as a continuation at the edge of the lesion due to the different tissue contamination.
Fig. 4.
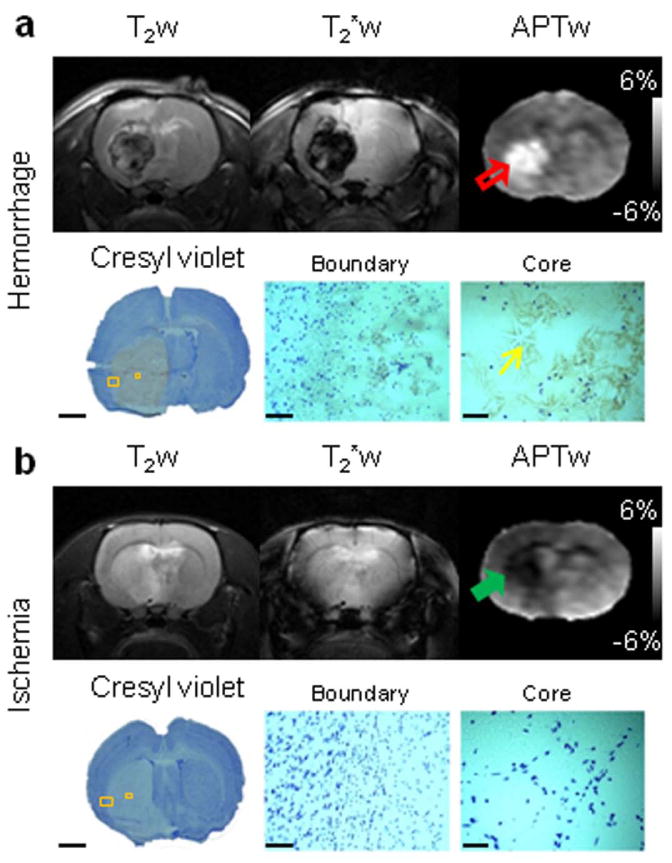
Representative routine and APTw MR images of hyperacute ICH (a) and cerebral ischemia (b) at 12 hours post-injection/occlusion and corresponding Cresyl violet-stained sections of rat brains. APTw images showed hyperintensity (red open arrow) and hypointensity (green solid arrow) in the hemorrhagic and ischemic lesions, respectively. The Cresyl violet-stained brain sections indicated injured territories, as shown by APTw MRI. High-magnification images showed a marked loss of Nissl staining (neuronal loss) in the injured cores. Hemoglobin crystals (yellow thin arrow) were clearly visualized in the hemorrhagic lesion. Scale bars: 3 mm (low-magnification images), 0.1 mm (high-magnification boundary images), and 0.05 mm (high-magnification core images).
Quantitative Comparison of MRI Signal Intensities
We finally quantitatively analyzed the APTw image intensities for hyperacute ICH and cerebral ischemia in rat models and their longitudinal changes at the hyperacute stage (Fig. 5a). In the case of ICH, the average APTw MRI signal intensities at 1, 2, 6, and 12 hours after the injection of collagenase were all significantly higher in the lesions than in contralateral brain areas (all P < 0.001; n = 10), and the average APTw MRI contrasts between the ICH and the contralateral brain tissue were 3.3% (95% confidence interval, 2.7% to 3.9%), 3.9% (2.8% to 5.1%), 3.3% (2.3 to 4.4%), and 3.8% (3.0% to 4.6%), respectively. In cerebral ischemia, the average APTw MRI signal intensities at 1, 2, 6, and 12 hours after occlusion of the middle cerebral artery were all significantly lower in the lesions than in the contralateral brain areas (all P < 0.001; n = 10). The corresponding average APTw MRI contrasts between the ischemic lesion and contralateral brain tissue, at these time points, were -2.3% (95% confidence interval, -2.9% to -1.7%), -2.4% (-2.8% to -2.1%), -2.5% (-2.9% to -2.0%), and -3.1% (-3.3% to -2.8%), respectively. A further comparison between the hyperacute ICH and cerebral ischemia showed that APTw MRI signal intensities were significantly higher in ICH than in ischemia at the time points tested at the hyperacute stage (all P < 0.001; n = 10). The average APTw MRI contrasts between these two pathologies were 5.5% (95% confidence interval, 3.8% to 7.2%), 6.2% (4.7% to 7.8%), 6.6% (4.8% to 8.5%), and 7.3% (5.0% to 9.5%) at 1, 2, 6, and 12 hours, respectively, post-injection/occlusion. Compared with routine MRI sequences (Supporting Fig. S3), APTw MRI signals may provide the most reliable non-invasive imaging biomarker with which to identify ICH and ischemia at the hyperacute stage.
Fig. 5.
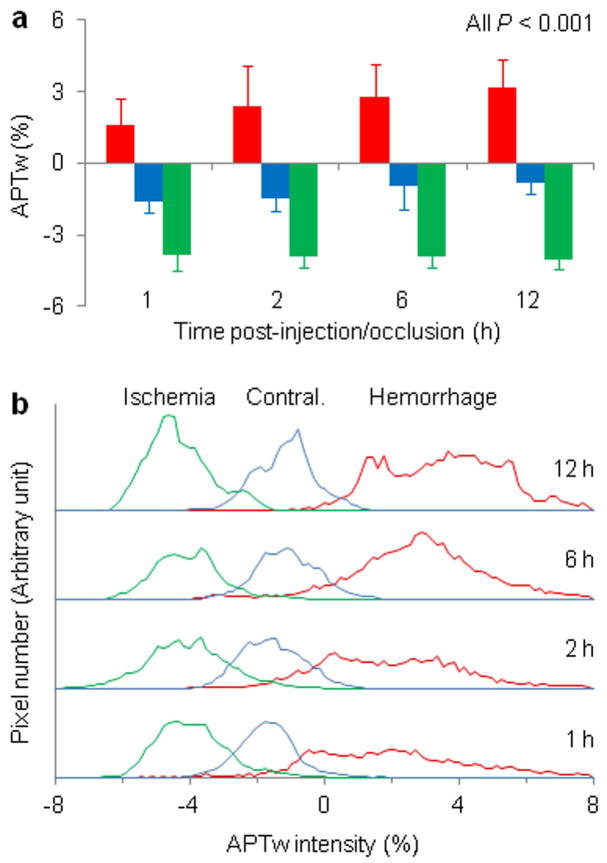
Quantitative analysis of APTw signal intensities (in percentage change of bulk water signal intensity) of hyperacute ICH and cerebral ischemia in rat models at several time points post-injection/occlusion (n = 10 each group). a: Comparison of average APTw signal intensities. Hyperacute ICH (red bar) and cerebral ischemia (green bar) showed opposite APTw MRI signals. With the saturation settings used in this study, the APTw signal in the contralateral brain tissue (blue bar) was slightly negative. b: Histogram analysis of APTw signal intensities. The histograms for these two pathologies demonstrated negligible overlaps at all time points.
APTw MRI intensity histograms for hyperacute ICH and cerebral ischemia were also compared to reveal the inhomogeneities of these lesions (Fig. 5b). These histograms were calculated in the same regions of interest as the average APTw intensities in Fig. 4a. Compared to the ischemic lesions, the ICH showed a wider distribution, reflecting a larger APTw intensity inhomogeneity. The ICH histograms demonstrated a slight shift to the right with increasing time. Both lesions increased in size with time. Notably, the histograms for hyperacute ICH and cerebral ischemia demonstrated negligible overlap at all time points, suggesting a distinct contrast in signal intensity between these two pathologies.
Discussion
We have evaluated the ability to use the APTw MRI signal of endogenous mobile proteins and peptides as an imaging biomarker to identify hemorrhage, a crucial first step in the clinical stroke exam that is often performed by CT (9). Based on this preclinical study, hyperacute ICH was consistently hyperintense relative to contralateral normal brain tissue on APTw images. Notably, hyperacute ICH and ischemia (including perihematomal ischemia (37, 38)) demonstrated opposite APTw MRI signals (hyperintense vs. hypointense relative to contralateral normal brain tissue, respectively), which is never possible by any other MRI methods.
Theoretically, the APT effect in tissue is primarily related to the mobile amide proton content and the amide proton exchange rate (a parameter that depends on tissue pH), and is concurrent with the effects of direct water saturation (spillover) and semi-solid magnetization transfer (16). When the MTR asymmetry analysis is used to remove these concurrent effects, the quantified APTw signal intensity is more or less contaminated by the upfield nuclear Overhauser enhancement (NOE) effect (39). Therefore, care should be taken when interpreting MTR asymmetry-based APTw signal intensities. A better data acquisition or processing approach for isolating the APT signal from various concurrent saturation effects is currently an interesting research topic (40-44). However, our recent studies show that the downfield APT effect is generally the major contributor to the APTw image contrast in a brain lesion relative to the normal brain tissue at any saturation power (45, 46). Further, whether the APT effect in tissue is related to the water T1 and the water content is currently still under debate (47). However, as described previously (16), the increasing water T1 is often associated with the higher water content in many brain diseases (48); thus, the effects of these two changes on APT imaging may most be canceled out. In this study, APTw hyperintensity in hyperacute ICH was primarily attributable to the presence of abundant erythrocytes and other plasma proteins and peptides in the newly formed hematoma. In addition, a higher pH in the hematoma (∼0.2 pH units) relative to brain tissue may further increase the APTw contrast, although extra validation experiments are required. APTw hyperintensities in blood have previously been observed in pure blood experiments (49) and in many brain lesions (21, 50). In contrast, APTw hypointensity in ischemic stroke was primarily attributable to tissue acidosis following impaired aerobic metabolism. It is important to point out that hematomas usually seen in patients are much larger (51), which would favorably increase the APT-MRI detection sensitivity due to less tissue contamination. Therefore, APT imaging, which can simultaneously and accurately detect hyperacute ICH and cerebral ischemia, would be an ideal neuroimaging modality for assessing patients with acute stroke in the clinic.
The CEST mechanism has opened a new avenue of molecular MRI research. MRI based on CEST has been widely used to detect various low-concentration biomolecules (52-57) and tissue physico-chemical properties (pH and even temperature) that influence the exchange rate (16, 58). Among potentially important CEST applications, APT imaging works well on standard 3T clinical MRI scanners (27, 28, 59) and 4.7T animal MRI imagers (as showed in the current study), while several other techniques that utilize relatively fast exchanging protons require ultra-high magnetic fields (>7T) to achieve the slow-to-intermediate exchange requirement for CEST imaging. Based on the time-interleaved, parallel radiofrequency transmission approach, it has become possible to perform whole-brain APT imaging in a few minutes on 3T MRI scanners (60). Therefore, the findings obtained in this study can readily be translated to the clinic, which could significantly improve stroke patient care by initiating an optimal neuroimaging exam.
Finally, we would like to point out one limitation to this study. The effect of B0 field inhomogeneity on APT imaging is a major concern, particularly on humans or under ultrahigh B0 fields (>7T). When the asymmetry analysis is used, the poor B0 field homogeneity may result in a change of a few percentage points in the asymmetry data. There are two possibilities, one of which is the B0 inhomogeneity inside the slices, and the other of which is the uniform B0 shift of all voxels. In this study, only slab shimming around the image slice and adjustment of the scanner transmitter frequency (F0) were performed prior to APT data acquisition. Thus, the in-plane B0 inhomogeneity artifacts may exist in the obtained APTw images, especially at the hematoma edges and near interfaces, where relative large B0 changes may happen. However, it is interesting that the B0-correected (voxel-by-voxel) and F0-corrected (with the scanner transmitter frequency adjustment, used in this study) APTw signal intensities were always quite similar, even in the ICH lesions (Supporting Fig. S4). Although the APTw images and quantitative analysis results obtained in this study are reasonably correct, our recent protocol of acquiring three frequencies around ±3.5 ppm and multiple acquisitions should be utilized (61), and the corrections for the remaining B0 artifacts on a voxel-by-voxel basis should generally be performed in the future study.
Conclusion
A crucial first step in the clinical stroke exam is to determine whether the stroke is ischemic or hemorrhagic. In this study, we applied the novel APT-MRI approach to ICH and cerebral ischemia models in rats at 4.7T. The data showed that there was a consistently high APT-weighted MRI signal in hyperacute ICH, compared to the contralateral brain tissue. Thus, one could reliably detect hyperacute ICH by APT-weighted MRI. When hemorrhagic and ischemic strokes were compared, the hyperacute ICH and cerebral ischemia demonstrated opposite APT-weighted MRI contrasts, namely, hyperintense vs. hypointense compared to contralateral brain tissue, respectively. There was a stark contrast in APT-weighted signal intensity between these two lesions. Thus, one could accurately differentiate hyperacute ICH from cerebral ischemia by APT-weighted MRI. The use of APT MRI has the potential to introduce a totally new molecular neuroimaging approach to the clinic for the accurate simultaneous detection and separation of hemorrhagic and ischemic strokes at the hyperacute stage.
Supplementary Material
Supporting Methods: Supporting FIG. S1. Representative morphological features of ICH at different time points (1–12 hours) at the hyperacute stage in rats, as revealed by the T2w images. The hematoma (red open arrow) expanded gradually. The lesion was hypointense, with scattered foci of isointensity or slight hyperintensity, compared to the contralateral brain tissue, during the initial hours post-collagenase injection and became heterogeneous (hypointense to hyperintense) 12 hours later. The size of the hematoma reached the maximum at six hours post-injection.
Supporting FIG. S2. Representative multi-parametric MRI features of cerebral ischemia in rats at one hour post MCAO. The display windows are T2 (0 to 100 ms), T1 (0 to 3 sec), ADC (0 to 1.6×10⁻⁹ m2/sec), blood flow (0 to 200 ml/100g/min), and APTw (-6% to 6% of the bulk water signal intensity). As expected, T2w, T2*w, and T1w images, as well as T2 and T1 maps were not sensitive enough to detect hyperacute cerebral ischemia at one hour post-occlusion, while CBF and ADC abnormalities were clearly visible in acute cerebral ischemia. As reported previously (16, 24-28), APT imaging was also able to detect an ischemic lesion (green solid arrow) that is associated with local tissue acidosis following impaired aerobic metabolism and demonstrated a low APTw pH MRI signal.
Supporting FIG. S3. Quantitative analysis of multi-parametric MRI signal intensities (T2, T1, ADC, blood flow) in rat models of hyperacute ICH (red bar; n = 10) and cerebral ischemia (green bar; n = 10) at different time points post-injection/occlusion. The MRI signal intensities of contralateral normal brain tissue (blue bar) were also compared. Some apparently negative blood flow values were due to low signal-to-noise ratios and not meaningful. Statistical significances between the ICH and the contralateral brain, between the ischemia and the contralateral brain, as well as between the ICH and the cerebral ischemia were: * P < 0.05; ** P < 0.01; *** P < 0.001; not marked = not significant.
Supporting FIG. S4. Representative MTRasym spectra, ΔB0 maps, and APTw MR images of hyperacute ICH (a) and cerebral ischemia (b) in rats at 6 hours post-injection/occlusion. The display windows are: ΔB0 (-100 to 100 Hz) and APTw (-6% to 6% of the bulk water signal intensity).
Acknowledgments
The authors thank M. McAllister for editorial assistance. This work was supported in part by grants from the National Institutes of Health (R01NS083435, R01EB009731, R01CA166171, R21EB015555, K01AG031926, R01NS078026, R01AT007317, R01NS038684, R01EB015032, and P41EB015909), the American Heart Association (13GRNT15730001), and the National Natural Science Foundation of China (812111480).
Footnotes
Supporting Information: Additional Supporting Information may be found in the online version of this article.
References
- 1.Feigin VL, Lawes CMM, Bennett DA, Barker-Collo SI, Parag V. Worldwide stroke incidence and early case fatality reported in 56 population-based studies: a systematic review. Lancet Neurology. 2009;8:355–369. doi: 10.1016/S1474-4422(09)70025-0. [DOI] [PubMed] [Google Scholar]
- 2.NINDS rt-PA Stroke Study Group. Tissue plasminogen activation for acute ischemic stroke. N Engl J Med. 1995;333:1581–1587. doi: 10.1056/NEJM199512143332401. [DOI] [PubMed] [Google Scholar]
- 3.Balami JS, Hadley G, Sutherland BA, Karbalai H, Buchan AM. The exact science of stroke thrombolysis and the quiet art of patient selection. Brain. 2013;136:3528–3553. doi: 10.1093/brain/awt201. [DOI] [PubMed] [Google Scholar]
- 4.Qureshi AI, Tuhrim S, Broderick JP, Batjer HH, Hondo H, Hanley DF. Spontaneous intracerebral hemorrhage. N Engl J Med. 2001;344:1450–1460. doi: 10.1056/NEJM200105103441907. [DOI] [PubMed] [Google Scholar]
- 5.Wang J. Preclinical and clinical research on inflammation after intracerebral hemorrhage. Prog Neurobiol. 2010;92:463–477. doi: 10.1016/j.pneurobio.2010.08.001. [DOI] [PMC free article] [PubMed] [Google Scholar]
- 6.Balami JS, Buchan AM. Complications of intracerebral haemorrhage. Lancet Neurol. 2012;11:101–118. doi: 10.1016/S1474-4422(11)70264-2. [DOI] [PubMed] [Google Scholar]
- 7.Kidwell CS, Wintermark M. Imaging of intracranial haemorrhage. Lancet Neurol. 2008;7:256–267. doi: 10.1016/S1474-4422(08)70041-3. [DOI] [PubMed] [Google Scholar]
- 8.Morgenstern LB, Hemphill JC, 3rd, Anderson C, Becker K, Broderick JP, Connolly ES, Jr, Greenberg SM, Huang JN, MacDonald RL, Messe SR, Mitchell PH, Selim M, Tamargo RJ. Guidelines for the management of spontaneous intracerebral hemorrhage: a guideline for healthcare professionals from the American Heart Association/American Stroke Association. Stroke. 2010;41:2108–2129. doi: 10.1161/STR.0b013e3181ec611b. [DOI] [PMC free article] [PubMed] [Google Scholar]
- 9.Smith EE, Rosand J, Greenberg SM. Hemorrhagic stroke. Neuroim Clin N Am. 2005;15:259–272. doi: 10.1016/j.nic.2005.05.003. [DOI] [PubMed] [Google Scholar]
- 10.Schellinger PD, Jansen O, Fiebach JB, Hacke W, Sartor K. A standardized MRI stroke protocol: comparison with CT in hyperacute intracerebral hemorrhage. Stroke. 1999;30:765–768. doi: 10.1161/01.str.30.4.765. [DOI] [PubMed] [Google Scholar]
- 11.Kidwell CS, Chalela JA, Saver JL, Starkman S, Hill MD, Demchuk AM, Butman JA, Patronas N, Alger JR, Latour LL, Luby ML, Baird AE, Leary MC, Tremwel M, Ovbiagele B, Fredieu A, Suzuki S, Villablanca JP, Davis S, Dunn B, Todd JW, Ezzeddine MA, Haymore J, Lynch JK, Davis U, Warach S. Comparison of MRI and CT for detection of acute intracerebral hemorrhage. JAMA : the journal of the American Medical Association. 2004;292:1823–1830. doi: 10.1001/jama.292.15.1823. [DOI] [PubMed] [Google Scholar]
- 12.Siddiqui FM, Bekker SV, Qureshi AI. Neuroimaging of hemorrhage and vascular defects. Neurotherapeutics. 2011;8:28–38. doi: 10.1007/s13311-010-0009-x. [DOI] [PMC free article] [PubMed] [Google Scholar]
- 13.Warach S, Dashe JF, Edelman RR. Clinical outcome in ischemic stroke predicted by early diffusion-weighted and perfusion magnetic resonance imaging: a preliminary analysis. J Cereb Blood Flow Metab. 1996;16:53–59. doi: 10.1097/00004647-199601000-00006. [DOI] [PubMed] [Google Scholar]
- 14.Shen Q, Ren HX, Cheng HY, Fisher M, Duong TQ. Functional, perfusion and diffusion MRI of acute focal ischemic brain injury. J Cereb Blood Flow Metab. 2005;25:1265–1279. doi: 10.1038/sj.jcbfm.9600132. [DOI] [PMC free article] [PubMed] [Google Scholar]
- 15.Hjort N, Christensen S, Solling C, Ashkanian M, Wu O, Rohl L, Gyldensted C, Andersen G, Ostergaard L. Ischemic injury detected by diffusion imaging 11 minutes after stroke. Ann Neurol. 2005;58:462–465. doi: 10.1002/ana.20595. [DOI] [PubMed] [Google Scholar]
- 16.Zhou J, Payen J, Wilson DA, Traystman RJ, van Zijl PCM. Using the amide proton signals of intracellular proteins and peptides to detect pH effects in MRI. Nature Med. 2003;9:1085–1090. doi: 10.1038/nm907. [DOI] [PubMed] [Google Scholar]
- 17.Ward KM, Aletras AH, Balaban RS. A new class of contrast agents for MRI based on proton chemical exchange dependent saturation transfer (CEST) J Magn Reson. 2000;143:79–87. doi: 10.1006/jmre.1999.1956. [DOI] [PubMed] [Google Scholar]
- 18.Zhou J, van Zijl PC. Chemical exchange saturation transfer imaging and spectroscopy. Progr NMR Spectr. 2006;48:109–136. [Google Scholar]
- 19.Sherry AD, Woods M. Chemical exchange saturation transfer contrast agents for magnetic resonance imaging. Annu Rev Biomed Eng. 2008;10:391–411. doi: 10.1146/annurev.bioeng.9.060906.151929. [DOI] [PMC free article] [PubMed] [Google Scholar]
- 20.Kogan F, Hariharan H, Reddy R. Chemical exchange saturation transfer (CEST) imaging: Description of technique and potential clinical applications. Curr Radiol Reports. 2013;1:102–114. doi: 10.1007/s40134-013-0010-3. [DOI] [PMC free article] [PubMed] [Google Scholar]
- 21.Wen Z, Hu S, Huang F, Wang X, Guo L, Quan X, Wang S, Zhou J. MR imaging of high-grade brain tumors using endogenous protein and peptide-based contrast. NeuroImage. 2010;51:616–622. doi: 10.1016/j.neuroimage.2010.02.050. [DOI] [PMC free article] [PubMed] [Google Scholar]
- 22.Zhou J, Tryggestad E, Wen Z, Lal B, Zhou T, Grossman R, Wang S, Yan K, Fu DX, Ford E, Tyler B, Blakeley J, Laterra J, van Zijl PCM. Differentiation between glioma and radiation necrosis using molecular magnetic resonance imaging of endogenous proteins and peptides. Nature Med. 2011;17:130–134. doi: 10.1038/nm.2268. [DOI] [PMC free article] [PubMed] [Google Scholar]
- 23.Sagiyama K, Mashimo T, Togao O, Vemireddy V, Hatanpaa KJ, Maher EA, Mickey BE, Pan E, Sherry AD, Bachoo RM, Takahashi M. In vivo chemical exchange saturation transfer imaging allows early detection of a therapeutic response in glioblastoma. Proc Natl Acad Sci (USA) 2014;111:4542–4547. doi: 10.1073/pnas.1323855111. [DOI] [PMC free article] [PubMed] [Google Scholar]
- 24.Sun PZ, Zhou J, Sun W, Huang J, van Zijl PCM. Detection of the ischemic penumbra using pH-weighted MRI. J Cereb Blood Flow Metab. 2007;27:1129–1136. doi: 10.1038/sj.jcbfm.9600424. [DOI] [PubMed] [Google Scholar]
- 25.Jokivarsi KT, Grohn HI, Grohn OH, Kauppinen RA. Proton transfer ratio, lactate, and intracellular pH in acute cerebral ischemia. Magn Reson Med. 2007;57:647–653. doi: 10.1002/mrm.21181. [DOI] [PubMed] [Google Scholar]
- 26.Jin T, Wang P, Zong X, Kim SG. MR imaging of the amide-proton transfer effect and the pH-insensitive nuclear overhauser effect at 9.4.T. Magn Reson Med. 2013;69:760–770. doi: 10.1002/mrm.24315. [DOI] [PMC free article] [PubMed] [Google Scholar]
- 27.Tietze A, Blicher J, Mikkelsen IK, Ostergaard L, Strother MK, Smith SA, Donahue MJ. Assessment of ischemic penumbra in patients with hyperacute stroke using amide proton transfer (APT) chemical exchange saturation transfer (CEST) MRI. NMR Biomed. 2014;27:163–174. doi: 10.1002/nbm.3048. [DOI] [PMC free article] [PubMed] [Google Scholar]
- 28.Tee YK, Harston GW, Blockley N, Okell TW, Levman J, Sheerin F, Cellerini M, Jezzard P, Kennedy J, Payne SJ, Chappell MA. Comparing different analysis methods for quantifying the MRI amide proton transfer (APT) effect in hyperacute stroke patients. NMR Biomed. 2014;27:1019–1029. doi: 10.1002/nbm.3147. [DOI] [PMC free article] [PubMed] [Google Scholar]
- 29.Rosenberg GA, Mun-Bryce S, Wesley M, Kornfeld M. Collagenase-induced intracerebral hemorrhage in rats. Stroke. 1990;21:801–807. doi: 10.1161/01.str.21.5.801. [DOI] [PubMed] [Google Scholar]
- 30.Del Bigio MR, Yan HJ, Buist R, Peeling J. Experimental intracerebral hemorrhage in rats. Magnetic resonance imaging and histopathological correlates Stroke. 1996;27:2312–2319. doi: 10.1161/01.str.27.12.2312. [DOI] [PubMed] [Google Scholar]
- 31.MacLellan CL, Silasi G, Poon CC, Edmundson CL, Buist R, Peeling J, Colbourne F. Intracerebral hemorrhage models in rat: comparing collagenase to blood infusion. J Cereb Blood Flow Metab. 2008;28:516–525. doi: 10.1038/sj.jcbfm.9600548. [DOI] [PubMed] [Google Scholar]
- 32.Williams DS, Detre JA, Leigh JS, Koretsky AP. Magnetic resonance imaging of perfusion using spin inversion of arterial water. Proc Natl Acad Sci (USA) 1992;89:212–216. doi: 10.1073/pnas.89.1.212. [DOI] [PMC free article] [PubMed] [Google Scholar]
- 33.Bradley WG. MR appearance of hemorrhage in the brain. Radiology. 1993;189:15–26. doi: 10.1148/radiology.189.1.8372185. [DOI] [PubMed] [Google Scholar]
- 34.Fiebach JB, Schellinger PD, Gass A, Kucinski T, Siebler M, Villringer A, Olkers P, Hirsch JG, Heiland S, Wilde P, Jansen O, Rother J, Hacke W, Sartor K, B5 KS. Stroke magnetic resonance imaging is accurate in hyperacute intracerebral hemorrhage - A multicenter study on the validity of stroke imaging. Stroke. 2004;35:502–506. doi: 10.1161/01.STR.0000114203.75678.88. [DOI] [PubMed] [Google Scholar]
- 35.Kintner DB, Anderson MK, Fitzpatrick JH, Sailor KA. 31P-MRS-based determination of brain intracellular and interstitial pH: Its application to in vivo H+ compartmentation and cellular regulation during hypoxic/ischemic conditions. Neurochem Res. 2000;25:1385–1396. doi: 10.1023/a:1007664700661. [DOI] [PubMed] [Google Scholar]
- 36.Zhou JY, van Zijl PCM. Defining an acidosis-based ischemic penumbra from pH-weighted MRI. Transl Stroke Res. 2012;3:76–83. doi: 10.1007/s12975-011-0110-4. [DOI] [PMC free article] [PubMed] [Google Scholar]
- 37.Knight RA, Han Y, Nagaraja TN, Whitton P, Ding J, Chopp M, Seyfried DM. Temporal MRI assessment of intracerebral hemorrhage in rats. Stroke. 2008;39:2596–2602. doi: 10.1161/STROKEAHA.107.506683. [DOI] [PMC free article] [PubMed] [Google Scholar]
- 38.Kang DW, Han MK, Kim HJ, Yun SC, Jeon SB, Bae HJ, Kwon SU, Kim JS. New ischemic lesions coexisting with acute intracerebral hemorrhage. Neurology. 2012;79:848–855. doi: 10.1212/WNL.0b013e3182648a79. [DOI] [PubMed] [Google Scholar]
- 39.Ling W, Regatte RR, Navon G, Jerschow A. Assessment of glycosaminoglycan concentration in vivo by chemical exchange-dependent saturation transfer (gagCEST) Proc Natl Acad Sci (USA) 2008;105:2266–2270. doi: 10.1073/pnas.0707666105. [DOI] [PMC free article] [PubMed] [Google Scholar]
- 40.Sun PZ, Benner T, Kumar A, Sorensen AG. Investigation of optimizing and translating pH-sensitive pulsed-chemical exchange saturation transfer (CEST) imaging to a 3T clinical scanner. Magn Reson Med. 2008;60:834–841. doi: 10.1002/mrm.21714. [DOI] [PMC free article] [PubMed] [Google Scholar]
- 41.Zaiss M, Schmitt B, Bachert P. Quantitative separation of CEST effect from magnetization transfer and spillover effects by Lorentzian-line-fit analysis of z-spectra. J Magn Reson. 2011;211:149–155. doi: 10.1016/j.jmr.2011.05.001. [DOI] [PubMed] [Google Scholar]
- 42.Lee JS, Regatte RR, Jerschow A. Isolating chemical exchange saturation transfer contrast from magnetization transfer asymmetry under two-frequency rf irradiation. J Magn Reson. 2012;215:56–63. doi: 10.1016/j.jmr.2011.12.012. [DOI] [PMC free article] [PubMed] [Google Scholar]
- 43.Zaiss M, Bachert P. Chemical exchange saturation transfer (CEST) and MR Z-spectroscopy in vivo: a review of theoretical approaches and methods. Phys Med Biol. 2013;58:R221–R269. doi: 10.1088/0031-9155/58/22/R221. [DOI] [PubMed] [Google Scholar]
- 44.Sowell ER, Thompson PM, Leonard CM, Welcome SE, Kan E, Toga AW. Longitudinal mapping of cortical thickness and brain growth in normal children. J Neurosci. 2004;24:8223–8231. doi: 10.1523/JNEUROSCI.1798-04.2004. [DOI] [PMC free article] [PubMed] [Google Scholar]
- 45.Zhou J, Hong X, Zhao X, Gao JH, Yuan J. APT-weighted and NOE-weighted image contrasts in glioma with different RF saturation powers based on magnetization transfer ratio asymmetry analyses. Magn Reson Med. 2013;70:320–327. doi: 10.1002/mrm.24784. [DOI] [PMC free article] [PubMed] [Google Scholar]
- 46.Heo HY, Zhang Y, Lee DH, Hong X, Zhou J. Quantitative assessment of amide proton transfer (APT) and nuclear Overhauser enhancement (NOE) imaging with extrapolated semi-solid magnetization transfer reference (EMR) signals: Application to a rat glioma model at 4.7 T. Magn Reson Med. 2014 doi: 10.1002/mrm.25581. In press. [DOI] [PMC free article] [PubMed] [Google Scholar]
- 47.Zaiss M, Xu J, Goerke S, Khan IS, Singer RJ, Gore JC, Gochberg DF, Bachert P. Inverse Z-spectrum analysis for spillover-, MT-, and T1-corrected steady-state pulsed CEST-MRI - application to pH-weighted MRI of acute stroke. NMR Biomed. 2014;27:240–252. doi: 10.1002/nbm.3054. [DOI] [PMC free article] [PubMed] [Google Scholar]
- 48.Saryan LA, Hollis DP, Economou JS, Eggleston JC. Nuclear magnetic resonance studies of cancer. IV. Correlation of water content with tissue relaxation times. J Natl Cancer Inst. 1974;52:599–602. doi: 10.1093/jnci/52.2.599. [DOI] [PubMed] [Google Scholar]
- 49.Zheng SK, van der Bom IMJ, Zu ZL, Lin GX, Zhao YS, Gounis MJ. Chemical exchange saturation transfer effect in blood. Magn Reson Med. 2014;71:1082–1092. doi: 10.1002/mrm.24770. [DOI] [PubMed] [Google Scholar]
- 50.Grossman R, Tyler B, Brem H, Eberhart CG, Wang SL, Fu DX, Wen ZB, Zhou JY. Growth properties of SF188/V+ human glioma in rats in vivo observed by magnetic resonance imaging. J Neuro-Oncol. 2012;110:315–323. doi: 10.1007/s11060-012-0974-5. [DOI] [PMC free article] [PubMed] [Google Scholar]
- 51.Xi G, Keep RF, Hoff JT. Mechanisms of brain injury after intracerebral haemorrhage. Lancet Neurol. 2006;5:53–63. doi: 10.1016/S1474-4422(05)70283-0. [DOI] [PubMed] [Google Scholar]
- 52.Zhou J, Lal B, Wilson DA, Laterra J, van Zijl PCM. Amide proton transfer (APT) contrast for imaging of brain tumors. Magn Reson Med. 2003;50:1120–1126. doi: 10.1002/mrm.10651. [DOI] [PubMed] [Google Scholar]
- 53.Cai KJ, Haris M, Singh A, Kogan F, Greenberg JH, Hariharan H, Detre JA, Reddy R. Magnetic resonance imaging of glutamate. Nature Med. 2012;18:302–306. doi: 10.1038/nm.2615. [DOI] [PMC free article] [PubMed] [Google Scholar]
- 54.Jin T, Wang P, Zong XP, Kim SG. Magnetic resonance imaging of the Amine-Proton EXchange (APEX) dependent contrast. NeuroImage. 2012;59:1218–1227. doi: 10.1016/j.neuroimage.2011.08.014. [DOI] [PMC free article] [PubMed] [Google Scholar]
- 55.Chan KWY, McMahon MT, Kato Y, Liu GS, Bulte JWM, Bhujwalla ZM, Artemov D, van Zijl PCM. Natural D-glucose as a biodegradable MRI contrast agent for detecting cancer. Magn Reson Med. 2012;68:1764–1773. doi: 10.1002/mrm.24520. [DOI] [PMC free article] [PubMed] [Google Scholar]
- 56.Walker-Samuel S, Ramasawmy R, Torrealdea F, Rega M, Rajkumar V, Johnson SP, Richardson S, Gonçalves M, Parkes HG, Årstad E, Thomas D, Pedley RB, Lythgoe MF, Golay X. In vivo imaging of glucose uptake and metabolism in tumors. Nature Med. 2013;19:1067–1072. doi: 10.1038/nm.3252. [DOI] [PMC free article] [PubMed] [Google Scholar]
- 57.Haris M, Singh A, Cai K, Kogan F, McGarvey J, Debrosse C, Zsido GA, Witschey WR, Koomalsingh K, Pilla JJ, Chirinos JA, Ferrari VA, Gorman JH, Hariharan H, Gorman RC, Reddy R. A technique for in vivo mapping of myocardial creatine kinase metabolism. Nature Med. 2014;20:209–214. doi: 10.1038/nm.3436. [DOI] [PMC free article] [PubMed] [Google Scholar]
- 58.Li AX, Wojciechowski F, Suchy M, Jones CK, Hudson RH, Menon RS, Bartha R. A sensitive PARACEST contrast agent for temperature MRI: Eu3+-DOTAM-glycine (Gly)-phenylalanine (Phe) Magn Reson Med. 2008;59:374–381. doi: 10.1002/mrm.21482. [DOI] [PubMed] [Google Scholar]
- 59.Zhou J, Zhu H, Lim M, Blair L, Quinones-Hinojosa A, Messina AA, Eberhart CG, Pomper MG, Laterra J, Barker PB, van Zijl PCM, Blakeley JO. Three-dimensional amide proton transfer MR imaging of gliomas: Initial experience and comparison with gadolinium enhancement. J Magn Reson Imaging. 2013;38:1119–1128. doi: 10.1002/jmri.24067. [DOI] [PMC free article] [PubMed] [Google Scholar]
- 60.Keupp J, Baltes C, Harvey PR, van den Brink J. Parallel RF transmission based MRI technique for highly sensitive detection of amide proton transfer in the human brain; In Proc 19th Annual Meeting ISMRM; Montreal, Quebec. 2011. p. 710. [Google Scholar]
- 61.Zhou J, Blakeley JO, Hua J, Kim M, Laterra J, Pomper MG, van Zijl PCM. Practical data acquisition method for human brain tumor amide proton transfer (APT) imaging. Magn Reson Med. 2008;60:842–849. doi: 10.1002/mrm.21712. [DOI] [PMC free article] [PubMed] [Google Scholar]
Associated Data
This section collects any data citations, data availability statements, or supplementary materials included in this article.
Supplementary Materials
Supporting Methods: Supporting FIG. S1. Representative morphological features of ICH at different time points (1–12 hours) at the hyperacute stage in rats, as revealed by the T2w images. The hematoma (red open arrow) expanded gradually. The lesion was hypointense, with scattered foci of isointensity or slight hyperintensity, compared to the contralateral brain tissue, during the initial hours post-collagenase injection and became heterogeneous (hypointense to hyperintense) 12 hours later. The size of the hematoma reached the maximum at six hours post-injection.
Supporting FIG. S2. Representative multi-parametric MRI features of cerebral ischemia in rats at one hour post MCAO. The display windows are T2 (0 to 100 ms), T1 (0 to 3 sec), ADC (0 to 1.6×10⁻⁹ m2/sec), blood flow (0 to 200 ml/100g/min), and APTw (-6% to 6% of the bulk water signal intensity). As expected, T2w, T2*w, and T1w images, as well as T2 and T1 maps were not sensitive enough to detect hyperacute cerebral ischemia at one hour post-occlusion, while CBF and ADC abnormalities were clearly visible in acute cerebral ischemia. As reported previously (16, 24-28), APT imaging was also able to detect an ischemic lesion (green solid arrow) that is associated with local tissue acidosis following impaired aerobic metabolism and demonstrated a low APTw pH MRI signal.
Supporting FIG. S3. Quantitative analysis of multi-parametric MRI signal intensities (T2, T1, ADC, blood flow) in rat models of hyperacute ICH (red bar; n = 10) and cerebral ischemia (green bar; n = 10) at different time points post-injection/occlusion. The MRI signal intensities of contralateral normal brain tissue (blue bar) were also compared. Some apparently negative blood flow values were due to low signal-to-noise ratios and not meaningful. Statistical significances between the ICH and the contralateral brain, between the ischemia and the contralateral brain, as well as between the ICH and the cerebral ischemia were: * P < 0.05; ** P < 0.01; *** P < 0.001; not marked = not significant.
Supporting FIG. S4. Representative MTRasym spectra, ΔB0 maps, and APTw MR images of hyperacute ICH (a) and cerebral ischemia (b) in rats at 6 hours post-injection/occlusion. The display windows are: ΔB0 (-100 to 100 Hz) and APTw (-6% to 6% of the bulk water signal intensity).