Abstract
The diagnostic value of tumor markers, CEA, CA 15-3, CA 19-9, CA 125, CYFRA, and NSE in pleural fluid to differentiate between benign and malignant pleural effusion (MPE) has not yet been clearly established. A review of English language studies using human subjects was performed. Sensitivity and specificity values of the chosen tumor markers were pooled using a random effects model to generate hierarchical summary receiver-operator curves to determine the diagnostic performance of each tumor marker. A total of 49 studies were included in the final analysis. Pooled sensitivity and specificity values for chosen tumor markers for diagnosing MPE are as follows: CEA, 0.549/0.962; CA 15-3, 0.507/0.983; CA 19-9, 0.376/0.980; CA 125, 0.575/0.928; CYFRA, 0.625/0.932; NSE, 0.613/0.884. The use of individual tumor markers in diagnosing MPE has many benefits (cost, invasiveness, etc.). While these tumor markers exhibit high specificity, the low sensitivity of each marker limits the diagnostic value. We conclude that tumor markers used individually are of insufficient diagnostic accuracy for clinical use. Tumor markers used in various combinations or from serum may have some potential worth further investigation.
Introduction
Malignant pleural effusion (MPE) encompasses a heterogeneous group of conditions with strong implications in the prognosis and therapeutic approach in cancer patients. While mesotheliomas can result in an MPE of primary malignancy origin, metastasis of neoplasms to the pleural space cause the majority of MPEs. Lymphomas and tumors of the lung, breast and ovary constitute over 75% of the primary neoplasms in MPE cases [1]. The overall median survival after MPE diagnosis is approximately 4 months, though this in large depends on therapeutic approach and tumor origin, ranging from 33 days in urological cancer to nearly one year in mesothelioma [2]. Thus, determination of malignant etiology remains a crucial yet often unsuccessful task in pleural effusion diagnosis. Pleural fluid cytology is a standard method of MPE diagnosis. However, studies have shown a large variation in diagnostic yield ranging form 62–90%, dependent on such factors as extent of disease and nature of the primary malignancy [3]. Similarly, closed pleural biopsy has a reportedly low diagnostic yield of 40–75% [3]. Thoracoscopy is the current gold standard with a diagnostic accuracy between 90 and 100% [4]. However, the high cost associated with thoracoscopy and the low accuracy of pleural fluid cytology needle biopsy promotes the search for a more cost-effective yet highly accurate diagnostic tool.
The utility of tumor antigens in the diagnosis of MPE has been extensively studied. However, their relatively low sensitivities and specificities have raised doubt on their reliability for definitive diagnosis. Nonetheless, some potential remains for these markers as a possible indicative diagnostic tool. Carcinoembryonic antigen (CEA) is the most heavily studied tumor marker in MPE diagnosis. Expression of this tumor-associated antigen is elevated in the fetal colon and some types of cancers, particularly colon adenocarcinoma [5]. Carbohydrate antigen (CA) 15-3, a soluble form of MUC-1 protein, is a tumor-associated antigen initially discovered as a biomarker for breast cancer [6]. CA 19-9 has some use some use in monitoring disease status and treatment response in patients with pancreatic cancer. It has also demonstrated some value in predicting unresectability of pancreatic adenocarcinoma and estimation of survival postsurgery [7]. CA 125 has some utility in the diagnosis of ovarian tumors, with expression elevated in 80–85% of women with advanced epithelial ovarian cancer and in 65% of patients with mucinous carcinoma of the ovary [8]. CYFRA 21-1, a soluble cytokeratin 19 fragment, is a useful marker in epithelial malignancies and lung carcinomas in particular [9]. The human epidermal growth factor receptor 2 (HER-2/neu) is overexpressed in a variety of cancer types, including breast, ovarian, lung, gastric and oral cancers, and serves as an excellent therapeutic target [10]. Neuron specific enolase (NSE) is an enzyme encoded by the enolase 2 gene and is overexpressed in neuroendocrine neoplasia, and particularly in small cell lung cancers [11]. While previously published literature suggests marginal usefulness of these tumor markers, the present study seeks to determine the exact extent and utility of these diagnostic markers. The goal of the present meta-analysis is to determine the overall diagnostic value of these tumor markers singly and in combinations for malignant pleural effusions.
Methods
Search strategy and study selection
Two authors independently searched the National Library of Medicine’s Medline database (using PubMed as the search engine) and Google Scholar to identify relevant studies up to June 30, 2014. The search terms used were tumor marker, carcinoembryonic antigen, carbohydrate antigen 15-3, carbohydrate antigen 19-9, carbohydrate antigen 125, fragment of cytokeratin 19/CYFRA 21-1, neuron specific enolase/NSE, malignant pleural effusion, sensitivity and specificity, and accuracy. References of retrieved articles were also searched manually. All searches were restricted to English language studies concerning human subjects. Conference abstracts and letters to the editor were excluded due to the limited data presented therein.
Studies were included in the meta-analysis when sensitivity and specificity for any of the abovementioned markers tested in pleural fluid or serum were provided for the diagnosis of MPE (see Figure 1). A lower limit of ten specimens was made to reduce selection bias from very small studies. Studies with evidence of a possible overlap of study populations (e.g. same authors, institutions, period of study) were discussed by AHN and EM. Only the best-quality study was used for any overlapping data (i.e. same marker tested). Two reviewers (AHN and EM) independently judged study eligibility while screening the citations. Disagreements were resolved by consensus.
Figure 1.
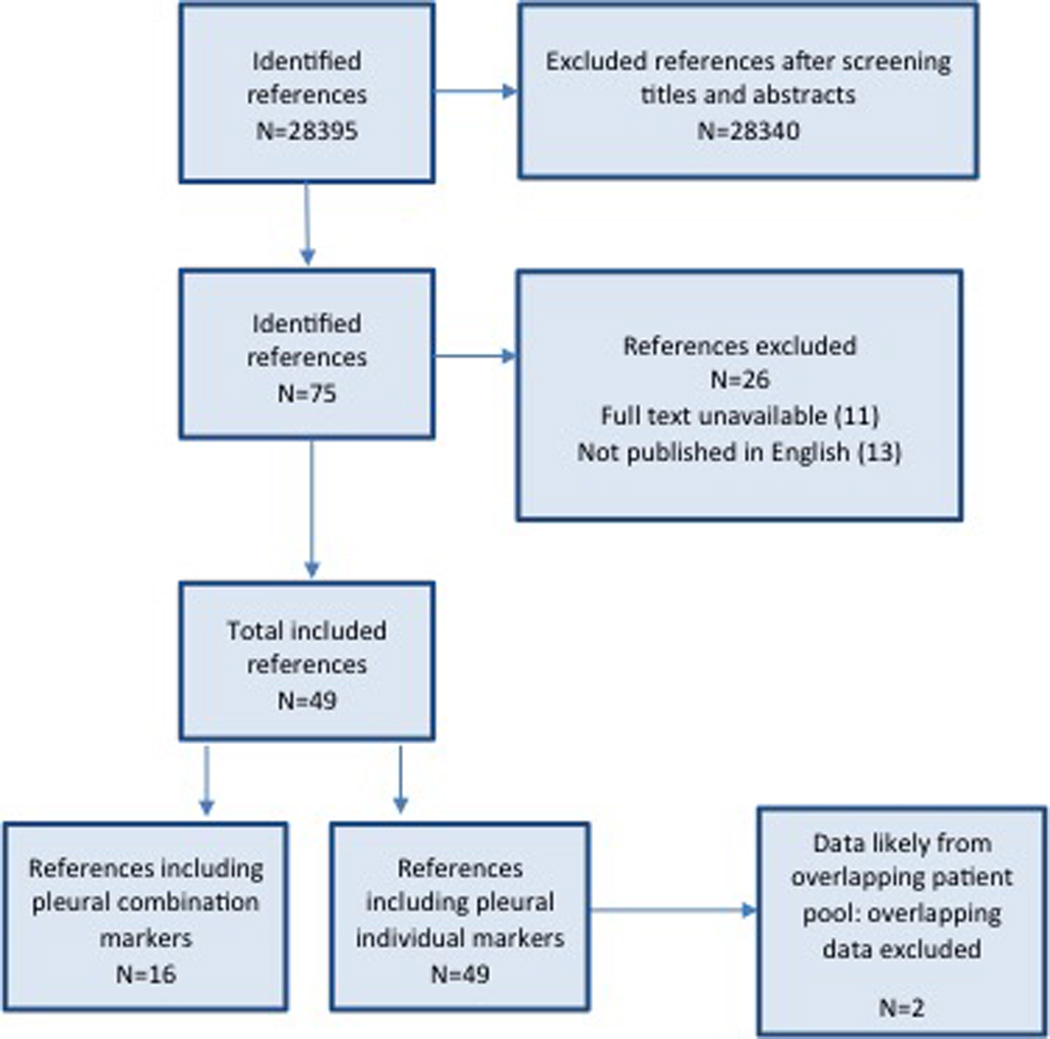
Flow diagram of study selection.
Assessment of Study Quality and Data extraction
The methodological quality of included studies was assessed using guidelines published by the STARD initiative (standards for reporting diagnostic accuracy, maximum score 25) and the QUADAS-2 tool (quality assessment for studies of diagnostic accuracy, judges low risk versus at risk of bias) [12,13].
The final set of included articles was assessed independently by two reviewers (AHN and EM). Study data extracted included authors, publication year, country, test methods, sample population characteristics, sensitivity and specificity data, cut-off value and methodological quality.
Statistical analyses
Previously published guidelines and methods on conducting meta-analyses of diagnostic test evaluations were used [14–16]. Data were compiled using Microsoft Excel 14.4.1 (Microsoft Corporation, Redmond, WA) then transferred to SAS 9.4 ® software (SAS Institute Inc., Cary, NC, USA) and R version ×64 3.1.0 (R Foundation for Statistical Computing, Vienna, Austria) to perform statistical analysis. The sensitivity, specificity, positive likelihood ratio (PLR), negative likelihood ratio (NLR) and diagnostic odds ratio (DOR) were calculated for each study. A test for heterogeneity in the lnDOR was conducted using previous guidelines [17]. Detection of an implicit cut-point effect and evidence of a negative correlation between sensitivity and 1 – specificity was conducted by calculating the Spearman rank correlation for each tumor marker. Heterogeneity and negative correlation were used to determine the appropriate method of data pooling. A random effects model using empirical Bayes methods as employed by the SAS/PROC NLMIXED procedure [18] was used to calculate univariate pooled estimates for sensitivity and specificity and generate hierarchical summary receiver-operator curves (HSROC). Presence of publication bias was tested using funnel plots and Egger’s test.
Results
A total of 49 articles were included in the final analysis for diagnostic accuracy of malignant pleural effusion using serum or pleural concentrations of CEA, CA 15-3, CA 19-9, CA 125, CYFRA 21-1, and NSE. Diagnostic data of CEA in four studies and CA 15-3 in one study were removed from the analysis due to an overlap in study populations. The remainder of the data in these overlapping studies was kept if different markers and/or marker combinations were assessed.
Study characteristics
Of the 49 studies assessed by the present meta-analysis, study design was as follows: 37 (75.5%) had a cross-sectional design, 33 (67.3%) were prospective, 25 (51.0%) collected samples from consecutive patients, and 14 (28.6%) reported interpretation of tumor markers blinded to the reference standard results. The average sample size for each tumor marker was 140 patients (range 25 – 654). In all included studies, pleural malignancy was confirmed by cytological study, pleural biopsy specimens or necropsy.
Determination of statistical pooling model
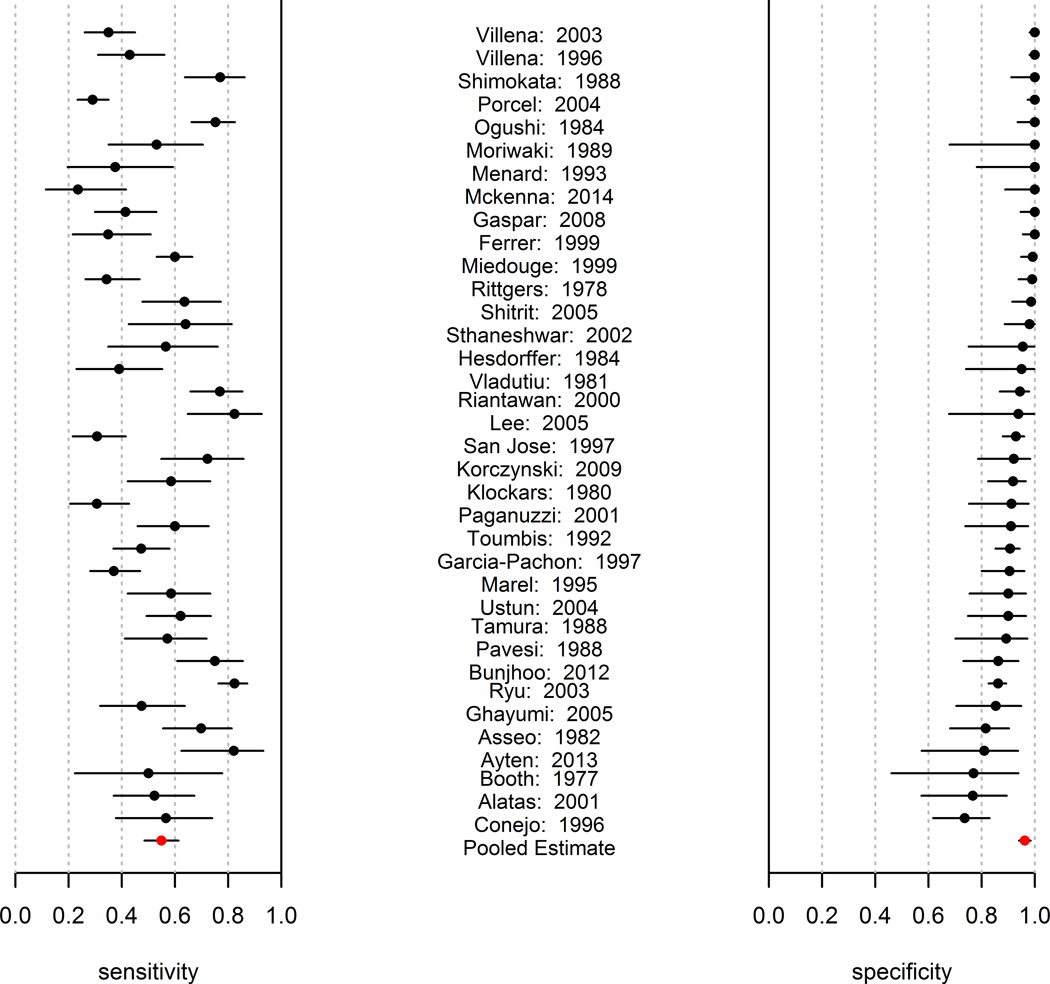
The tumor marker sensitivities and specificities for CEA as reported by each study are summarized in Figure 2 (the other antigens are presented in Appendix Figure 1). Inspection of these Forest plots shows visible heterogeneity in sensitivity, specificity, and lnDOR (evidenced by the number of confidence intervals not overlapping). Analysis for heterogeneity in lnDOR, conducted as described previously [17], demonstrated high Q values and statistical significance for all antigens (Table 1), confirming heterogeneity in the lnDOR. Accordingly, the use of a SROC fixed effects model was concluded to be inappropriate [16].
Figure 2.
Forest plot of the sensitivities and specificities reported by each study for CEA. The calculated pooled mean with corresponding confidence interval is also reported.
Table 1.
Statistical measures of heterogeneity, cut-point effect, and publication bias for each tumor antigen
| Antigen | Q value for heterogeneity in lnDOR |
Spearman’s coefficient |
Egger bias estimate (90% CI) |
Egger test p value |
DEEKS test p value |
|---|---|---|---|---|---|
| CEA | 747.71 | 0.311 | 3.91 (3.25 – 4.56) | 0.0000 | <0.01 |
| CA 15-3 | 201.33 | 0.706 | 5.22 (3.94 – 6.50) | 0.0000 | <0.01 |
| CA 19-9 | 77.02 | 0.708 | 5.39 (3.93 – 6.84) | 0.0004 | 0.19 |
| CA 125 | 94.57 | 0.755 | 3.57 (2.05 – 5.10) | 0.0024 | 0.25 |
| CYFRA | 275.13 | 0.654 | 3.78 (2.06 – 5.50) | 0.0017 | <0.01 |
| NSE | 72.53 | 0.429 | 4.23 (1.72 – 6.74) | 0.0193 | 0.73 |
The Spearman rank correlation between sensitivity and specificity was used to determine the presence of an implicit cut-point effect, with p < −0.6 as indicative of a cut-point effect [19]. The Spearman correlation for pleural CEA was −0.311 (−0.575, 0.011), indicating there is no detectable implicit cut-point effect. A cut-point effect was determined to be present for antigens CA 15-3, CA 19-9, CA 12-5, CYFRA, and NSE (Table 1). The Spearman rank correlation was additionally used to search for evidence of a negative correlation between sensitivity and 1- specificity. A strong negative correlation was not found in any of the tumor markers, indicating the HSROC curve to be an appropriate method for fitting the data.
Data Pooling
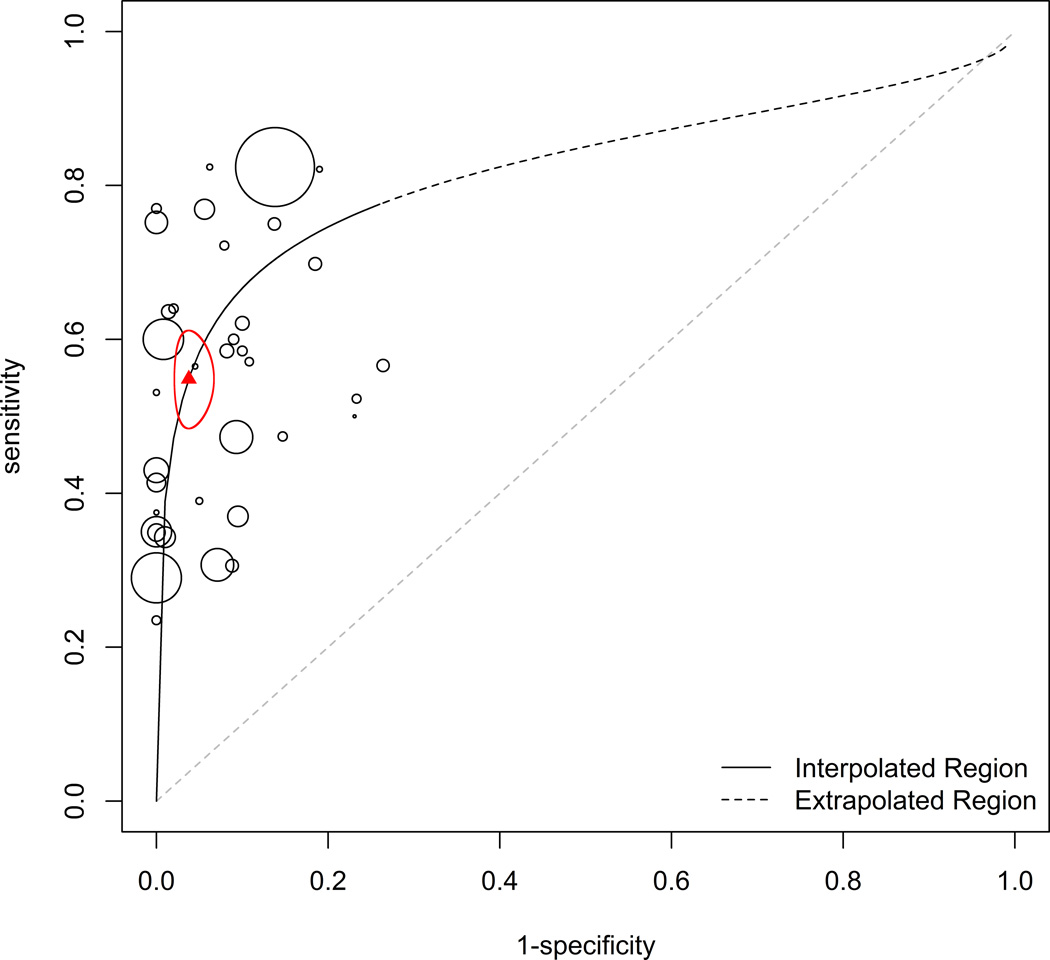
Based on the presence of heterogeneity and lack of negative correlation in the data collected, the random effects model was determined to be the most appropriate pooled estimator for sensitivity and specificity [16]. The empirical Bayes method [18] was used in the present study to calculate the pooled mean of sensitivity and specificity for each tumor marker (Table 2). The HSROC for each tumor marker is presented with the confidence ellipse of sensitivity and 1 – specificity (CEA, Figure 3; all other markers, Appendix Figure 2). The HSROC curves present an overall summary of diagnostic performance for each tumor marker. In all 49 studies included in the meta-analysis, sensitivity and specificity were reported based on a single optimal cut-off value for the marker tested, as selected by the investigators of each study. A majority of the studies selected this cut-off value to maximize specificity. The meta-analysis determined the overall sensitivity of each marker to be markedly low: CEA, 54.9%; CA 15–3, 50.7%; CA 19–9 37.6%; CA 125, 0.575; CYFRA, 62.5%; NSE, 61.3%.
Table 2.
Pooled means of sensitivity and specificity, diagnostic odds ratio (DOR), area under the curve (AUC) and calculated likelihood ratios for each tumor antigen
| Antigen | Sensitivity (95% CI) |
Specificity (95% CI) |
DOR | AUC | PLR | NLR |
|---|---|---|---|---|---|---|
| CEA | 0.549 (0.485 – 0.613) | 0.962 (0.940 – 0.984) | 30.8 | 0.81 | 14.45 (8.08 – 38.31) | 0.47 (0.55 – 0.39) |
| CA15-3 | 0.507 (0.399 – 0.616) | 0.983 (0.958 – 1.000) | 59.5 | 0.78 | 29.82 (9.5 – *) | 0.50 (0.63 – 0.38) |
| CA19-9 | 0.376 (0.077 – 0.675) | 0.980 (0.948 – 1.000) | 29.5 | 0.91 | 18.8 (1.48 – *) | 0.64 (0.97 – 0.33) |
| CA125 | 0.575 (0.325 – 0.824) | 0.928 (0.784 – 1.000) | 17.4 | 0.79 | 7.99 (1.5 – *) | 0.46 (0.86 – 0.18) |
| CYRA | 0.625 (0.483 – 0.766) | 0.932 (0.862 – 1.000) | 22.8 | 0.84 | 9.19 (3.5 – *) | 0.40 (0.6 – 0.23) |
| NSE | 0.613 (0.264 – 0.963) | 0.884 (0.730 – 1.000) | 12.1 | 0.84 | 5.28 (0.98 – *) | 0.44 (1.01 – 0.04) |
Upper bound is undefined due to the upper bound of specificity equaling 1.0
Figure 3.
HSROC curve for CEA. The area of each point represents sample size. The triangle represents calculated pooled mean of sensitivity and specificity with the corresponding 95% confidence interval ellipse enclosing this point.
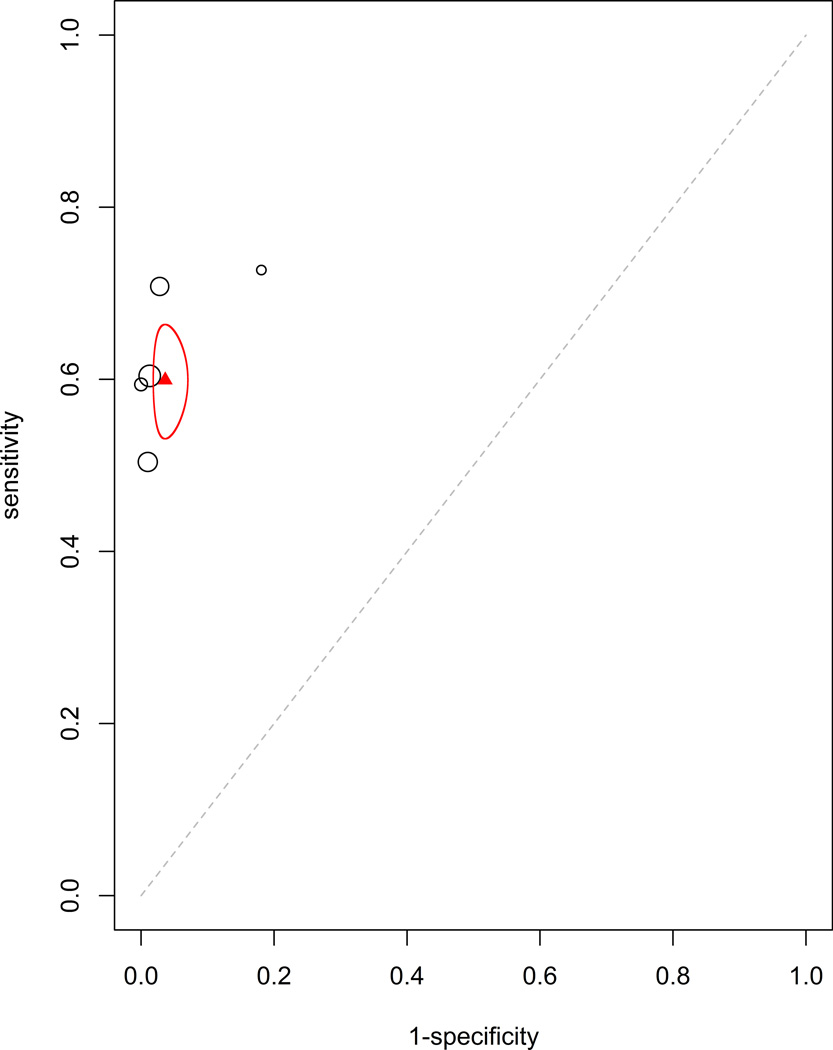
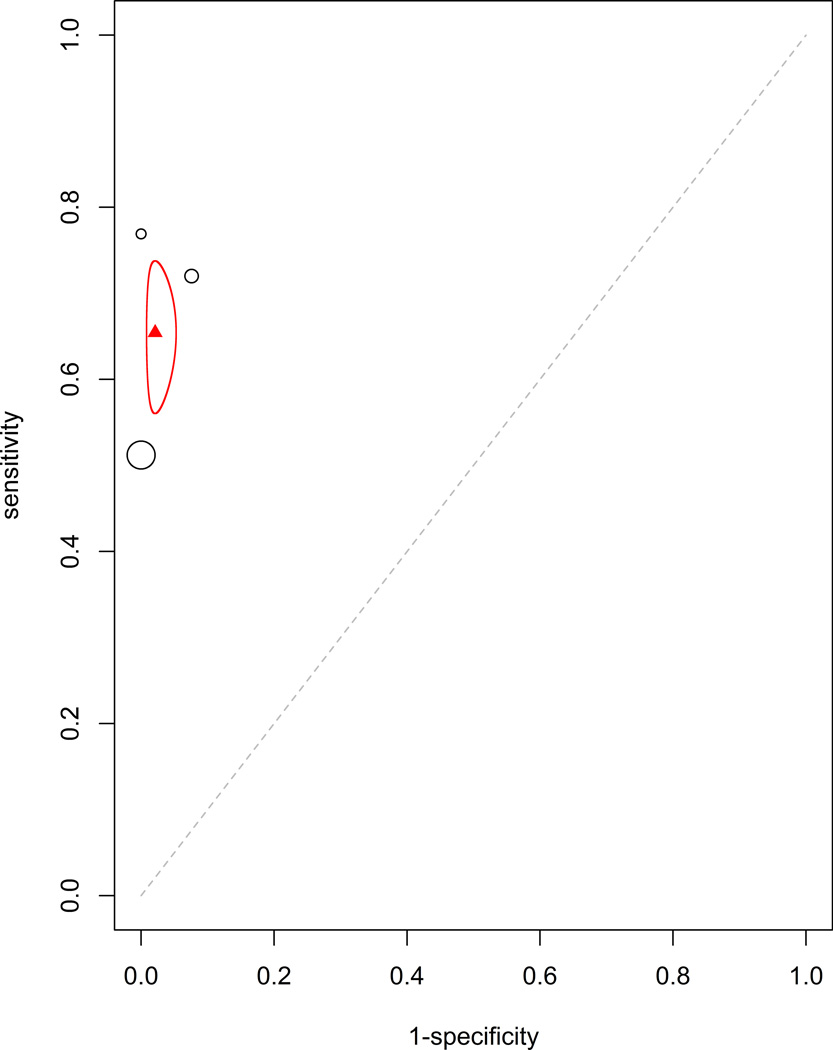
Additionally, the efficacy of tumor markers in combination were analyzed. The two combinations with sufficient data to be analyzed were CEA with CA15-3 (HSROC: Figure 4a, Forrest plot: Appendix Figure 4a) and CEA with CA125 (HSROC: Figure 4b, Forrest plot: Appendix Figure 4b). These were analyzed using the fixed effect model due to having fewer studies than parameters in a mixed effect meta-analysis. The estimated sensitivity and specificity for CEA with CA15-3 were 0.599 (95% CI: 0.535–0.664, standard error 0.033) and 0.964 (95% CI: 0.946–0.982, standard error 0.009), respectively. The estimated sensitivity and specificity for CEA with CA125 were 0.654 (95% CI: 0.560–0.738, standard error 0.089) and 0.979 (95% CI: 0.947–0.992, standard error 0.015), respectively. This improved, though not dramatically, the sensitivity and specificity of these markers alone.
Figure 4.
Plots for (a) CEA with CA15-3 and (b) CEA with CA125. The calculated pooled mean of sensitivity and specificity with the corresponding 95% confidence interval ellipse are displayed. There were an insufficient number of studies available to generate a mixed curve.
Study quality and publication bias
The scores of the STARD and QUADAS-2 tests were used to assess study methodological quality. Only 9 (22.5%) studies were found to have low risk of bias, according to QUADAS-2 standards, with the remainder of the studies being at risk for bias (QUADAS-2 results for individual papers are reported in Appendix Table 1). With 25 as the maximum, the average STARD quality score for the included studies was 13.06 (range 7 – 18).
Based on both Egger’s Test and DEEKS test, there is evidence that bias is present among the studies for all markers (Table 1). The generated funnel plots are depicted in Appendix Figure 3. These results indicate the presence of publication bias in the collected studies.
Discussion
The use of pleural tumor markers offers the potential for a cost-effective and minimally invasive alternative in the diagnosis of MPE. While the presently investigated markers have been repeatedly studied, a problem of insufficient overall diagnostic accuracy has consistently been encountered. The overall specificity of all antigens investigated, with the exception of NSE (CEA, CA 15-3, CA 19-9, and CA 125), was greater than 0.900. However, the sensitivities of these antigens were markedly low (ranging from 0.376 to 0.625). This trade-off of sensitivity for maximizing specificity has serious clinical implications for using these markers in the differential diagnosis between MPE and non-MPE. While these tests would demonstrate a strong ability to rule in MPE, the high false negative rates suggest these markers to be insufficient in the exclusion of non-MPE.
There are three general methods for conducting a systematic review of multiple diagnostic studies: (1) the summary receiver operator curve fixed effect model [19], (2) random effects using a bivariate normal approximation [20], and (3) the hierarchical summary receiver operator curve (HSROC) random effects using either empirical Bayes methods [18] or the full Bayesian [21]. When analysis of the natural logarithm of the diagnostic odds ratio [17] indicates heterogeneity to be present, fitting the SROC curve is contraindicated. In these situations, the use of a random effects model to estimate the mean sensitivity and specificity with their associated confidence intervals is recommended; using an HSROC can also be explored. However, a strong negative correlation between sensitivity and 1 – specificity indicates an HSROC should not be fitted. Analysis of the data collected indicated the use of an HSROC curve. The HSROC is a fairly recent development in the assessment of diagnostic studies and, to the knowledge of the authors, the present paper is the first to implement such a statistical method for these cancer markers in the diagnosis of MPE. The HSROC graph includes the pooled estimated mean of the sensitivity and specificity (and 95% confidence range represented by the ellipse) while treating sensitivity and 1 – specificity as coming from a bivariate distribution and accounts for the correlation between sensitivity and specificity (for additional statistical detail, see Appendix: Statistical Methods). This allows for more between- and within-study variability than fixed-effect approaches by allowing both test stringency and test accuracy to vary across studies [21].
To improve clinical applicability of these results, likelihood ratios, diagnostic odds ratios (DOR), and area under the curve (AUC) were generated for each tumor marker (Table 2). A likelihood ratio > 10 or < 0.1, in example, indicates a ten-fold shift in probability of a condition’s presence before versus after the diagnostic test. The positive likelihood ratio of CEA, CA 15-3 and CA 19-9 were the only likelihood ratios > 10, suggesting a positive test result for these antigens would indicate a relative high chance of having MPE. This is consistent with the high specificity. None of the negative likelihood ratios were of strong indicative value, indicating the antigens individually unsuitable for ruling out MPE.
The present meta-analysis had some limitations. Inclusion of only published original research articles written in English had a two-fold potential for bias. Firstly, this excluded conference abstracts, letters to journal editors, and non-published data. This may inflate estimated diagnostic value due to preferential publication of studies with favorable results. Secondly, this limits the analysis to data presented in each publication. This precludes the ability to test issues such as laboratory infrastructure, marker assay technology and performance quality, and affect of patient selection and setting on study quality. Additionally, incomplete presentation of study methodology is likely a large factor in the assessed study quality scores by STARD and QUADAS-2. Bias was found to be present in the studies collected. Traditionally, evaluation of publication bias is performed using DEEKS test, suggesting bias to be present in three of the six markers. However, in his original manuscript, Deeks states this test is low powered in the presence of heterogeneity [22]. The Egger’s test was performed and found bias to be present in all six. Analysis was not performed to determine source of bias. Likely, all of the above factors as well as widely differing study quality contributed to the bias and heterogeneity encountered.
In conclusion, the tumor markers are of insufficient diagnostic accuracy, individually, to be recommended for MPE diagnosis. While these markers are highly specific, the low sensitivity of each marker limits the clinical diagnostic value. A number of studies have investigated the possible diagnostic value of these tumor markers in various combinations, showing improved accuracy [15,23]. Our analysis similarly showed improvement, albeit minimal, in sensitivity and specificity when markers used in combination. Furthermore, the diagnostic value of these cancer markers in serum has not investigated nearly as extensively as pleural concentrations. Both of these venues offers potential for improved diagnostic value of these markers. Additionally, there has been growing interest in searching for novel biomarkers using proteomic [24] or microRNA [25,26] methodologies. While further investigation is required, tumor markers, in general, have strong potential to be included in diagnostic algorithms prior to more invasive procedures.
Supplementary Material
Acknowledgments
All authors have read the journal's authorship agreement and policy on disclosure of potential conflicts of interest. Research awards R01HL104516, R01HL112597, R01HL116042 and R01HL120659 from the National Institutes of Health, USA to DK Agrawal, supported this work. The content of this article is solely the responsibility of the authors and does not necessarily represent the official views of the NIH.
Abbreviations
- CA
Cancer antigen
- CEA
Carcinoembryonic antigen
- CYFRA
Cytokeratin fragment
- HSROC
Hierarchical summary receiver-operator curves
- MPE
Malignant pleural effusion
- NSE
Neuron specific enolase
- QUADAS
Quality assessment of diagnostic accuracy studies
- STARD
Standards for reporting diagnostic accuracy
Footnotes
Financial and competing interest disclosure
The authors have no other relevant affiliations or financial involvement with any organization or entity with financial interest in or financial conflict with the subject matter or materials discussed in the manuscript apart from those disclosed.
No writing assistance was utilized in the production of this manuscript.
References
- 1.Heffner JE, Klein JS. Recent advances in the diagnosis and management of malignant pleural effusions. Mayo Clin Proc. 2008;83:235–250. doi: 10.4065/83.2.235. [DOI] [PubMed] [Google Scholar]
- 2.Clive AO, Kahan BC, Hooper CE, Bhatnagar R, Morley AJ, Zahan-Evans N, et al. Predicting survival in malignant pleural effusion: development and validation of the LENT prognostic score. Thorax. 2014;69:1098–1104. doi: 10.1136/thoraxjnl-2014-205285. [DOI] [PMC free article] [PubMed] [Google Scholar]
- 3.Antony VB, Loddenkemper R, Astoul P, Boutin C, Goldstraw P, Hott J, et al. Management of malignant pleural effusions. Eur Respir J. 2001;18:402–419. doi: 10.1183/09031936.01.00225601. [DOI] [PubMed] [Google Scholar]
- 4.Colt HG. Thoracoscopy: window to the pleural space. Chest. 1999;116:1409–1415. doi: 10.1378/chest.116.5.1409. [DOI] [PubMed] [Google Scholar]
- 5.Hammarstrom S. The carcinoembryonic antigen (CEA) family : structures, suggested functions and expression in normal and malignant tissues. Cancer Biol. 1999;9:67–81. doi: 10.1006/scbi.1998.0119. [DOI] [PubMed] [Google Scholar]
- 6.Duffy MJ, Evoy D, McDermott EW. CA 15-3: uses and limitation as a biomarker for breast cancer. Clin Chim Acta. 2010;411:1869–1874. doi: 10.1016/j.cca.2010.08.039. [DOI] [PubMed] [Google Scholar]
- 7.Steinberg W. The clinical utility of the CA 19-9 tumor-associated antigen. Am J Gastroenterol. 1990;85:350–355. [PubMed] [Google Scholar]
- 8.Medeiros LR, Rosa DD, da Rosa MI, Bozzetti MC. Accuracy of CA 125 in the diagnosis of ovarian tumors: a quantitative systematic review. Eur J Obstet Gynecol Reprod Biol. 2009;142:99–105. doi: 10.1016/j.ejogrb.2008.08.011. [DOI] [PubMed] [Google Scholar]
- 9.Luczak E, Faber M, Chciałowski A. Cyfra 21-1--new marker for lung cancer. Pneumonol Alergol Pol. 1996;64:96–101. [PubMed] [Google Scholar]
- 10.Hung M, Lau Y. Basic science of HER-2/new: a review. Semin Oncol. 1999;26:1–2. [PubMed] [Google Scholar]
- 11.Tapia FJ, Barbosa aJa, Marangos PJ, Polak JM, Bloom SR, Dermody C, et al. Neuron-Specific Enolase Is Produced By Neuroendocrine Tumours. Lancet. 1981;317:808–811. doi: 10.1016/s0140-6736(81)92682-9. [DOI] [PubMed] [Google Scholar]
- 12.Bossuyt PM, Reitsma JB, Bruns DE, Gatsonis CA, Glasziou PP, Irwig LM, et al. The STARD Statement for Reporting Studies of Diagnostic Accuracy : Explanation and Elaboration. Ann Intern Med. 2003;138:W1–W12. doi: 10.7326/0003-4819-138-1-200301070-00012-w1. [DOI] [PubMed] [Google Scholar]
- 13.Whiting P, Rutjes A, Westwood M, Mallett S, Deeks J, Reitsma J, et al. QUADAS-2: a revised tool for the quality assessment of diagnostic accuracy studies. Ann Intern …. 2011;155:529–536. doi: 10.7326/0003-4819-155-8-201110180-00009. [DOI] [PubMed] [Google Scholar]
- 14.Devillé WL, Buntinx F, Bouter LM, Montori VM, de Vet HCW, van der Windt DaWM, et al. Conducting systematic reviews of diagnostic studies: didactic guidelines. BMC Med Res Methodol. 2002;2:9. doi: 10.1186/1471-2288-2-9. [DOI] [PMC free article] [PubMed] [Google Scholar]
- 15.Liang Q-L, Shi H-Z, Qin X-J, Liang X-D, Jiang J, Yang H-B. Diagnostic accuracy of tumour markers for malignant pleural effusion: a meta-analysis. Thorax. 2008;63:35–41. doi: 10.1136/thx.2007.077958. [DOI] [PubMed] [Google Scholar]
- 16.Chappell FM, Raab GM, Wardlaw JM. When are summary ROC curves appropriate for diagnostic meta-analyses? Stat Med. 2009;28:2653–2668. doi: 10.1002/sim.3631. [DOI] [PubMed] [Google Scholar]
- 17.Fleiss J. Review papers: The statistical basis of meta-analysis. Stat Methods Med Res. 1993;2:121–145. doi: 10.1177/096228029300200202. [DOI] [PubMed] [Google Scholar]
- 18.Macaskill P. Empirical Bayes estimates generated in a hierarchical summary ROC analysis agreed closely with those of a full Bayesian analysis. J Clin Epidemiol. 2004;57:925–932. doi: 10.1016/j.jclinepi.2003.12.019. [DOI] [PubMed] [Google Scholar]
- 19.Littenberg B, Moses LE. Estimating Diagnostic Accuracy from Multiple Conflicting Reports: A New Meta-analytic Method. Med Decis Mak. 1993;13:313–321. doi: 10.1177/0272989X9301300408. [DOI] [PubMed] [Google Scholar]
- 20.Reitsma JB, Glas AS, Rutjes AWS, Scholten RJPM, Bossuyt PM, Zwinderman AH. Bivariate analysis of sensitivity and specificity produces informative summary measures in diagnostic reviews. J Clin Epidemiol. 2005;58:982–990. doi: 10.1016/j.jclinepi.2005.02.022. [DOI] [PubMed] [Google Scholar]
- 21.Rutter CM, Gatsonis CA. A hierarchical regression approach to meta-analysis of diagnostic test accuracy evaluations. Stat Med. 2001;20:2865–2884. doi: 10.1002/sim.942. [DOI] [PubMed] [Google Scholar]
- 22.Deeks JJ, Macaskill P, Irwig L. The performance of tests of publication bias and other sample size effects in systematic reviews of diagnostic test accuracy was assessed. J Clin Epidemiol. 2005;58:882–893. doi: 10.1016/j.jclinepi.2005.01.016. [DOI] [PubMed] [Google Scholar]
- 23.Shitrit D, Zingerman B, Shitrit AB-G, Shlomi D, Kramer MR. Diagnostic value of CYFRA 21-1, CEA, CA 19-9, CA 15-3, and CA 125 assays in pleural effusions: analysis of 116 cases and review of the literature. Oncologist. 2005;10:501–507. doi: 10.1634/theoncologist.10-7-501. [DOI] [PubMed] [Google Scholar]
- 24.Chen C-D, Wang C-L, Yu C-J, Chien K-Y, Chen Y-T, Chen M-C, et al. A targeted proteomics pipeline reveals potential biomarkers for diagnosis of metastatic lung cancer in pleural effusion. J Proteome Res. 2014 doi: 10.1021/pr4012377. [DOI] [PubMed] [Google Scholar]
- 25.Hennessey PT, Sanford T, Choudhary A, Mydlarz WW, Brown D, Adai AT, et al. Serum microRNA biomarkers for detection of non-small cell lung cancer. PLoS One. 2012;7:e32307. doi: 10.1371/journal.pone.0032307. [DOI] [PMC free article] [PubMed] [Google Scholar]
- 26.Wittmann J, Jäck H-M. Serum microRNAs as powerful cancer biomarkers. Biochim Biophys Acta. 2010;1806:200–207. doi: 10.1016/j.bbcan.2010.07.002. [DOI] [PubMed] [Google Scholar]
Associated Data
This section collects any data citations, data availability statements, or supplementary materials included in this article.


