

Abstract
Pb(II) is a representative heavy metal in industrial wastewater, which may frequently cause serious hazard to living organisms. In this study, comparative studies between alginate nanoparticles (AN) and quercetin-decorated alginate nanoparticles (Q-AN) were investigated for Pb(II) ion adsorption. Characterization of AN and Q-AN were analysed by transmission electron microscopy (TEM), Fourier transform infrared spectrometry (FT-IR), X-ray diffractometer (XRD), and thermogravimetric analysis (TG-DTG-DSC). The main operating conditions such as pH, initial concentration of Pb(II), and co-existing metal ions were also investigated using a batch experiment. AN and Q-AN, with a diameter of 95.06 and 58.23 nm, were constituted by many small primary nanoparticles. It revealed that when initial concentration of Pb(II) is between 250 and 1250 mg L−1, the adsorption rate and equilibrium adsorption were increased with the increase of pH from 2 to 7. The maximum adsorption capacities of 147.02 and 140.37 mg L−1 were achieved by AN and Q-AN, respectively, with 0.2 g adsorbents in 1000 mg L−1 Pb(II) at pH 7. The adsorption rate of Pb(II) was little influenced by the co-existing metal ions, such as Mn(II), Co(II), and Cd(II). Desorption experiments showed that Q-AN possessed a higher desorption rate than AN, which were 90.07 and 83.26 %, respectively. AN and Q-AN would probably be applied as adsorbents to remove Pb(II) and then recover it from wastewater for the advantages of simple preparation, high adsorption capacity, and recyclability.
Keywords: Pb(II), Alginate, Quercetin, Nanoparticles, Adsorption
Background
The unique nature of lead (Pb), high malleability, low melting point, and strong resistance to corrosion, provides its widespread application in various industries [1]. The major sources of anthropogenic Pb are the wastewaters from battery manufacturing, electroplating industry, mining activity, and combustion of automobile petrol [2, 3]. Pb(II) has access to human body through inhalation and ingestion in different ways such as contaminated air and water, soil, and food. Accumulation of lead produces damaging effects in peripheral and central nervous systems, kidneys, and blood pressure. If exposures exceed tolerable levels, lead is dangerous to individuals of any age, while fetuses and young children are the most vulnerable members. Based on the Substance Priority List of Agency for Toxic Substances and Disease Registry (ATSDR) 2013 Substance Priority List, Pb(II) is the top 2 hazardous material of environmental concern with high frequency, persistency, and toxicity [4, 5]. The methods have been applied for Pb(II) removal in contaminated water mainly including chemical precipitation, electrochemical reduction, ion-exchange, membrane separation, and sorption [6, 7]. Among these technologies, adsorption is one of the economic and efficient methods for removal of heavy metal from wastewaters. Nanomaterials have extremely small size and high surface area to volume ratio that provided immense scope and opportunities for water decontamination [8, 9].
Sodium alginate is a relatively economical biopolymer with compositions of α-1, 4-l-glucuronic acid (G units) and poly-β-1, 4-d-mannuronic acid (M units) which can provide rich ester groups (–COO−) for adsorbing cation [10–12]. Recently, nano alginate materials have attracted significant attentions in the area of heavy metal adsorption [13–15]. When exposed to aqueous calcium ion, sodium alginate will form a three-dimensional gel network, which is essential for adsorption [16].
Quercetin is a naturally-derived polyhydroxy (3, 3', 4', 5, 7-OH) compound, which can form complexes with many metal cations. It is presumed the hydroxyls on quercetin may enhance the adsorption capability of alginate. Besides, we have reported a microcapsule system based on alginate for Cr(VI) removal in our previous research [17]. And the size of the microcapsule is about 200 μm. Considering that small particles (<1 μm) have a larger specific surface area and a higher mechanical strength, it is significant to prepare alginate particles in nanometer. An approach of alginate-in-water (W/O) nano-emulsions coupled with external gelation will be applied to prepare nanoparticles. The present work is aimed at the design of both uniformly sized alginate nanoparticles (AN) and quercetin-decorated alginate nanoparticles (Q-AN) for Pb(II) removal. Batch adsorption experiments were conducted to investigate the removal of Pb(II) from aqueous solution by both AN and Q-AN. The effect of parameters such as solution pH, initial Pb(II) concentration, and co-existing metal ions was studied.
Methods
Materials
Sodium alginate (low viscosity, 4–12 cP), Span 80, and Tween 80 were provided by Sigma-Aldrich Co. (St. Louis, USA). Quercetin was supplied by Sangon Biotech, Co., Ltd. (Shanghai, China). Lead nitrate (Pb(NO3)2), manganous nitrate (Mn(NO3)2), cobaltous nitrate (Co(NO3)2), and cadmium(II) nitrate (Cd(NO3)2) were purchased from Aladdin Industrial Corporation (Shanghai, China). All remaining chemicals used in this study were analytical grade or ACS grade. All solutions were prepared with ultrapure water.
Preparation of AN and Q-AN
Preparation of AN
The AN in aqueous phase of W/O nano-emulsions were prepared by following procedure. (1) 1.05 mL Span 80 and 0.45 mL Tween 80 were added into 150 mL liquid paraffin (HLB = 7.5) in a 500-mL three-necked flask while stirring with a mechanical stirring speed of 500 rpm at a constant temperature of 40 °C for 30 min. (2) To obtain small-sized alginate nanoparticles, the stirring speed was increased to 1000 rpm. 45 mL of 0.50 % (v/w) alginate was dropped into above liquid paraffin at a rate of 1 mL 6 min−1. The solution was then stirred at the same temperature for 60 min. (3) CaCl2 (0.10 %) (v/w) prepared with 60 % (v/v) ethanol was dropped into the above mixture at a rate of 1 mL 6 min−1. Keep stirring for another 60 min. Then, the alginate nano-emulsions was transferred into Eppendorf tubes, centrifuged at 3800 r min−1 for 10 min, and then left for equilibration at 25 °C. The upper phase (oil of surfactant or reverse micelles) of the phase-separated samples was discarded, whereas the lower phase containing alginate nanoparticles was collected [18]. (4) An equal volume of ethyl ether was added into alginate nanoparticles and vibrated gently. And the upper phase (solution of ethyl ether and residual liquid paraffin) was removed. Purge lower phase with nitrogen gas to replace ethyl ether. The obtained alginate nanoparticles were filtrated with a 0.22-μm membrane filter and lyophilized or kept in a refrigerator until further investigation.
Preparation of Q-AN
The procedure of Q-AN preparation was similar to that of AN except an addition of 0.0675 g quercetin into 45 mL of 0.50 %(v/w) alginate.
Characterizations
Morphology Characterization
Samples for the transmission electron microscopy (TEM; JEOL JEM-2100F, Japan) observation were dispersed in ultrapure water, and two drops were placed on a carbon-coated copper mesh grid. The experiment was carried out after the evaporation of water.
Particle Size Determination and Zeta Potential Measurement
The particle size and zeta potential of the samples were estimated by phase angle light scattering (PALS) using Zetasizer Nano-Series (NanoZS, Malvern, UK), controlled by the Dispersion Technology Software (DTS 5.03, Malvern, UK). Samples were diluted with ultrapure water before measurement. In each case, the experiment was carried out three times.
Quantification of Alginate and Quercetin
The quercetin in the Q-AN was assessed by measuring the quercetin released from Q-AN in the methanol solution. The yield of alginate and quercetin was calculated as the percent of alginate and quercetin in obtained nanoparticles, which was compared to the initial amount of alginate and quercetin used in the prepared process, respectively.
Thermogravimetric Analysis
Thermogravimetric data (TG-DTG-DSC) for samples were obtained using thermogravimetry and differential scanning calorimetry (TG-DSC; STA449F3, Netzsch, Germany). All tests were conducted with sample mass of 2–5 mg at 10 °C min−1 over a range of 50–800 °C. The measurements were carried out in Ar atmosphere
FT-IR Analysis
FT-IR spectra of samples were recorded on a FT-IR spectrometer (Tensor 27, Bruker, Germany). The spectra were collected in the range of 4000–400 cm−1 with a resolution of 2 cm−1 at 16 scans per spectrum.
X-ray Diffraction Analysis
The crystal structures of samples were identified using X-ray diffractometer (XRD, D/max-2500, Rigaku, Japan) operated at 50.0 kV and 180.0 mA with Cu Kα radiation, and in the range of 10°–50° with a scanning rate of 0.2° min−1.
X-ray Photoelectron Spectrometer
The valence state of Pb absorbed on Q-AN was determined by X-ray photoelectron spectrometer (PHI 1600, PerkinElmer, USA). Experiments of Q-AN and adsorption of Pb(II) in this characterization was conducted in nitrogen atmosphere to avoid interference of oxygen in air. Measurement was carried out with an AlK (hλ = 1667.0 eV) X-ray source at 250.0 W and pass energy of 29.35 eV for high-resolution analyses. Vacuum in analysis chamber was kept below 3 × 10⁻⁶ Pa during measurement. Binding energy of spectra was calibrated with aliphatic carbons C1s (284.6 eV).
Batch Experiments
Batch adsorption experiments for Pb(II) removal in aqueous solution were performed in polypropylene bottles with a reaction volume of 45 mL at room temperature (25 ± 1 °C). Nanoparticles (0.2 g) were sealed in dialysis bags (MW 12,000) and then immersed in the above Pb(II) aqueous solution. Equilibrium adsorption was achieved by a shaker incubator at 120 rpm for 4 h. Effects of several parameters, such as initial pH (2, 3, 4, 5, 6, 7), initial Pb(II) concentration (250, 500, 750, 1000, 1250 mg L−1), and co-existing heavy metal ions (Mn, Co, Cd), on removal of Pb(II) in aqueous solution were studied. The solution pH was adjusted with 0.1 M HCl and 0.1 M NaOH. The adsorption capability of AN and Q-AN was conducted in 1000 mg L−1 Pb(II) aqueous solution at pH 7. Experiments of Pb(II) desorption were carried out in 1 M HCl solution. And the AN and Q-AN used in desorption experiment reached the equilibrium adsorption in 500 mg L−1 Pb(II) aqueous solution at pH 7. The residual Pb(II) aqueous solution was filtrated with 0.22 μm membrane filter, and then, Pb(II) concentration was quantified with an inductively coupled plasma atomic emission spectroscopy (SPECTRO ARCOS EOP, Spectro Analytical Instruments GmbH, USA).
The percentage of Pb(II) adsorption by nanoparticles was calculated as follows:
| 1 |
The absorption capacity of nanoparticles was calculated as follows:
| 2 |
where C0 is the initial concentration of Pb(II) in the aqueous solution (mg L−1) and Ci is the concentration of Pb(II) after equilibrium adsorption (mg L−1). V is the volume of solution (L), and W is the mass of the nanoparticles used (g). All experiments were performed in triplicate to ensure the precision of the results.
Results and Discussion
Characterization of AN and Q-AN
Morphology
TEM micrographs of Q-AN were given as examples in Fig. 1. Figure 1a and b indicated that Q-AN was constituted by small primary particles with a diameter of about 1–2 nm (indicated by white circles) [19]. High resolution of TEM in Fig. 1c showed lattice fringes which indicate the presence of microcrystallites. And the various directions of lattice fringes further demonstrated the existence of small primary particles. Meanwhile, no clear crystallinity was observed in the high-resolution TEM image of AN (Fig. 1d). It illustrated the influence of quercetin to the crystal structure of Q-AN. It was noteworthy in Table 1 that the diameter of Q-AN was strikingly smaller than that of AN. And the decline of PDI [20] showed improvement of the uniformity nanoparticle size distribution obviously. It is presumed that the hydroxyl groups in quercetin can form an intermolecular hydrogen bond with alginate and share the coordination site in Ca2+ with it as well. The loading rate and encapsulation efficiency of quercetin in lyophilized Q-AN were 0.36 and 10.67 %, respectively.
Fig. 1.
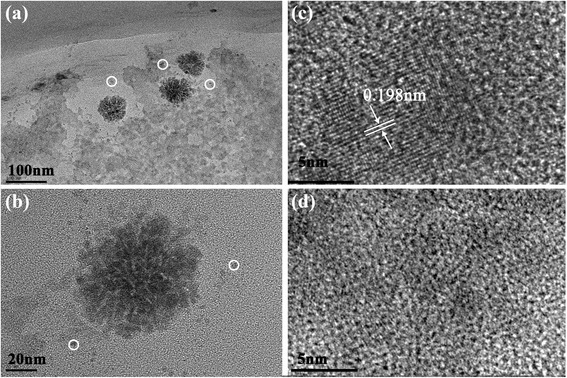
a TEM image of Q-AN. b A single TEM image of Q-AN. c High-resolution TEM image of Q-AN. d High-resolution TEM of AN
Table 1.
Related information about AN and Q-AN
| Diameter (nm) | PDIa | Loading rate (%) | Encapsulation efficiency (%) | Adsorption Capability (mg/g) | Desorption rate (%) | |
|---|---|---|---|---|---|---|
| AN | 95.06 ± 9.97 | 0.34 ± 0.11 | – | – | 147.02 ± 3.91 | 83.26 ± 7.46 |
| Q-AN | 58.23 ± 2.34 | 0.15 ± 0.03 | 0.36 ± 0.03 | 10.67 ± 0.89 | 140.37 ± 5.04 | 90.07 ± 3.39 |
aPDI is an abbreviation of polydispersity index. PDI < 0.2 corresponded to a homogeneous distribution
TG-DTG-DSC
The thermogravimetry was used to study the isolated polyelectrolyte alginate and its complex form. TG-DTG curves in Fig. 2a indicated that sodium alginate subjected to a slight weight loss in 50.0–195.9 °C range and then a rapid one in 195.9–576.0 °C range. The first weight loss was mainly caused by the loss of water molecules in the sodium alginate powder, and the second one was due to the degradation of Na-alginate backbone [21]. Two clear weight loss stages of quercetin appeared in 50.0–178.5 °C and 178.5–421.0 °C ranges (Fig. 2b), which were similarly due to its water loss and structure degradation. In TG-DTG curves of AN (Fig. 2c), the slight weight loss in 50.0–138.4 °C range was attributed to the residual moisture in AN after the lyophilization process. However, a sustained and rapid weight loss in 138.5–513.5 °C range illustrated the obvious change of the existing forms of sodium alginate in AN (compared with the TG curve in Fig. 2a). This result was further confirmed by the shift of DTG peak form 246.0 °C (sodium alginate) to 258.5 °C (AN). The TG curve of Q-AN underwent a continued weight loss in 50.0–543.3 °C which demonstrated the thermal decomposition of quercetin [22]. And the intensive DTG peak at 400.8 °C illustrated the improvement of the thermal stability of quercetin by interaction with alginate gel.
Fig. 2.
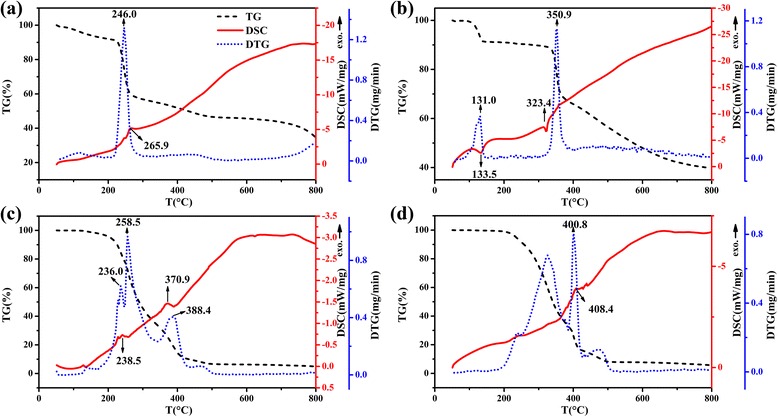
TG-DTG-DSC curves of a sodium alginate, b quercetin, c AN, and d Q-AN
The DSC curve of alginate presented one exothermic peak at 265.9 °C corresponding to the thermal decomposition. As to quercetin, the endothermic peak at 133.5 °C was related to the water loss and the second one at 323.4 °C to its melting point. The difference between DSC curve of sodium alginate and AN was mainly caused by gel formation. Two exothermic peaks at 238.5 and 370.9 °C were respectively attributed to the decomposition of gel and residual substances mentioned in DTG analysis. However, no obvious melting point appeared in the DSC curve of Q-AN though the typical crystal structure of quercetin. Besides, the very weak exothermic peak at 408.4 °C might be due to the decomposition of quercetin, and this decomposition temperature is higher than it in the DSC curve of pure quercetin. Thus, it confirmed the interactive force between alginate gel and quercetin.
FT-IR
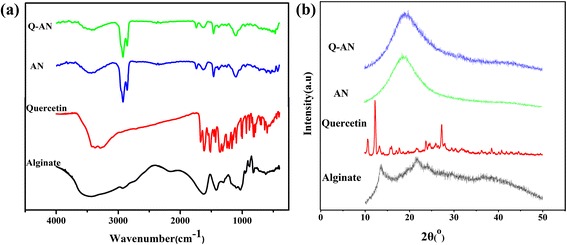
One approach to provide information on molecular interaction of nanoparticles was to monitor changes in the FT-IR spectra of their component parts. The FT-IR spectra of sodium alginate, quercetin, AN, and Q-AN are shown in Fig. 3. In the FT-IR spectra of alginate (Fig. 3a), the major peaks observed were as follows: a strong-broad band at 3435.09 cm−1 (O–H stretching), a weak peak at 2925.81 cm−1 (C–H stretching), a medium-sharp peak at 1623.60 cm−1 and a medium-shoulder peak 1419.73 cm−1 (asymmetric and symmetric COO–stretching), and then peaks at 1109.22 cm−1 and 1029.25 cm−1 (C–O stretching [6]).
Fig. 3.
a FT-IR spectra and b X-ray diffraction spectra of sodium alginate, quercetin, AN, and Q-AN
For quercetin (Fig. 3b), the major peaks were as follows: a strong-broad band at 3422.82 cm−1 (O–H stretching), a medium-sharp peak at 1668.93 cm−1 and a strong-sharp 1610.88 cm−1 (C = O stretching), a strong-sharp peak at 1523.81 cm−1 (aromatic group), a medium-sharp peak at 1316.49 cm−1 and a medium-sharp peak at 1163.08 cm−1 (C–O–C stretching), and a weak-sharp peak at 930.89 cm−1 (aromatic group C–H stretching).
When the alginate nanogel was formed in the presence of Ca2+, several shifts of absorbance peaks were observed compared with the FT-IR spectra of alginate. The change was observed for C–O–C stretching peak at 1109.22 cm−1 (sodium alginate) to 1101.10 cm−1 (AN). A very slight shift of COO– asymmetric stretch peak at 1623.60 cm−1 (sodium alginate) to 1627.58 cm−1 (AN) was also observed. However, the COO– symmetric stretch peak at 1419.73 cm−1 (sodium alginate) was distinctly transferred to 1463.04 cm−1 (AN). Peak shifts mentioned above provided the evidence that the Na+ ions in the sodium alginate were replaced by Ca2+, thus forming a regular three-dimensional net structure bound by Ca2+ [16]. The FT-IR spectra of Q-AN (Fig. 3d) indicated that it kept the major absorption peaks of AN, namely C–O–C stretching peak and COO– asymmetric and symmetric stretch peaks. However, peaks of quercetin were concealed. The reason might be that the trace of quercetin was involved in the interaction with alginate molecule in the preparation process.
XRD
X-ray diffraction was performed to study the crystallinity of samples. The characteristic peaks of sodium alginate (Fig. 3b) rose at 13.56 °, 20.74 °, 21.64 °, 24.06 °, 28.96 °, 36.64 °, and 38.40 ° (2θ), demonstrating its semi-crystalline nature [23]. The crystalline nature of quercetin was confirmed by distinct peaks at 10.70 °, 12.32 °, 13.36 °, 16.02 °, 17.76 °, 23.76 °, 27.36 °, 38.6 °, and 40.84 ° [24, 25]. However, the AN and Q-AN exhibited no distinct peaks but broad ones. Similar phenomena of microcrystallites observation in amorphous structure were also reported by some research [26–28]. One of the reasons for this is that the gelation processes changed the spatial structure of sodium alginate. And another reason accounted for the intermolecular interaction occurring between quercetin and sodium alginate. Similar phenomena that oridonin and quercetin transformed from crystal form to amorphous form when loaded in nanoparticles have also been observed by al [29, 30]. And this is accordance with the results obtained in TG-DTG-DSC and FT-IR analysis.
Batch adsorption of Pb(II)
Effect of pH
As shown in Fig. 4a, the Pb(II) adsorption rate increased from 33.66 to 82.74 % for AN and 42.46 to 84.52 % for Q-AN with the increase of pH from 2 to 7 (Eq. (1)). It was known that Pb2+, Pb(OH)+, Pb(OH)20, and Pb(OH)3− were frequently found in aqueous solution [31]. In acidic medium, Pb2+ was the major lead species. And a small portion of Pb(OH)+ was present with the pH increased to neutral condition [32]. At low pH, a high H+ concentration competed with Pb(II) cations for active sites on the surface of AN and Q-AN. Besides, the surface of AN and Q-AN turned into a negative charge when pH increased [33–35]. And it was confirmed by estimating the Zeta potential of AN and Q-AN at pH 2–7. Figure 4b indicates an obvious decrease of Zeta potential from −1.41 to −32.94 mV (AN) and −1.99 to −44.70 mV (Q-AN) when pH enhanced from 2 to 7. Namely, the more negative the nanoparticles are charged, the stronger is the electrostatic attraction between them and Pb(II). Therefore, an increasing acidic medium facilitated Pb(II) adsorption by affecting both the lead species and adsorbent surface.
Fig. 4.
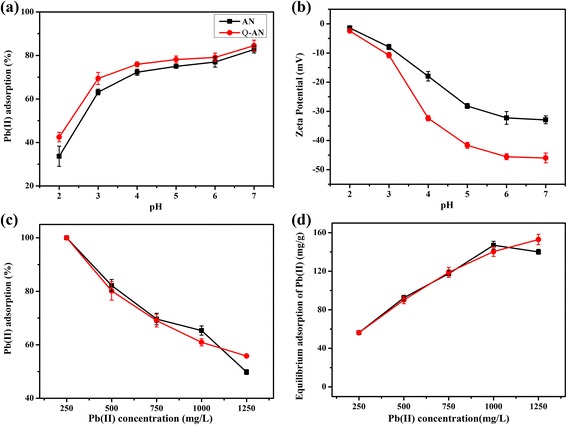
a The effect of pH on the adsorption of Pb(II) ions; the initial concentration of Pb(II) ions was 500 mg L−1. b The effect of pH on the Zeta potential of AN and Q-AN; the initial concentration of Pb(II) ions was 500 mg L−1. c The effect of initial Pb(II) concentration on the adsorption of Pb(II); the initial pH was 7. d The effect of initial Pb(II) concentration on the equilibrium adsorption of Pb(II); the initial pH was 7
Effect of Initial Pb(II) Concentration
Adsorptive removal of Pb(II) at various initial concentration from 250 to 1250 mg L−1 was also studied. As illustrated by AN and Q-AN adsorption curves (Fig. 4c), the Pb(II) adsorption rate decreased with the increase of initial Pb(II) concentration. It was attributed to the enhanced quantity of Pb(II) competition for the limited adsorption sites, and thus, the adsorption rate decreased at a higher initial Pb(II) concentration. However, Fig. 4d demonstrated that a higher initial Pb(II) concentration gave rise to a higher equilibrium adsorption capacity. The reason was that superfluous Pb(II) made sure of a more efficient use of the adsorbent. The mechanism for Pb(II) adsorption was further studied by investigating the XPS spectra of Pb(II)-adsorbed Q-AN (Fig. 5). The high-resolution spectra showed two peaks at 138.6 and 143.0 eV, which were primarily attributable to binding energies for Pb 4f7/2 and Pb 4f5/2 orbital, respectively [36]. Thus, it demonstrated the existence of Pb2+ (Pb–O bond), and this was consistent with previous reports [11, 37].
Fig. 5.
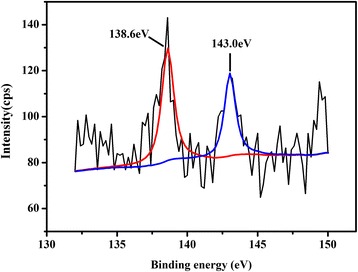
XPS spectra of Pb(II)-adsorbed Q-AN
Effect of Other Co-existing Metal
Co-existing metal might compete with Pb(II) for the adsorption sites on the adsorbents; thus, three typical heavy metals, Mn, Co, and Cd, were added into the reaction solution to estimate their effects on Pb(II) adsorption. As shown in Fig. 6, the presence of examined metals with a concentration of 100 mg L−1 only caused a 10–20 mg L−1 decrease in removal rate of Pb(II). In Fig. 7, about 20–40 mg L−1 decrease of the co-existing metals was observed. In the presence of a single metal, a 80.10–85.66 % absorption rate was achieved by both AN and Q-AN. However, when Mn(II), Co(II), and Cd(II) were co-existing, the AN group got an absorption rate of 77.86 %, which was 2.29 % lower than that in the Q-AN group. Generally, the results illustrated that both the AN and Q-AN were effective adsorbents for Pb(II) in aqueous solution, and the presence of abovementioned ions had slight impact on Pb(II) adsorption [11, 23].
Fig. 6.
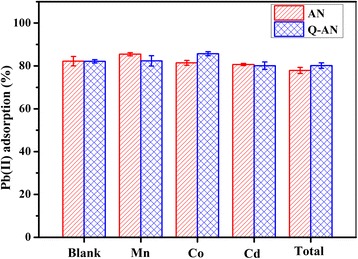
The effect of co-existing metal on the adsorption of Pb(II). The initial concentrations of Pb(II) and co-existing metal were 500 and 100 mg L−1, respectively. The initial pH was 7
Fig. 7.
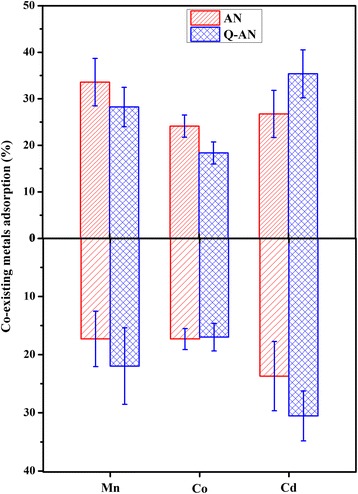
The adsorption rate of co-existing metal. The upper part was only the single co-existing metal present in the solution. The bottom half was all three co-existing metals present in the solution. The initial concentrations of Pb(II) and co-existing metal were 500 and 100 mg L−1, respectively. The initial pH was 7
Adsorption Capability and Desorption Rate
The adsorption capability of AN and Q-AN for Pb(II) were 147.02 and 140.37 mg L−1 (Eq. (2)). Comparatively, the maximum adsorption capacity of sodium alginate-related nano-adsorbents has been listed in Table 2. The data reported in Table 2 illustrated that AN and Q-AN was comparable to or higher than some of the other adsorbents. The desorption experiment was also conducted to estimate the recovery rate of Pb(II) absorbed on AN and Q-AN. Before the desorption experiment, the AN and Q-AN used for this desorption experiment firstly reached the equilibrium adsorption in 500 mg L−1 at pH 7. And the desorption experiment was carried out in 0.1 M HCl [38, 39]. The amount of Pb(II) desorbed was calculated, and the desorption rates of AN and Q-AN were 83.26 ± 7.46 % and 90.07 ± 3.39 % (Table 1), respectively.
Table 2.
Maximum adsorption capacity of sodium alginate related nano-adsorbents for Pb(II) removal from aqueous media
| Sodium alginate-related nano-adsorbents | Maximum adsorption capacity (mg/g) | Reference |
|---|---|---|
| Silica nanopowders/alginate composite | 83.33 | [15] |
| TSTC [4] AS-s-SA nanogel | 16.9 | [23] |
| Superparamagnetic Fe3O4@TSTC [4] AS-s-SA nanocomposite | 19.96 | [23] |
| Magnetic alginate beads based on maghemite nanoparticles | 50 | [40] |
| Polyaniline nanofibers assembled on alginate microsphere | 251.25 | [41] |
Conclusions
In this study, AN and Q-AN were prepared with the technique of nano-emulsions coupled with external gelation. These nanoparticles turned out to be effective for the removal of Pb(II) from aqueous solutions. Compared with the diameter of AN, that of Q-AN underwent an obvious decrease from 95.06 to 58.23 nm. The removal of Pb(II) is found to be highly pH-dependent, and the optimal pH value was 7 among examined pHs. Under the conditions of 1000 mg L−1 Pb(II) at pH 7, the adsorption capability of AN and Q-AN were similar, which were 147.02 ± 3.91 mg g−1 and 140.37 ± 5.04 mg g−1, respectively. The Pb(II) desorption rate of AN and Q-AN were 83.26 ± 7.46 % and 90.07 ± 3.39 %, respectively. Generally, Q-AN got a slightly higher quality for Pb(II) removal than AN. Though further research is required to illustrate the mechanism of marked nanoparticle diameter decrease after the decoration of quercetin, the satisfactory Pb(II) removal rate illustrated that AN and Q-AN are promising adsorbents, which are probably to obtain wide application.
Acknowledgements
The authors gratefully acknowledge the financial support from the National Natural Science Foundation of China (51108310) and State Scholarship Fund from China Scholarship Council (201406255066).
Footnotes
Competing interests
The authors declare that they have no competing interests.
Authors’ contributions
MJ wrote the paper and performed the characterization experiment and Pb(II) removal experiment. XZ and MJ performed the preparation experiment. YQ helped to draft the manuscript. YQ, YLC, and LZ incorporated the final corrections into the manuscript. All authors read and approved the final manuscript.
Contributor Information
Yun Qi, Phone: +86-22-27891291, Email: qiyun@tju.edu.cn, Email: yun.qi@sydney.edu.au.
Meng Jiang, Email: jmeng@tju.edu.cn.
Yuan-Lu Cui, Phone: +86-22-59596170, Email: cuiyl@tju.edu.cn.
Lin Zhao, Email: zhaolin@tju.edu.cn.
Xia Zhou, Email: zhouxiajob@126.com.
References
- 1.Flora G, Gupta D, Tiwari A. Toxicity of lead: a review with recent updates. Interdiscip Toxicol. 2012;5(2):47–58. doi: 10.2478/v10102-012-0009-2. [DOI] [PMC free article] [PubMed] [Google Scholar]
- 2.Karthik R, Meenakshi S. Chemical modification of chitin with polypyrrole for the uptake of Pb(II) and Cd(II) ions. Int J Biol Macromol. 2015;78:157–64. doi: 10.1016/j.ijbiomac.2015.03.041. [DOI] [PubMed] [Google Scholar]
- 3.Guan Y, Shao C, Ju M. Heavy metal contamination assessment and partition for industrial and mining gathering areas. Int J Environ Res Public Health. 2014;11(7):7286–303. doi: 10.3390/ijerph110707286. [DOI] [PMC free article] [PubMed] [Google Scholar]
- 4.Sansar W, Ahboucha S, Gamrani H. Chronic lead intoxication affects glial and neural systems and induces hypoactivity in adult rat. Acta Histochem. 2011;113(6):601–7. doi: 10.1016/j.acthis.2010.06.005. [DOI] [PubMed] [Google Scholar]
- 5.Cheng H, Hu Y. Lead (Pb) isotopic fingerprinting and its applications in lead pollution studies in China: a review. Environ Pollut. 2010;158(5):1134–46. doi: 10.1016/j.envpol.2009.12.028. [DOI] [PubMed] [Google Scholar]
- 6.Luo S, Lu T, Peng L, Shao J, Zeng Q, Gu J-D. Synthesis of nanoscale zero-valent iron immobilized in alginate microcapsules for removal of Pb(II) from aqueous solution. J Mater Chem A. 2014;2(37):15463–72. doi: 10.1039/C4TA02920H. [DOI] [Google Scholar]
- 7.Tang Q, Tang X, Li Z, Chen Y, Kou N, Sun Z. Adsorption and desorption behaviour of Pb(II) on a natural kaolin: equilibrium, kinetic and thermodynamic studies. J Chem Technol Biotechnol. 2009;84(9):1371–80. doi: 10.1002/jctb.2192. [DOI] [Google Scholar]
- 8.Yang B-Y, Cao Y, Qi F-F, Li X-Q, Xu Q. Atrazine adsorption removal with nylon6/polypyrrole core-shell nanofibers mat: possible mechanism and characteristics. Nanoscale Res Lett. 2015;10. [DOI] [PMC free article] [PubMed]
- 9.Feng Q, Zhang Z, Ma Y, He X, Zhao Y, Chai Z. Adsorption and desorption characteristics of arsenic onto ceria nanoparticles. Nanoscale Res Lett. 2012;7:1–8. doi: 10.1186/1556-276X-7-1. [DOI] [PMC free article] [PubMed] [Google Scholar]
- 10.Kim JO, Park JK, Kim JH, Jin SG, Yong CS, Li DX, Choi JY, Woo JS, Yoo BK, Lyoo WS, Kim JA, Choi HG. Development of polyvinyl alcohol-sodium alginate gel-matrix-based wound dressing system containing nitrofurazone. International Int J Pharm. 2008;359(1–2):79–86. doi: 10.1016/j.ijpharm.2008.03.021. [DOI] [PubMed] [Google Scholar]
- 11.Zhang S, Xu F, Wang Y, Zhang W, Peng X, Pepe F. Silica modified calcium alginate-xanthan gum hybrid bead composites for the removal and recovery of Pb(II) from aqueous solution. Chem Eng J. 2013;234:33–42. doi: 10.1016/j.cej.2013.08.102. [DOI] [Google Scholar]
- 12.Wang W, Zong L, Wang A. A nanoporous hydrogel based on vinyl-functionalized alginate for efficient absorption and removal of Pb2+ ions. Int J Biol Macromol. 2013;62:225–31. doi: 10.1016/j.ijbiomac.2013.08.038. [DOI] [PubMed] [Google Scholar]
- 13.Googerdchian F, Moheb A, Emadi R. Lead sorption properties of nanohydroxyapatite-alginate composite adsorbents. Chem Eng J. 2012;200:471–9. doi: 10.1016/j.cej.2012.06.084. [DOI] [Google Scholar]
- 14.Badruddoza AZM, Tay ASH, Tan PY, Hidajat K, Uddin MS. Carboxymethyl-beta-cyclodextrin conjugated magnetic nanoparticles as nano-adsorbents for removal of copper ions: synthesis and adsorption studies. J Hazard Mater. 2011;185(2–3):1177–86. doi: 10.1016/j.jhazmat.2010.10.029. [DOI] [PubMed] [Google Scholar]
- 15.Soltani RDC, Khorramabadi GS, Khataee AR, Jorfi S. Silica nanopowders/alginate composite for adsorption of lead (II) ions in aqueous solutions. J Taiwan Inst Chem E. 2014;45(3):973–80. doi: 10.1016/j.jtice.2013.09.014. [DOI] [Google Scholar]
- 16.Wang W, Liu X, Xie Y, Zhang H, Yu W, Xiong Y, Xie W, Ma X. Microencapsulation using natural polysaccharides for drug delivery and cell implantation. J Mater Chem. 2006;16(32):3252–67. doi: 10.1039/b603595g. [DOI] [Google Scholar]
- 17.Qi Y, Jiang M, Cui Y-L, Zhao L, Liu S. Novel reduction of Cr(VI) from wastewater using a naturally derived microcapsule loaded with rutin-Cr(III) complex. J Hazard Mater. 2015;285:336–45. doi: 10.1016/j.jhazmat.2014.12.008. [DOI] [PubMed] [Google Scholar]
- 18.Machado AHE, Lundberg D, Ribeiro AJ, Veiga FJ, Lindman B, Miguel MG, Olsson U. Preparation of calcium alginate nanoparticles using water-in-oil (W/O) nanoemulsions. Langmuir. 2012;28(9):4131–41. doi: 10.1021/la204944j. [DOI] [PubMed] [Google Scholar]
- 19.Zhu D, Li W, Wen H-M, Hu Y, Wang J, Zhu J-M, Ni W-T, Gu C-Q. Development of polyacrylic acid-functionalized porous zinc sulfide nanospheres for a non-aqueous solid phase extraction procedure toward alkaloids. Rsc Adv. 2015;5(38):29820–7. doi: 10.1039/C5RA02827B. [DOI] [Google Scholar]
- 20.Bolko K, Zvonar A, Gasperlin M. Mixed lipid phase SMEDDS as an innovative approach to enhance resveratrol solubility. Drug Dev Ind Pharm. 2014;40(1):102–9. doi: 10.3109/03639045.2012.749888. [DOI] [PubMed] [Google Scholar]
- 21.Soares JP, Santos JE, Chierice GO, Cavalheiro ETG. Thermal behavior of alginic acid and its sodium salt. Eclet Quím. 2004;29(2):57–63. doi: 10.1590/S0100-46702004000200009. [DOI] [Google Scholar]
- 22.de Mello Costa AR, Marquiafavel FS, Lima Leite Vaz MMO, Rocha BA, Pires Bueno PC, Amaral PLM, Barud HS, Ap Berreta-Silva A. Quercetin-PVP K25 solid dispersions: preparation, thermal characterization and antioxidant activity. J Therm Anal Calorim. 2011;104(1):273–8. doi: 10.1007/s10973-010-1083-3. [DOI] [Google Scholar]
- 23.Lakouraj MM, Mojerlou F, Zare EN. Nanogel and superparamagnetic nanocomposite based on sodium alginate for sorption of heavy metal ions. Carbohydr Polym. 2014;106:34–41. doi: 10.1016/j.carbpol.2014.01.092. [DOI] [PubMed] [Google Scholar]
- 24.Sri KV, Kondaiah A, Ratna JV, Annapurna A. Preparation and characterization of quercetin and rutin cyclodextrin inclusion complexes. Drug Dev Ind Pharm. 2007;33(3):245–53. doi: 10.1080/03639040601150195. [DOI] [PubMed] [Google Scholar]
- 25.Zhang L, Yang X, Li S, Gao W. Preparation, physicochemical characterization and in vitro digestibility on solid complex of maize starches with quercetin. Lwt-Food Science and Technology. 2011;44(3):787–92. doi: 10.1016/j.lwt.2010.09.001. [DOI] [Google Scholar]
- 26.Rudee ML, Howie A. The structure of amorphous Si and Ge. Philos Mag. 1972;25(4):1001–7. doi: 10.1080/14786437208229319. [DOI] [Google Scholar]
- 27.Herd SRaC P. On the question of microcrystallites in some amorphous materials. An electron microscope investigation. Physica Status Solidi (a) 1974;26:627–42. doi: 10.1002/pssa.2210260228. [DOI] [Google Scholar]
- 28.Collins RW, Ferlauto AS, Ferreira GM, Chen C, Koh J, Koval RJ, Lee Y, Pearce JM, Wronski CR. Evolution of microstructure and phase in amorphous, protocrystalline, and micro crystalline silicon studied by real time spectroscopic ellipsometry. Sol Energ Mat Sol C. 2003;78(1–4):143–80. doi: 10.1016/S0927-0248(02)00436-1. [DOI] [Google Scholar]
- 29.Wu T-H, Yen F-L, Lin L-T, Tsai T-R, Lin C-C, Cham T-M. Preparation, physicochernical characterization, and antioxidant effects of quercetin nanoparticles. Int J Pharm. 2008;346(1–2):160–8. doi: 10.1016/j.ijpharm.2007.06.036. [DOI] [PubMed] [Google Scholar]
- 30.Xing J, Zhang D, Tan T. Studies on the oridonin-loaded poly(D, L-lactic acid) nanoparticles in vitro and in vivo. Int J Biol Macromol. 2007;40(2):153–8. doi: 10.1016/j.ijbiomac.2006.07.001. [DOI] [PubMed] [Google Scholar]
- 31.Xu D, Tan X, Chen C, Wang X. Removal of Pb(II) from aqueous solution by oxidized multiwalled carbon nanotubes. J Hazard Mater. 2008;154(1–3):407–16. doi: 10.1016/j.jhazmat.2007.10.059. [DOI] [PubMed] [Google Scholar]
- 32.Machida M, Yamazaki R, Aikawa M, Tatsumoto H. Role of minerals in carbonaceous adsorbents for removal of Pb(II) ions from aqueous solution. Sep Purif Technol. 2005;46(1–2):88–94. doi: 10.1016/j.seppur.2005.04.015. [DOI] [Google Scholar]
- 33.Li Z, Ge Y, Wan L. Fabrication of a green porous lignin-based sphere for the removal of lead ions from aqueous media. J Hazard Mater. 2015;285:77–83. doi: 10.1016/j.jhazmat.2014.11.033. [DOI] [PubMed] [Google Scholar]
- 34.Park D, Lim SR, Yun YS, Park JM. Development of a new Cr(VI)-biosorbent from agricultural biowaste. Bioresour Technol. 2008;99(18):8810–8. doi: 10.1016/j.biortech.2008.04.042. [DOI] [PubMed] [Google Scholar]
- 35.Obeid L, El Kolli N, Dali N, Talbot D, Abramson S, Welschbillig M, Cabuil V, Bee A. Adsorption of a cationic surfactant by a magsorbent based on magnetic alginate beads. J Colloid Interface Sci. 2014;432:182–9. doi: 10.1016/j.jcis.2014.06.027. [DOI] [PubMed] [Google Scholar]
- 36.So H-M, Choi H, Shim HC, Lee S-M, Jeong S, Chang WS. Atomic layer deposition effect on the electrical properties of Al2O3-passivated PbS quantum dot field-effect transistors. Appl Phys Lett. 2015;106(9).
- 37.Chen D, Chen G, Wang Q, Jin R, Wang Y, Pei J, Xu H, Shi X. Facile hydrothermal synthesis of AgPb10LaTe12 materials: controlled synthesis, growth mechanism and shape-dependent electrical transportation properties. Crystengcomm. 2012;14(22):7771–9. doi: 10.1039/c2ce25512j. [DOI] [Google Scholar]
- 38.Abu Al-Rub FA, El-Naas MH, Benyahia F, Ashour I. Biosorption of nickel on blank alginate beads, free and immobilized algal cells. Process Biochem. 2004;39(11):1767–73. doi: 10.1016/j.procbio.2003.08.002. [DOI] [Google Scholar]
- 39.Silva RMP, Manso JPH, Rodrigues JRC, Lagoa RJL. A comparative study of alginate beads and an ion-exchange resin for the removal of heavy metals from a metal plating effluent. J Environ Sci Health A. 2008;43(11):1311–7. doi: 10.1080/10934520802177953. [DOI] [PubMed] [Google Scholar]
- 40.Idris A, Ismail NSM, Hassan N, Misran E, Ngomsik A-F. Synthesis of magnetic alginate beads based on maghemite nanoparticles for Pb(II) removal in aqueous solution. J Ind Eng Chem. 2012;18(5):1582–9. doi: 10.1016/j.jiec.2012.02.018. [DOI] [Google Scholar]
- 41.Jiang N, Xu Y, Dai Y, Luo W, Dai L. Polyaniline nanofibers assembled on alginate microsphere for Cu2+ and Pb2+ uptake. J Hazard Mater. 2012;215:17–24. doi: 10.1016/j.jhazmat.2012.02.026. [DOI] [PubMed] [Google Scholar]