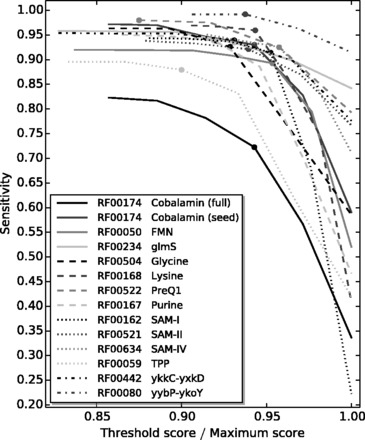
Fig. 3.

Sensitivity values for each riboswitch family over a range of S1 values. To display the results on a common x-axis, S1 values are normalized by the maximum possible motif identity score for each family. The filled circle on each curve marks the value of S1 in that riboswitch’s default definition file
