

Abstract
The major signaling pathways regulating gastric stem cells are unknown. Here we report that Notch signaling is essential for homeostasis of LGR5+ antral stem cells. Pathway inhibition reduced proliferation of gastric stem and progenitor cells, while activation increased proliferation. Notch dysregulation also altered differentiation, with inhibition inducing mucous and endocrine cell differentiation while activation reduced differentiation. Analysis of gastric organoids demonstrated that Notch signaling was intrinsic to the epithelium and regulated growth. Furthermore, in vivo Notch manipulation affected the efficiency of organoid initiation from glands and single Lgr5-GFP stem cells, suggesting regulation of stem cell function. Strikingly, constitutive Notch activation in LGR5+ stem cells induced tissue expansion via antral gland fission. Lineage tracing using a multi-colored reporter demonstrated that Notch-activated stem cells rapidly generate monoclonal glands, suggesting a competitive advantage over unmanipulated stem cells. Notch activation was associated with increased mTOR signaling, and mTORC1 inhibition normalized NICD-induced increases in proliferation and gland fission. Chronic Notch activation induced undifferentiated, hyper-proliferative polyps, suggesting that aberrant activation of Notch in gastric stem cells may contribute to gastric tumorigenesis.
Keywords: gastric cancer, gastric organoids, gland fission, gastric stem cells, mTOR
See also: X Yin & JM Karp (October 2015)
Introduction
The gastric epithelium is sustained by a population of stem cells located in the isthmus in the gastric corpus and at the gland base in the gastric antrum. Gastric stem cells give rise to differentiated epithelial cell lineages that turn over at rates ranging from a few days for surface mucous cells (Karam & Leblond, 1993a) to several months for zymogenic chief cells (Karam & Leblond, 1993b). The R-spondin receptor LGR5 has been described to mark a population of active stem cells at the base of the antral glands that generate transit amplifying (TA) daughter cells, which subsequently differentiate into the various mature cell types (Barker et al, 2010; Leushacke et al, 2013). The molecular mechanisms that regulate gastric stem cell number, proliferation and differentiation to maintain overall tissue homeostasis are not fully understood.
Mouse gastric glands are initially polyclonal, or composed of differentiated cells derived from multiple stem cells, and reach monoclonality around 6 weeks of age (Nomura et al, 1998). Similar to intestine, monoclonal conversion in the stomach is thought to follow neutral drift dynamics, where stem cells divide symmetrically and stochastically adopt either a stem or TA progenitor cell fate based on competition for niche space (Snippert et al, 2010; Leushacke et al, 2013). Additionally, a recent report showed that LGR5+ antral stem cell clones can expand via gland fission (Leushacke et al, 2013). Mathematical modeling studies have suggested that such fission results from a doubling of gland size due to an increase in stem cell numbers (Loeffler et al, 1997). In mouse, gland fission is highest at postnatal day 2 and plateaus at postnatal day 105 (Nomura et al, 1998), which follows the timeline for cellular maturation of the gastric glands (Keeley & Samuelson, 2010).
The Notch signaling pathway promotes progenitor cell proliferation and absorptive cell differentiation in the adult intestine (Fre et al, 2005; Stanger et al, 2005) and is required for intestinal stem cell maintenance (VanDussen et al, 2012). Emerging data suggest that Notch may have similar effects on gastric epithelial cell homeostasis. In the developing stomach, gene expression of Notch ligands Jag1,Dll1 and Dll3, Notch receptors Notch1–3 and the Notch target genes Hes1 and Hes3 has been reported (Jensen et al, 2000; Kim & Shivdasani, 2011). Furthermore, mice lacking the Notch target gene Hes1 show increased endocrine cell differentiation in the embryonic stomach (Jensen et al, 2000), suggesting that Notch signaling inhibits endocrine cell differentiation. In the adult stomach, pharmacologic inhibition of the Notch pathway was observed to reduce progenitor cell proliferation in both corpus and antrum, and increase mucous cell differentiation (Kim & Shivdasani, 2011). Furthermore, Notch activation in parietal progenitor cells induced poorly differentiated corpus tumors (Kim & Shivdasani, 2011). Together, these findings highlight a key role for Notch in regulating gastric epithelial cell differentiation. However, Notch regulation of LGR5+ gastric stem cells to maintain tissue function is unknown. Furthermore, Notch-regulated effectors have not been identified for the gastric epithelium.
Here we describe an analysis of Notch regulation of stem cell homeostasis in the gastric antrum. Our data demonstrate that Notch regulates LGR5+ gastric stem cells to control cellular proliferation and differentiation to maintain epithelial cell homeostasis. We also demonstrate that constitutive Notch activation in LGR5+ antral stem cells induces gland fission and tissue expansion associated with activation of mTOR signaling, with long-term Notch activation leading to antral polyp development.
Results
Notch signaling induces proliferation of LGR5+ antral stem cells
We tested whether antral stem cells exhibited Notch signaling activity by lineage tracing with NIP1::CreERT2; ROSAEYFP mice (see Materials and Methods for mouse strain nomenclature). Active Notch1 signaling was demonstrated by single YFP+ epithelial cells at the base of the antral glands 3 days post-tamoxifen (TX) treatment (Fig1B, arrowhead), as well as fully labeled YFP+ antral glands 8 weeks post-TX (Fig1C). This analysis also revealed active Notch signaling in non-epithelial cells (Fig1B and C, arrows). Immuno-histochemistry for the Notch target gene Hes1 revealed expression in epithelial cells at the antral gland base as well as in mesenchymal cells, consistent with the lineage tracing data (Fig1D).
Figure 1.
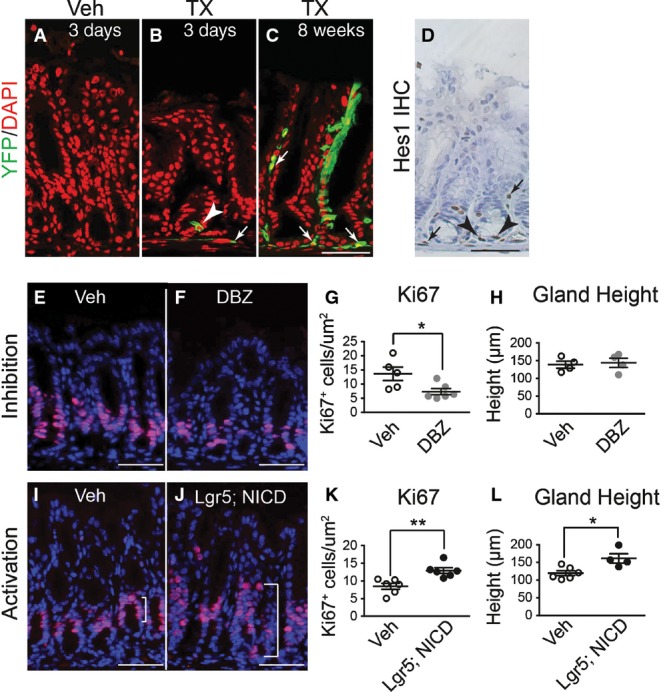
- A–C Frozen tissue sections from the gastric antrum of vehicle- (A) or tamoxifen (TX)-treated (B and C) NIP1::CreERT2ROSAEYFP mice immunostained for YFP expression to evaluate lineage tracing 3 days (B) or 8 weeks (C) after treatment. Both epithelial (arrowhead) and mesenchymal (arrows) cells exhibit active Notch1 signaling (EYFP expression). DAPI (red) was used as a nuclear counterstain. Scale bar: 50 μm.
- D Paraffin section immunostained for HES1 showing both epithelial (arrowheads) and mesenchymal (arrows) cell expression. Scale bar: 50 μm.
- E–G Paraffin sections from (E) vehicle- (n = 5) or (F) DBZ-treated (n = 6) mice were immunostained for the proliferation marker Ki67 (red), and (G) the number of Ki67+ cells quantified (mean ± SE). DAPI (blue) was used as a nuclear counterstain. Scale bars: 50 μm. *P = 0.03 versus vehicle using Student's t-test.
- H Analysis of antral gland height in vehicle- (n = 4) or DBZ-treated (n = 4) mice (mean ± SE).
- I–K Paraffin sections from (I) vehicle- (n = 6) or (J) TX-treated (n = 6) Lgr5; ROSANICD mice were immunostained for the proliferation marker Ki67 (red), and (K) the number of Ki67+ cells quantified (mean ± SE). DAPI (blue) was used as a nuclear counterstain. Scale bars: 50 μm. **P = 0.004 versus vehicle using Student's t-test.
- L Analysis of antral gland height in vehicle- (n = 6) or TX-treated (n = 4) Lgr5; ROSANICD mice (mean ± SE). *P = 0.016 versus vehicle using Student's t-test.
To test the importance of Notch signaling for gastric antral stem cell homeostasis, we examined cellular proliferation after treatment of adult mice with the gamma-secretase inhibitor (GSI) dibenzazepine (DBZ) to block Notch signaling. Notch inhibition reduced epithelial cell proliferation, as shown by a reduction in Ki67+ cells (Fig1E–G). A similar reduction in epithelial cell proliferation was observed when Notch function was impaired via genetic deletion of the DNA-binding protein RBPJ-κ (Fig EV1), suggesting that the effects of DBZ are primarily due to inhibition of Notch signaling.
Figure EV1. Genetic Notch inhibition decreases cell proliferation and induces endocrine cell differentiation.
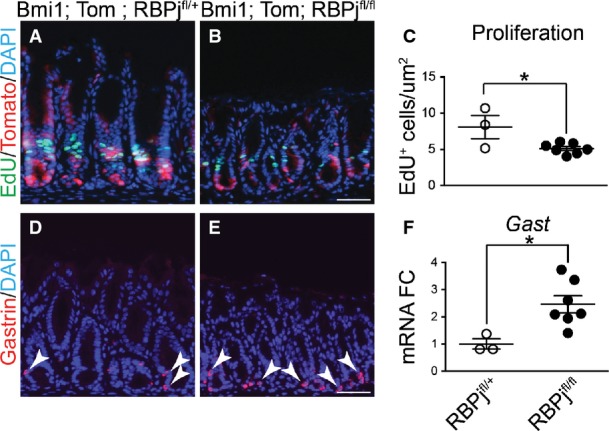
- A–C Proliferation was measured in antral paraffin sections via EdU detection after incorporation for 2 h (mean ± SEM). *P = 0.023 versus RBPjfl/+ using Student's t-test.
- D, E Cellular differentiation was measured by immunostaining for gastrin-expressing endocrine cells. Scale bars: 50 μm.
- F Gastrin gene expression was measured by qRT–PCR analysis of antral RNA (mean ± SEM;n = 3–7 mice). *P = 0.02 versus RBPjfl/+ using Student's t-test.
We next tested the consequences of Notch activation in LGR5+ stem cells in Lgr5; ROSANICD mice treated with TX. We found that 57 ± 6% (n = 3) of antral glands were NICD+ at 1 month post-TX, consistent with the mosaic expression pattern of the Lgr5-GFP-CreERT2 driver. In accordance with the results of Notch inhibition, epithelial cell proliferation in Lgr5; ROSANICD mice was significantly increased after expression of NICD, with an expansion of the proliferative zone (Fig1I–K) and an increase in antral gland height (Fig1L). Gland height after Notch inhibition was normal (Fig1H). Together, the Notch inhibition and activation data suggest an important role for this pathway in regulating antral epithelial cell proliferation.
To directly investigate antral stem cells, we measured proliferation of LGR5+ cells by co-immunostaining for GFP and Ki67 in Notch-manipulated Lgr5-EGFP-CreERT2 mice (Fig2 and Appendix Fig S1). DBZ treatment caused a 4.5-fold reduction in the number of proliferating LGR5+ stem cells (Fig2A) while NICD expression induced a three-fold increase in LGR5+ stem cell proliferation (Fig2C).
Figure 2.

- A–D Gastric stem cell proliferation was measured by morphometric analysis of GFP/Ki67 cell numbers in Notch-inhibited or Notch-activated antral tissue, showing decreased LGR5-GFP stem cell proliferation after DBZ treatment (A, n = 5) and increased stem cell proliferation in Lgr5; ROSANICD mice (C, n = 4) 1 month post-TX treatment. *P = 0.046 and **P = 0.002 versus vehicle using Student's t-test. (B, D) Olfm4 gene expression was measured by qRT–PCR in antral RNA from vehicle (n = 10) versus DBZ (n = 9) (*P = 0.033 using Student's t-test) and vehicle (n = 3) versus Lgr5; ROSANICD mice (n = 3) (*P = 0.026 using Student's t-test) 1 month post-TX treatment. Data are expressed as mean ± SE.
- E–H Antral organoids were established from gastric glands isolated from mice treated with vehicle or DBZ, or from control (Lgr5) or Lgr5; ROSANICD mice 1 week post-TX. Scale bars: 200 μm.
- I–L Plating efficiency of antral organoids established from (I) vehicle (n = 3) or DBZ-treated (n = 3) mice (*P = 0.046 using Student's t-test) or (K) Lgr5 (n = 3) or Lgr5; ROSANICD mice (n = 3) 1 week post-TX (*P = 0.012 using Student's t-test). The number of organoids was counted 48 h post-plating, and normalized to the number of glands initially plated. (J, L) Organoid size was measured 4 days post-plating. (L) *P = 0.025 versus Lgr5 using Student's t-test. Data are expressed as mean ± SE.
- M–O Single Lgr5-GFP stem cells were isolated by FACS from vehicle (n = 4) or DBZ-treated (n = 4) mice. See Appendix Fig S4 for FACS gating scheme. (O) Organoid establishment efficiency was quantified 3 days post-plating. *P = 0.014 versus vehicle using Student's t-test. Data are expressed as mean ± SE.
Our previous study had identified olfactomedin 4 (Olfm4) as a direct transcriptional target of the Notch pathway (VanDussen et al, 2012). Accordingly, Olfm4 mRNA abundance in antral tissues was decreased with Notch inhibition (Fig2B) and increased with Notch activation (Fig2D).
To examine Notch regulation of LGR5+ stem cell activity, we tested the efficiency of antral organoid establishment from DBZ-treated mice or TX-treated Lgr5; ROSANICD mice. Organoid plating efficiency was significantly reduced in DBZ-treated mice (Fig2E, F and I), while plating efficiency in Lgr5; ROSANICD mice was higher compared to control (Fig2G, H and K). We also measured organoid establishment efficiency from single sorted LGR5+ stem cells isolated from vehicle or DBZ-treated mice. Although equal numbers of LGR5+ stem cells were plated per well, organoid efficiency from Notch-inhibited stem cells was significantly inhibited compared to control stem cells (Fig2M–O). These data suggest that Notch regulates organoid establishment, a finding that would be consistent with changes to stem cell activity or function.
We next tested whether Notch regulates in vitro growth of gastric epithelial cells by treatment of established WT organoids with the GSI DAPT. Consistent with our in vivo findings, Notch inhibition was observed to slow overall growth and proliferation (Figs3 and EV2) of antral organoids without affecting overall cellular integrity (Fig3H and J). Conversely, organoids established from Notch-activated mice grew faster than controls (Fig2L), consistent with the increased proliferation and increased antral gland height observed in tissue sections from these Notch-activated Lgr5; ROSANICD mice (Fig1L). To test whether Notch inhibition affected stem cell function in vitro, we measured organoid re-establishment after passaging. DAPT treatment markedly reduced the efficiency of new organoid formation, similar to our observation of reduced organoid initiation from DBZ-treated mice. Note that organoids established from DBZ-treated mice grew at the same rate in culture (Fig2J), suggesting that after release of Notch inhibition antral stem cells recover normal function. Together, our in vivo and in vitro findings suggest that Notch regulates antral stem cell activity.
Figure 3.
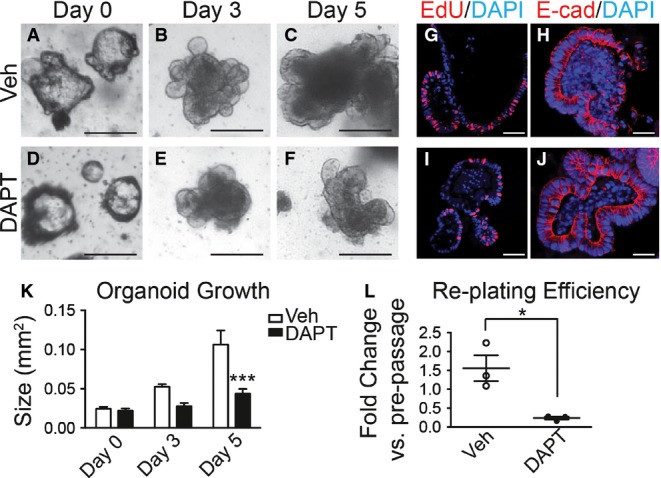
- A–F Growth was measured in established antral organoids after Notch inhibition. Morphology of antral organoids prior to treatment (A, D, day 0), or after treatment with vehicle (B, C) or 500 nM DAPT (E, F) for 3 and 5 days. Scale bars: 200 μm.
- G–J Frozen sections of vehicle- and DAPT-treated organoids stained for cellular proliferation by EdU incorporation (red) (G, I) and for cell morphology by immunostaining for E-cadherin (red) (H, J). Scale bars: 50 μm.
- K Growth was determined in vehicle- or DAPT-treated organoids by measuring size (mean ± SEM;n = 16–30 organoids per group); ***P < 0.001 versus vehicle using two-way ANOVA.
- L Efficiency of organoid re-establishment after 5 days of treatment with vehicle or DAPT (mean ± SEM;n = 3 wells per group); *P = 0.019 versus vehicle using Student's t-test.
Figure EV2. Notch regulates antral organoid growth.
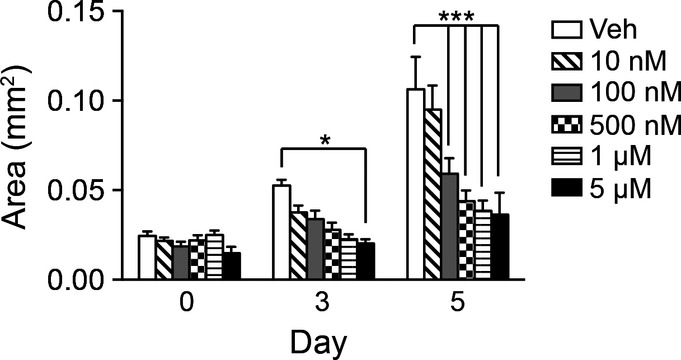
Antral organoid growth was measured in response to vehicle or increasing concentrations of DAPT (10 nM–5 μM) (mean ± SEM;n = 16–30 organoids per group). *P < 0.05, ***P < 0.001 versus vehicle using two-way ANOVA.
Notch manipulation disrupts antral epithelial cell differentiation
We tested whether Notch regulated epithelial cell differentiation by analyzing markers of surface mucous cells (Muc5ac; Fig4A–D), deep mucous cells (TFF2, Muc6; Fig4F–I) and hormone-secreting G cells (Gastrin; Fig4K–N) in the gastric antrum of Notch-inhibited (DBZ) and Notch-activated (Lgr5; ROSANICD) mice. Our data show that Notch inhibition resulted in a generalized increase in expression of markers of all epithelial cell lineages. In contrast, Notch activation led to a reduction in expression of these differentiated cell markers. We further tested expression of the key transcription factors regulating surface mucous cells (FoxQ1) (Verzi et al, 2008) (Fig4E), deep mucous cells (Spdef) (Horst et al, 2010) (Fig4J) and enteroendocrine cells (Neurog3) (Lee et al, 2002; Kokubu et al, 2008) (Fig4O) by quantifying mRNA abundance. The results follow the pattern of differentiated cell marker expression, with Notch inhibition increasing expression and Notch activation decreasing expression of these transcriptional regulators. Similar findings to pharmacologic Notch pathway inhibition were observed after genetic inhibition in Bmi1; ROSATom; RBPjfl/fl mice, with increased endocrine cell differentiation (Fig EV1).
Figure 4.
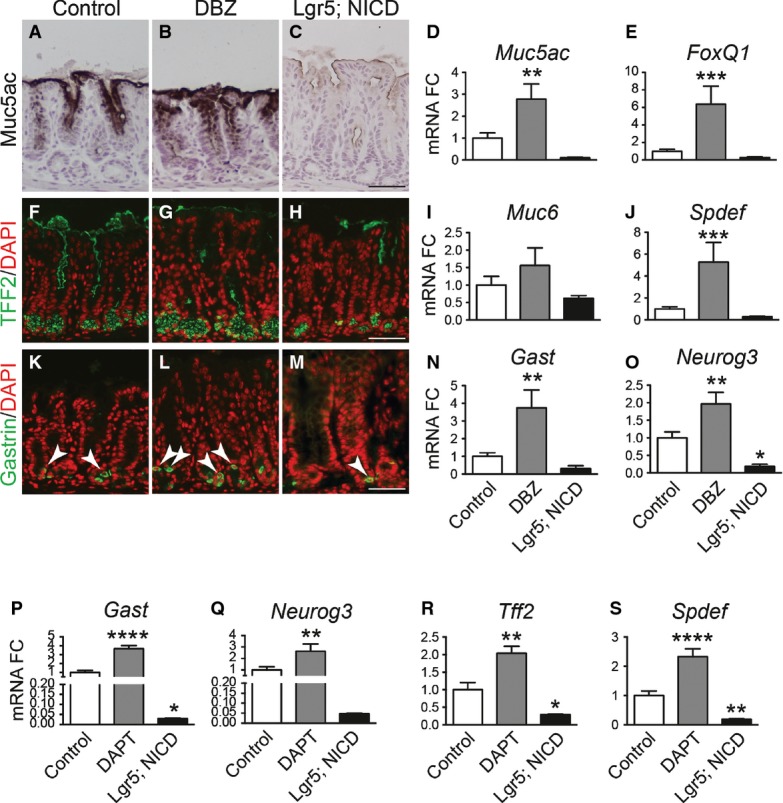
- A–O Analysis of surface mucous cells (A–E), deep mucous cells (F-J) or endocrine cells (K-O) by immunohistochemical analysis of antral paraffin sections and qRT–PCR analysis of antral RNA in control, DBZ and Lgr5; ROSANICD 4 weeks post-TX (mean ± SEM;n = 3–18 mice). *P < 0.05, **P < 0.01, ***P < 0.001 versus control using one-way ANOVA. Scale bars: 50 μm.
- P–S Analysis of endocrine and deep mucous cell lineages in control (n = 16), DAPT-treated (n = 8) and Lgr5; ROSANICD (n = 8) antral organoids (mean ± SEM). *P < 0.05, **P < 0.01, ****P < 0.0001 versus control using one-way ANOVA.
We also analyzed differentiation of cell lineages in control, DAPT-treated and Lgr5; ROSANICD organoids (Fig4P–S). Similar results to our in vivo studies were observed, where Notch inhibition induced differentiation of deep mucous and endocrine cells, and Notch activation suppressed organoid cell differentiation. These data further demonstrate the role of Notch in regulating differentiation of gastric antral stem cells.
Notch signaling regulates antral tissue growth
It has been postulated that gastrointestinal tissue growth during postnatal life occurs via gland or crypt fission in response to increased stem cell numbers (Totafurno et al, 1987; Nomura et al, 1998; Dehmer et al, 2011); therefore, we analyzed gland fission in response to Notch activation in LGR5+ stem cells. Histological examination of Lgr5; ROSANICD mice revealed that a significant fraction of antral glands were undergoing gland fission post-TX activation of NICD expression (Fig5). The gland fission observed in adult Lgr5; ROSANICD mice was similar to that observed in juvenile mice during postnatal stomach development (Fig5C). Morphometric quantification of gland fission in TX-treated control (Lgr5) and Lgr5; ROSANICD mice revealed a marked increase in the number of fission events at 1 and 4 weeks post-TX treatment (Fig5D). Gland fission was also apparent in isolated NICD-expressing antral glands, where both single and bifurcated glands exhibited increased proliferation compared to control (Fig5E–I).
Figure 5.
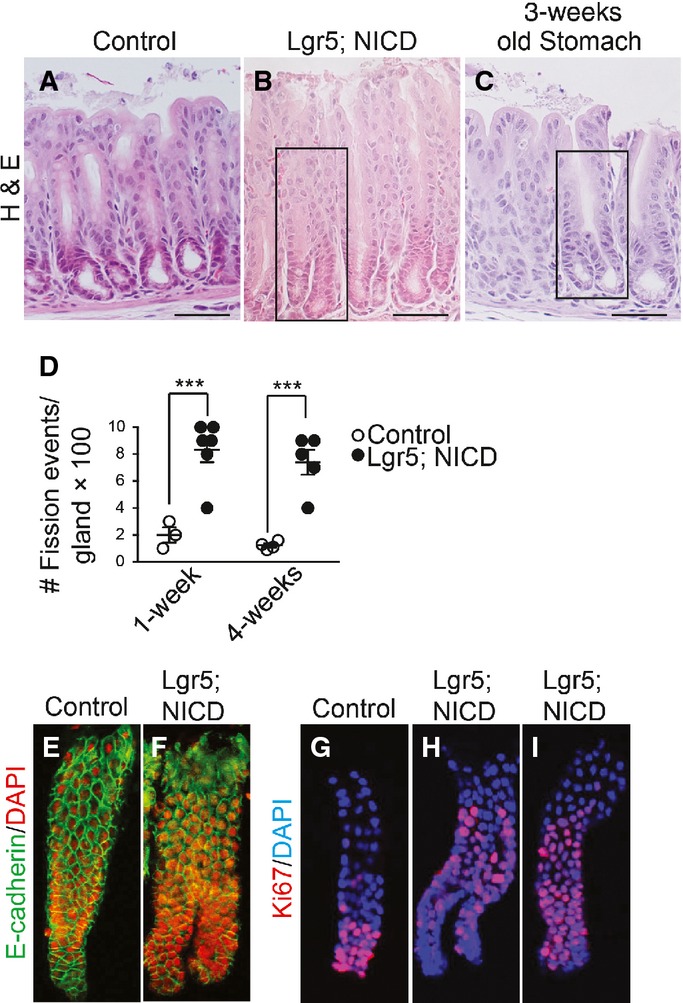
- A–C H&E-stained paraffin sections from (A) control or (B) Lgr5; ROSANICD stomach 4 weeks post-vehicle or TX treatment, or from (C) 3-week-old wild-type mouse stomach. Scale bars: 50 μm. Black rectangles indicate antral glands undergoing fission.
- D Quantification of gland fission events in control (Lgr5) and Lgr5; ROSANICD stomachs 1 or 4 weeks post-TX (mean ± SEM;n = 3–6 mice). ***P < 0.001 versus control using two-way ANOVA.
- E–I Confocal microscopic analysis of isolated glands immunostained for E-cadherin (green) with DAPI (red), or Ki67 (red) with DAPI (blue).
We next examined antral gland clonality during Notch activation. To test this, we utilized the multi-color ROSACon reporter (Snippert et al, 2010) crossed to Lgr5-EGFP-CreERT2 mice, where stochastic expression of one of four colors upon Cre activation allows for tracking of individual LGR5+ antral stem cells and their progeny. Analysis of Lgr5; ROSACon and Lgr5; ROSACon; ROSANICD mice revealed a significant increase in monoclonal, single-colored antral glands and a corresponding reduction in polyclonal, or multi-colored, glands in Lgr5; ROSACon; ROSANICD mice (Fig6). Monoclonal gland conversion was extremely rapid, with extensive single-color labeling apparent as early as 2 weeks post-TX in the NICD mice (Appendix Fig S2). Quantification of gland labeling at 5 and 8 weeks showed that while control mice contained approximately 50% single-colored glands, NICD-activated tissue contained > 90% monoclonal glands. We also observed that Notch activation caused a significant increase in clusters of same-colored adjoining antral glands (example outlined in Fig6D and Appendix Fig S2) compared to control mice, with a progressive increase in the number of clusters observed after NICD activation (Fig6G), providing further evidence that Notch activation induces gland fission.
Figure 6.
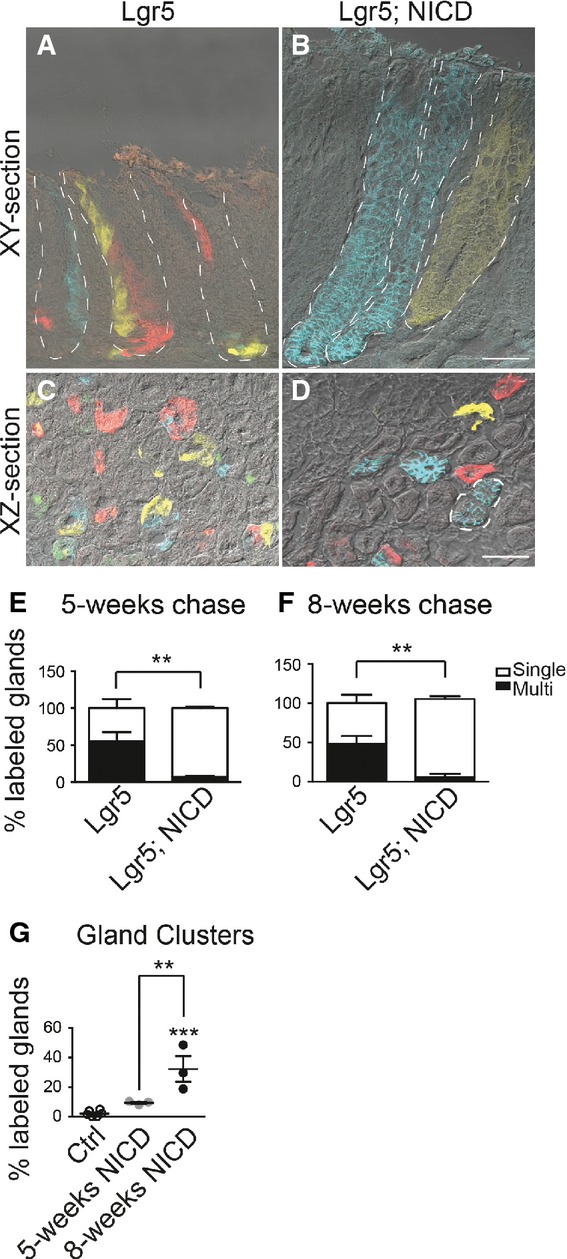
- A–D Frozen tissue sections from Lgr5; ROSACon (Lgr5) (A, C) and Lgr5; ROSACon; ROSANICD mice (Lgr5; NICD) (B, D) imaged for native YFP (yellow), RFP (red), membrane-bound CFP (blue), and nuclear GFP (green) fluorescence using confocal microscopy. Tissue was analyzed 8 weeks post-TX. White dashed lines outline individual glands (A, B) or a gland cluster (D). Scale bars: 50 μm.
- E, F Quantification of antral glands composed of multiple or single Confetti colors in Lgr5; ROSACon and Lgr5; ROSACon; ROSANICD mice (mean ± SEM;n = 3 mice) 5 or 8 weeks post-TX. **P < 0.01 versus control using two-way ANOVA.
- G Quantification of single-colored clustered antral glands in Lgr5; ROSACon and Lgr5; ROSACon; ROSANICD mice (mean ± SEM;n = 3 mice) 5 or 8 weeks post-TX. Controls are pooled from both time points. ***P < 0.001 versus control, **P < 0.01 versus 5 weeks using one-way ANOVA.
Chronic Notch activation induces antral polyps
Previous studies showed that human gastric cancer can exhibit elevated Notch pathway expression (Yeh et al, 2009; Sun et al, 2011; Hsu et al, 2012). Because our results showed increased stem cell proliferation post-Notch activation, as well as increased fission and monoclonal conversion of antral glands, we next questioned how long-term Notch activation would affect overall tissue architecture. Examination of Lgr5 and Lgr5; ROSANICD mice 6 months post-TX revealed multiple polyps in the gastric antrum of Notch-activated mice (Fig7B). Such polyps were never observed in control mice lacking ROSANICD (n = 12) (Fig7A) and have been observed in 100% of Lgr5; ROSANICD mice (n = 14). The antral tissue expansion significantly increased total stomach weight in Lgr5; ROSANICD mice (Fig7C).
Figure 7.
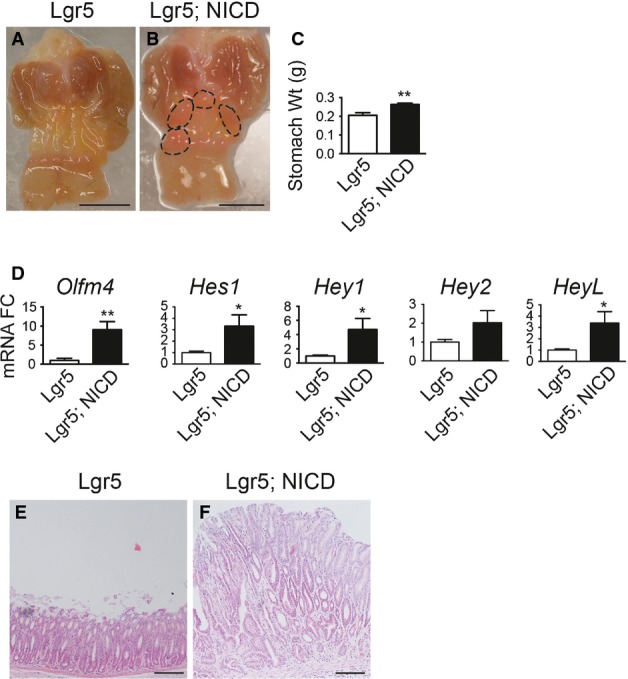
- A, B Gross histology of (A) Lgr5 and (B) Lgr5; ROSANICD stomach 6 months post-TX. Circles outline polyp areas. Scale bars: 0.5 cm.
- C Weight of control and Lgr5; ROSANICD stomach 6 months post-TX (mean ± SEM;n = 7 mice). **P = 0.003 versus control using Student's t-test.
- D qRT–PCR analysis of Notch target gene expression (mean ± SEM;n = 7 mice). *P < 0.05 or **P < 0.01 versus control using Student's t-test.
- E, F H&E-stained paraffin sections from (E) Lgr5 and (F) Lgr5; ROSANICD antrum revealed hypertrophic, disorganized glands after Notch activation. Scale bars: 100 μm.
Gene expression analysis revealed strong activation of Notch pathway components in Lgr5; ROSANICD antra, with significant induction of Olfm4,Hes1,Hey1 and HeyL (Fig7D). Histologically, the polyps contained hyperplastic, disorganized glands compared to control (Fig7E and F). Such polyps were hyper-proliferative (Fig8A) with strong expression of the stem/progenitor cell markers CD44 and Sox9 (Fig8B and C) and contained few differentiated cells (Fig8D–F). Interestingly, polyps were not apparent in intestine (Fig EV3) or skin, despite the presence of LGR5+ stem cells in these tissues (Barker et al, 2007; Jaks et al, 2008). We confirmed NICD activation in the Lgr5; ROSANICD intestine 1 month post-TX, showing the expected inhibition of goblet cell differentiation in crypt/villus units expressing NICD (FigEV3). However, histological examination of the Lgr5; ROSANICD intestine at 6 months post-TX revealed normal crypt/villus architecture, with no change to progenitor cell proliferation or expression of the Notch target genes Olfm4 and Hes1 (FigEV3).
Figure 8.
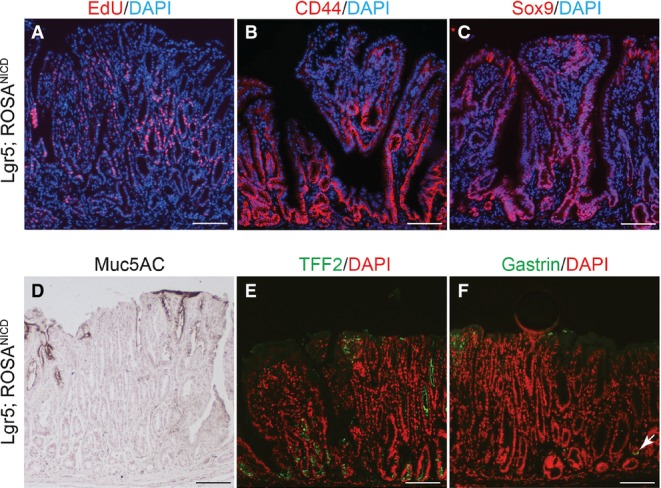
- A–C Paraffin sections from Lgr5; ROSANICD stomach 6–12 months post-TX were stained for (A) proliferation by EdU incorporation (red) or immunostained for (B) CD44 or (C) Sox9. DAPI (blue) was used as a nuclear counterstain. Scale bars: 100 μm.
- D–F Immunohistochemical analysis of (D) surface mucous cells (Muc5ac), (E) deep mucous cells (TFF2) and (F) endocrine cells (Gastrin) in Lgr5; ROSANICD mice 6–12 months post-TX. Compare Fig4 for normal tissue staining. Scale bars: 100 μm.
Figure EV3.
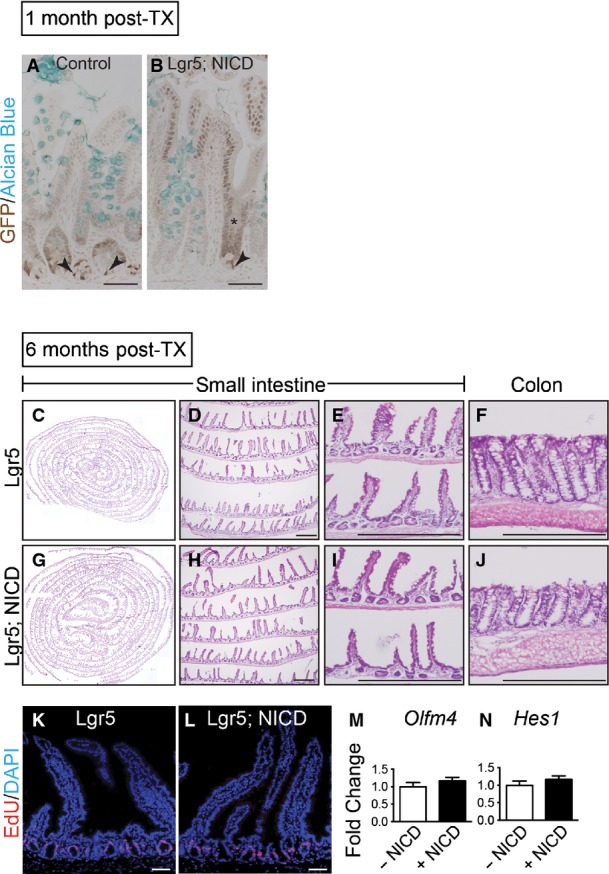
- A, B Goblet cells in NICD+ ileal crypts were analyzed by co-staining for GFP (cytoplasmic, Lgr5; nuclear, NICD) and Alcian Blue in control (n = 3) or Lgr5; ROSANICD (n = 3) mice 1 month post-TX. Nuclear GFP was observed in a patchy pattern consistent with the known mosaic expression pattern of Lgr5-EGFP-IRES-CreERT2. Recombined crypts with NICD-GFP expression (asterisk) in Lgr5; ROSANICD mice exhibited a reduction in goblet cells, in accordance with the known effect of Notch signaling to block secretory cell differentiation. Arrowheads indicate LGR5-GFP+ intestinal stem cells at the base of the crypts. Scale bars: 50 μm.
- C–J No polyps were observed in intestine 6 months after TX induction of NICD. H&E analysis of Lgr5 control (n = 7) (C–F) and Lgr5; ROSANICD (n = 7). (G–J) small intestine (C–E; G–I) and colon (F, J). Scale bars: 100 μm.
- K, L Proliferation was measured by EdU incorporation and found to be unchanged in Lgr5; ROSANICD mice. Scale bars: 50 μm.
- M, N qRT–PCR analysis of Olfm4 and Hes1 in Lgr5 and Lgr5; ROSANICD intestine revealed no change to stem cell marker or Notch target gene expression. Data are expressed as mean ± SEM (n = 7 mice per group).
The strong activation of CD44 and Sox9, known intestinal Wnt target genes, in the Lgr5; ROSANICD antral polyps was not due to a general increase in Wnt signaling, as suggested by decreased expression of the Wnt target genes Lgr5 and Axin2 (FigEV4). Decreased Wnt target gene expression after Notch activation is consistent with a previous report suggesting that Notch can repress Wnt signaling in the intestine (Tian et al, 2015). Decreased Lgr5 expression in the tumor tissue was also demonstrated by in situ hybridization and by a lack of ROSACon re-tracing in Lgr5; ROSANICD polyp areas (FigEV4), although inclusion of the ROSATom reporter revealed that the antral polyps were derived from NICD-activated LGR5+ antral stem cells (Appendix Fig S3). Lineage tracing with the ROSACon reporter revealed that the antral polyps are polyclonal (Appendix Fig S3), suggesting that they are derived from multiple NICD-activated LGR5+ stem cells. These data suggest that chronic activation of Notch signaling leads to hyper-proliferative polyp development as a consequence of perturbed stem cell homeostasis in the gastric antrum.
Figure EV4.
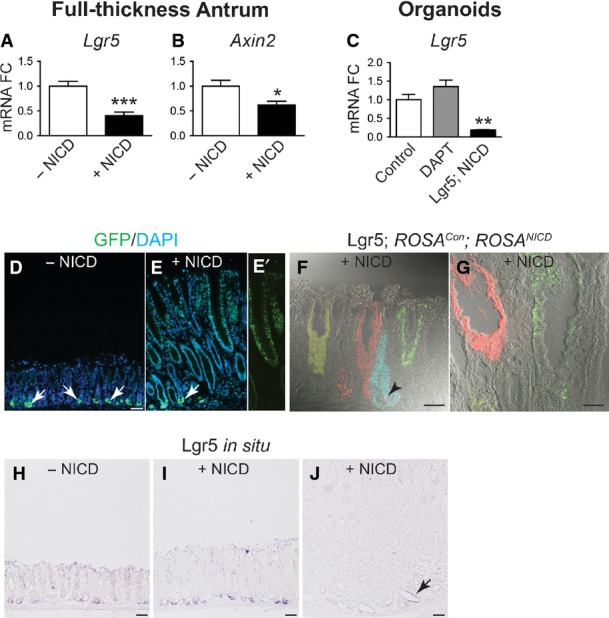
- A–C qRT–PCR analysis for Wnt target genes Lgr5 (A) and Axin2 (B) in control (n = 7) and Lgr5; ROSANICD (n = 7) mice 1 year post-TX, or Lgr5 (C) in control, DAPT-treated and Lgr5; ROSANICD antral organoids (n = 8 per group) (mean ± SE). *P < 0.05 and ***P < 0.001 vs. −NICD using Student's t-test. **P < 0.01 vs. Control using one-way ANOVA.
- D, E GFP immunostaining in control and Lgr5; ROSANICD mice 1 year post-TX. NICD activation showed lack of cytoplasmic Lgr5-GFP expression in hyperplastic polyps. Arrows indicate cytoplasmic Lgr5-GFP+ stem cells at the gland base. (E′) Prominent nuclear GFP resulting from NICD activation in Lgr5; ROSANICD antral polyp. Scale bars: 50 μm.
- F, G Lgr5 re-tracing with the ROSACon reporter in Lgr5; ROSANICD mice. Re-tracing was observed in non-polyp tissue (F; arrowhead), but not in a polyp region (G). Scale bars: 50 μm.
- H–J Lgr5 in situ hybridization in control and Lgr5; ROSANICD mice 1 year post-TX. Lgr5 expression (J; arrow) was markedly reduced in polyp areas. Scale bars: 50 μm.
Notch regulates mTOR signaling
Previous studies in hematopoietic cells have reported that Notch can activate the mTOR signaling pathway (Chan et al, 2007; Palomero et al, 2007). Therefore, we tested whether Notch induction of LGR5+ stem cell proliferation and antral gland fission might involve mTOR pathway activation. Immunostaining for the phosphorylated form of the mTORC1 target ribosomal protein S6 (pS6) in control, DBZ-treated and Lgr5; ROSANICD mice at 1 month and 1 year post-TX revealed that Notch inhibition reduced pS6 expression, while Notch activation increased expression (Fig9A–D). The significance of elevated mTOR signaling was functionally tested by treating Lgr5; ROSANICD mice with the mTORC1 inhibitor rapamycin. Analysis of epithelial cell proliferation and gland fission showed that rapamycin significantly attenuated the increased proliferation (Fig9E–G) and gland fission (Fig9H–J) induced by Notch activation to baseline levels observed in wild-type mice. Effective mTORC1 blockade by rapamycin was demonstrated by a complete loss of pS6 staining (Fig EV5). Notch signaling, however, was not affected by rapamycin treatment, as demonstrated by continued expression of the ROSANICD transgene, shown by nuclear GFP immunostaining, and expression of the Notch target Hes1 (FigEV5). Furthermore, rapamycin treatment of non-transgenic mice revealed a loss of pS6 expression but no change in basal epithelial cell proliferation (FigEV5). Overall, these data provide evidence that mTORC1 signaling plays a functional role in Notch regulation of stem/progenitor cell proliferation and gland fission.
Figure 9.
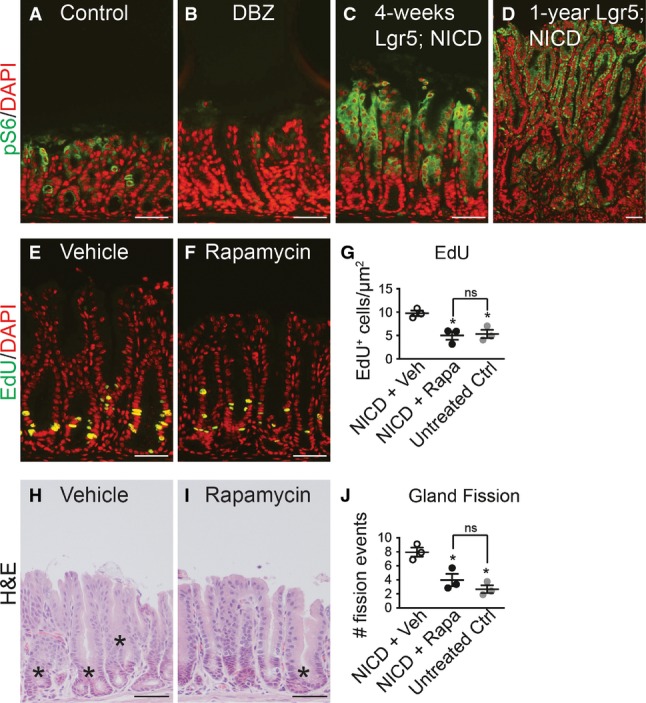
- A–D Paraffin sections from (A) control, (B) DBZ-treated and Lgr5; ROSANICD stomachs either (C) 1 month or (D) 1 year post-TX immunostained for phospho-S6 (pS6, green). DAPI (red) was used as a nuclear counterstain. Scale bars: 50 μm.
- E, F Proliferation was measured via EdU incorporation on paraffin sections from TX-treated Lgr5; ROSANICD stomachs after treatment with (E) vehicle or (F) 4 mg/kg rapamycin twice per week for 3 weeks. Scale bars: 50 μm.
- G Quantification of proliferation in vehicle- (n = 3) and rapamycin-treated (n = 3) Lgr5; ROSANICD mice, or untreated C57BL/6 mice (n = 3) by morphometrics of EdU incorporation (mean ± SEM). *P < 0.05 versus vehicle-treated NICD using one-way ANOVA.
- H, I H&E-stained paraffin sections from (H) vehicle- and (I) rapamycin-treated Lgr5; ROSANICD mice. Asterisks illustrate gland fission. Scale bars: 50 μm.
- J Morphometric analysis of antral gland fission in vehicle (n = 3) and rapamycin-treated (n = 3) Lgr5; ROSANICD mice, or untreated C57BL/6 mice (n = 3) (mean ± SEM). *P < 0.05 versus vehicle-treated NICD using one-way ANOVA.
Figure EV5.
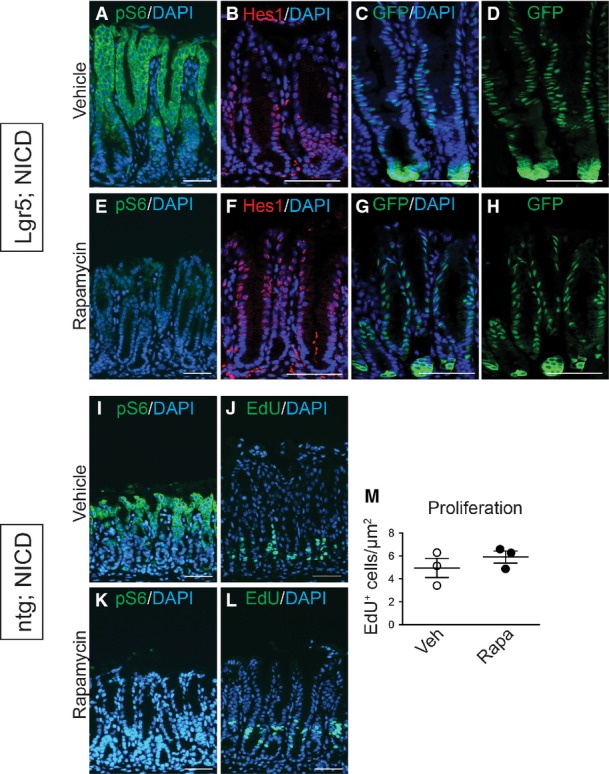
- A–L pS6 expression in vehicle (A, I) and rapamycin-treated (E, K) Lgr5; ROSANICD or control (ntg; ROSANICD) mice shows effective blockade of mTORC1. Immunostaining for Hes1 (B, F) and NICD-GFP (C, D, G, H) revealed no change to Notch signaling or expression of the ROSANICD transgene (nuclear GFP) during rapamycin treatment of Lgr5; ROSANICD mice. (J, L) Cellular proliferation was measured via EdU incorporation in vehicle or rapamycin-treated control (ntg; ROSANICD) mice, and (M) numbers of EdU+ cells were quantified via morphometric analysis. Data are expressed as mean ± SEM (n = 4 mice per group). Scale bars: 5 0 μm.
Discussion
Here we report that Notch signaling controls gastric epithelial cell homeostasis by regulating antral stem cell function. Our lineage tracing studies in adult NIP1::CreERT2 mice showed that antral stem cells are actively signaling from the Notch1 receptor, thus demonstrating that the Notch pathway directly targets these cells under normal homeostatic conditions. Manipulation of Notch signaling showed that Notch functions to promote overall stem cell proliferation. Blocking Notch by pharmacologic or genetic means reduced stem cell proliferation, while genetic activation of Notch signaling in LGR5+ stem cells increased the number of proliferating stem cells. Expression of the Notch target gene Olfm4 paralleled the changes in stem cell proliferation, suggesting that it may be an antral stem cell marker, similar to what has been reported for LGR5+ stem cells in intestine (van der Flier et al, 2009; VanDussen et al, 2012). Analysis of gastric organoids demonstrated that Notch signaling is intrinsic to the gastric epithelium, where it regulates organoid growth and efficiency of new organoid initiation. Finally, we show that single sorted LGR5-GFP+ stem cells from Notch-inhibited mice have a reduced capacity to initiate organoids, suggesting a profound role for Notch in supporting antral stem cell function.
We further demonstrate that Notch regulates gastric epithelial cell differentiation. Pathway inhibition promoted differentiation of all cell lineages, while activation reduced differentiation, most likely due to an increase in progenitor cell proliferation and a resulting block in these differentiation programs. Our studies extend earlier findings in which increased numbers of deep mucous cells were observed in the adult mouse antrum after DBZ treatment (Kim & Shivdasani, 2011) and increased numbers of endocrine cells in embryonic mice carrying a deletion of the Notch effector gene Hes1 (Jensen et al, 2000). Our conclusion that Notch signaling inhibits differentiation of all lineages in the stomach contrasts with Notch regulation of differentiation in the intestine, where global pathway inhibition has been well described to promote differentiation of secretory cell types (mucous, endocrine, Paneth) to the detriment of absorptive enterocytes (van Es et al, 2005; VanDussen et al, 2012). Notch regulation of intestinal cell fate occurs via control of the secretory lineage-specific transcription factor Atoh1 (Yang et al, 2001; Shroyer et al, 2007; VanDussen & Samuelson, 2010), which is not expressed in stomach. In stomach, Notch signaling appears to uniformly affect all cell lineages via regulation of stem and progenitor cell proliferation versus differentiation without affecting cell fate choice.
Gastric glands in mouse are initially polyclonal, reaching monoclonality at adulthood, around 6 weeks of age (Nomura et al, 1998). Each adult gland has been estimated to contain 8 LGR5+ stem cells that divide symmetrically to maintain epithelial cell homeostasis (Leushacke et al, 2013). Neutral competition for open niche spots is thought to maintain monoclonality in the adult stomach. This conclusion was based on studies with the multi-colored RosaCon reporter to characterize LGR5+ stem cell dynamics in adult mice, showing that monoclonality was achieved by 2 months after initiating lineage labeling (Leushacke et al, 2013). Our studies similarly showed that approximately 50% of control antral glands were single-colored (monoclonal) at 2 months after tamoxifen treatment. Importantly, our studies also showed Notch activation markedly increased the rate of monoclonal gland conversion, with single-colored glands observed in the Lgr5; ROSANICD stomach as early as 2 weeks after NICD activation. These findings suggest that stem cells with constitutive Notch pathway activation compete more effectively for niche spots than control stem cells, rapidly spreading within the stem cell niche.
Our results also suggest that Notch signaling regulates antral stem cell activity. Analysis of antral organoids established from DBZ-treated or Lgr5; ROSANICD mice revealed dramatic changes in efficiency of organoid establishment, suggesting functional changes to stem cells with reduced or enhanced ability to initiate organoid formation, respectively. Consistent with this interpretation is the observation of a robust increase in gland fission after NICD activation in LGR5+ stem cells. Fission occurs by a poorly understood tubular bifurcation process initiated from the gland base to increase the number of gastric glands. This process predominates during pre- and postnatal development to provide a mechanism to achieve adult organ size after the initial establishment of gastric glands (Nomura et al, 1998). Our studies in adult mice showed that antral gland fission was increased 1 week post-NICD induction in LGR5+ stem cells. Fission is thought to be initiated by increased stem cell numbers to spatially accommodate the resulting increase in cell production (Loeffler et al, 1997). Our observation of increased stem cell proliferation associated with increased fission and increased organoid establishment after Notch pathway activation suggests that Notch may regulate the number of active stem cells in the gastric gland or that Notch-activated stem cells are functionally advantageous and eventually out-compete “normal” stem cells, an interpretation that is consistent with our ROSACon lineage tracing analysis. The lack of intestinal polyps in Lgr5; ROSANICD mice suggests that NICD-activated intestinal stem cells respond differently than gastric stem cells, highlighting differences between the two tissues.
Our findings that mTORC1 inhibition attenuated the observed NICD-induced proliferation and antral gland fission suggest that enhanced Notch signaling may regulate antral stem cells via downstream signaling through mTOR. mTOR is a serine/threonine protein kinase that regulates cellular growth and proliferation. Notch has been previously shown to activate the PI3K/Akt/mTOR signaling cascade via Hes1 and Myc suppression of phosphatase and tensin homologue deleted on chromosome ten (PTEN) and activation of Akt/PI3K signaling (Palomero et al, 2007). Loss of PTEN (which results in mTOR activation) in the intestinal epithelium leads to intestinal stem cell expansion, increased crypt fission and intestinal polyposis (He et al, 2007). These findings are consistent with our observation of increased mTOR activity in Lgr5; ROSANICD mice, which exhibit increased LGR5+ antral stem cell activity and antral gland fission. mTOR regulation of gastric epithelial cell homeostasis has not been explored; however, activation of the PI3K/Akt/mTOR pathway in mouse models of gastric tumorigenesis (Thiem et al, 2013) and human gastric cancer (Bellacosa et al, 2005; Lang et al, 2007; Murayama et al, 2009; Yu et al, 2009) suggests that dysregulated mTOR signaling in gastric stem cells can initiate aberrant proliferation and tissue expansion, leading to tumorigenesis. However, the mechanism of Notch and mTOR cooperation in this process remains to be elucidated.
In addition to organ growth during maturation, gland fission is thought to be important for gastrointestinal tissue expansion in response to injury (Qiao et al, 2007; Miyoshi et al, 2012) and has been shown to be involved with field cancerization in the human stomach to expand mutated gastric glands (McDonald et al, 2008; Gutierrez-Gonzalez et al, 2011). Our studies show that over time Notch-activated stem cells promote gross tissue expansion with an overall increase in stomach weight. Tissue expansion was clearly demonstrated with the multi-colored RosaCon reporter by a progressive increase in clusters of same-colored glands after Notch activation in LGR5+ stem cells. Our findings parallel the results of genetic activation of oncogenic K-ras in intestinal LGR5+ stem cells, with observation of accelerated intestinal epithelial cell division and a biased drift toward monoclonality and crypt fission (Snippert et al, 2014). Thus, genetic mutations of active gastrointestinal stem cells that create a selective advantage to occupy the niche may establish a pre-cancerous field susceptible to subsequent cancer-causing mutations.
The appearance of hyper-proliferative antral polyps 6 months post-NICD activation supports this hypothesis of gland fission-driven tissue expansion. The NICD-induced polyps exhibited features of stem or progenitor cells and contained few differentiated cells. Notably, this response appeared to be specific for gastric stem cells as NICD did not induce polyps in other tissues containing LGR5+ stem cells, including intestine and skin. The lack of Lgr5-expressing cells in the antral polyps suggests that hyper-proliferation does not reflect a gross amplification of LGR5+ antral stem cells. An earlier study from the Shivdasani laboratory reported similar hyperproliferative, undifferentiated tumors in the gastric corpus after NICD activation in parietal cell progenitors, where they concluded that Notch promoted dedifferentiation of progenitors into stem cells that were capable of long-lived function as an active corpus stem cell (Kim & Shivdasani, 2011). Thus, the gastric epithelium appears to be highly responsive to Notch activation, suggesting that activation of this signaling pathway, either alone or in the context of active mTOR signaling, might play a role in gastric tumorigenesis.
Materials and Methods
Mice
Mice of both sexes, ages 2–3 months, were used, except where noted. Lgr5-EGFP-IRES-CreERT2 (Lgr5) (Barker et al, 2007) (Jackson Labs #008875), Bmi1-CreER (Bmi1) (Sangiorgi & Capecchi, 2008) (Jackson Labs #010531), ROSANotchIC (ROSANICD) (Murtaugh et al, 2003) (Jackson Labs #008159), ROSA-LSL-Confetti (ROSACon) (Snippert et al, 2010) (Jackson Labs #017492), ROSA-CAG-LSL-tdTomato-WPRE (ROSATom) (Madisen et al, 2010) (Jackson Labs #007909), NIP1::CreERT2 (Pellegrinet et al, 2011) and floxed-RBPjκ (RBPjfl/fl) (Tanigaki et al, 2002) mice have been previously described. All mice were on a C57BL/6 background, except for Bmi1; ROSATom; RBPjfl/fl mice, which were mixed C57BL/6 and FVB/N. Mice were housed under specific pathogen-free conditions in automated watered and ventilated cages on a 12-h light/dark cycle. In some experiments, mice were injected with 5-ethynyl-2′-deoxyuridine (EdU, 25 mg/kg, Invitrogen) 2 h prior to tissue collection. In all experiments, animals were fasted overnight with free access to water before tissue collection. All experimental procedures were approved by the University of Michigan Committee on the Use and Care of Animals.
Notch inhibition or activation
For Notch inhibition experiments, DBZ (30 μmol/kg i.p., SYNCOM, Groningen, the Netherlands) or vehicle (0.1% Tween-80, 0.5% hydroxypropylmethylcellulose [E4M], 0.1% DMSO in water) was administered to Lgr5 or wild-type C57BL/6 mice once per day for 5 days with tissue collected the next day. The expected intestinal secretory cell hyperplasia was observed in all DBZ-treated mice, confirming effective Notch blockade, as reported previously (VanDussen et al, 2012). Genetic Notch inhibition was examined in Bmi1; ROSATom; RBPjfl/+ and Bmi1; ROSATom; RBPjfl/fl mice injected with 100 mg/kg TX (dissolved in 10% ethanol and 90% corn oil) via i.p. injection once daily for 5 days, with tissue analyzed the next day.
For Notch activation experiments, Lgr5; ROSANICD mice were treated with TX and tissue analyzed at different time points post-cessation of vehicle or TX treatment. For analysis of antral gland clonality, Lgr5; ROSACon and Lgr5; ROSACon; ROSANICD animals were injected with TX and tissue collected 2, 5 or 8 weeks later. In some experiments, Lgr5; ROSACon; ROSANICD mice were re-injected with a single TX dose (200 mg/kg) at 6 months to assess Lgr5 activity via ROSACon re-tracing at 1 week post-TX re-treatment.
For analysis of organoid growth, the GSI DAPT (EMD4Biosciences, Gibbstown, NJ, USA) was added to culture media (10 nM–5 μM) and renewed every other day for up to 5 days. To test stem cell function in antral organoids, organoids were pre-treated with vehicle (DMSO) or 500 nM DAPT for 1–5 days and subsequently passaged. The number of new organoids formed was counted 48 h post-passaging.
mTOR inhibition
For mTORC1 inhibition experiments, ROSANICD or Lgr5; ROSANICD mice were treated with rapamycin (4 mg/kg i.p., LC Laboratories, Woburn, MA) or vehicle (5% Tween-80, 5% polyethylene glycol [PEG]400, 4% EtOH in 0.9% saline) twice per week for 3 weeks and stomachs collected the next day. Treatment was started 1 week post-TX.
Tissue collection and histological analysis
Stomach and intestinal tissues were removed and fixed in 4% paraformaldehyde in PBS (PFA) overnight at 4°C and paraffin-embedded as previously described (Lopez-Diaz et al, 2006). For frozen sections, stomachs were fixed in 4% PFA for 1 h and then transferred to 30% sucrose in PBS overnight at 4°C before freezing in OCT (Sakura Finetek USA, Torrance, CA). For ROSACon experiments, stomachs were fixed in 4% PFA for 15 min and washed twice in PBS before OCT embedding. Immunostaining paraffin or cryosections was as previously described (Keeley & Samuelson, 2010) using antibodies listed in Appendix Table S2 overnight at 4°C and protocols described in Appendix Supplementary Materials and Methods.
Confocal imaging of ROSAConfetti mice
Frozen stomach sections (10 μm) from Lgr5; ROSACon or Lgr5; ROSACon; ROSANICD mice were air-dried for 15 min, fixed in 4% PFA for 5 min, washed 3× in PBS and mounted with ProLong Gold. Native fluorescence of membrane-bound CFP (mCFP), nuclear GFP (nGFP) and cytosolic YFP and RFP was imaged using a Leica Inverted SP5X confocal microscope (Leica Microsystems, Buffalo Grove, IL) with the following excitation (EX) and emission (EM) wavelengths modified from Snippert et al (2010): mCFP: EX = 458 nm, EM = 466–495 nm; nGFP: EX = 488 nm, EM = 500–515 nm; YFP: EX = 514 nm, EM = 525–545 nm; and RFP: EX = 561 nm, EM = 620–680 nm (1 μm optical slice, 40× oil objective lens, NA = 1.2). DIC imaging was included for tissue architecture.
Morphometrics
Morphometric analysis was performed with ImageJ software (1.43u, Wayne Rasband, NIH, USA). For analysis of LGR5+ stem cell proliferation, the number of GFP/Ki67 double-positive cells per gastric antral gland was counted in vehicle (n = 952 glands), DBZ (n = 894 glands), control Lgr5 (n = 1,187 glands) and Lgr5; ROSANICD (n = 826 glands) mice (n = 4–5 mice per group). For analysis of Ki67+ or EdU+ epithelial cell proliferation and G-cell number, images of at least three separate fields per animal were taken and analyzed (n = 3–6 animals per group). Cell counts were normalized to total epithelial area (μm2). For antral gland height measurements, glands from the proximal antrum (∼800 μm from disappearance of parietal cells) were measured. For analysis of gland clonality in Lgr5; ROSACon and Lgr5; ROSACon; ROSANICD mice, the number of Confetti-labeled cross-sectional glands was counted and scored as multi-colored (glands expressing > 1 Confetti color), single-colored (glands expressing 1 Confetti color) or clustered (adjacent glands expressing the same Confetti color) (n = 3 per group). Scoring was performed on at least three fields per animal.
Gene expression analysis
RNA was isolated from gastric antral tissue by homogenization in lysis buffer (RLT, Qiagen) with β-mercaptoethanol (β-ME, 10 μl/ml), followed by DNase I treatment and purification using the RNeasy Mini kit (Qiagen). cDNA was prepared from 1 μg total RNA using the iScript cDNA Synthesis kit (Bio-Rad). Quantitative PCR was performed as previously described (Keeley & Samuelson, 2010), using primer sets listed in Appendix Table S3.
For RNA isolation from antral organoids, organoids were washed in PBS, re-suspended in RLT with β-ME and passed through a needle and syringe five times to homogenize. DNase I treatment, cDNA preparation and qRT–PCR were performed as described above.
In situ hybridization was performed as previously described (Carulli et al, 2015) using an Lgr5 probe (Barker et al, 2007) (gift from Dr. Hans Clevers), with modifications as listed in the Appendix Supplementary Materials and Methods.
Gland isolation and immunostaining
Antral tissue was cut into ∼2-mm3 pieces and incubated in 15 mM EDTA/Dulbecco's PBS (DPBS) for 2 h at 4°C on a rocking platform. Tissue was vortexed for 2.5 min to release glands, tissue pieces were removed, and glands were pelleted at 150× g for 10 min. Glands were re-suspended in 500 μl 4% PFA and incubated for 10 min on ice, pelleted at 350× g for 5 min, and re-suspended in 200 μl blocking solution (20% serum, 1% BSA, 0.3% TPBS) for 1 h at room temperature. Primary and secondary antibodies were applied in suspension culture. Stained glands were re-suspended in 100–200 μl DPBS and mounted on slides with ProLong Gold + DAPI.
Gastric organoid culture and histological analysis
Gastric organoid experiments were carried out as previously described (Barker et al, 2010; Miyoshi et al, 2012), with modifications. Antral tissue was incubated in 15 mM EDTA/DPBS with pen-strep for 1 h at 4°C on a rocking platform. Tissue was vortexed for 2.5 min to release glands, which were gravity-settled 2 × 5 min, pelleted at 150× g for 10 min and resuspended in culture media: advanced DMEM/F12 with HEPES, 10% Wnt3A (Barker et al, 2010) and 5% R-spondin2 (Bell et al, 2008)-conditioned media, B27, N2, pen-strep, Noggin (100 ng/ml), EGF (50 ng/ml) and Y-27632 (10 μM). In some experiments, 50% L-WRN-conditioned media (Miyoshi & Stappenbeck, 2013) replaced Wnt3A, R-spondin2-conditioned media, Noggin and EGF. Resuspended glands were mixed with 120 μl Matrigel (BD Biosciences), and 50 μl aliquots were plated in pre-warmed 24-well plates. After 30 min at 37°C, 500 μl culture media was overlaid, and media (without Y-27632) was renewed every 3–4 days.
To test organoid formation efficiency after in vivo Notch inhibition, C57BL/6 mice were treated with vehicle or DBZ as above, and tissue harvested on day 6 for antral organoid cultures. Organoid efficiency after Notch activation was tested by injecting Lgr5 or Lgr5; ROSANICD mice with 100 mg/kg TX once daily for 5 days, and tissue was harvested for organoid cultures 1 week post-cessation of TX treatment. The efficiency of organoid formation was measured by counting the number of organoids formed 48 h post-plating, and normalizing to the number of initially plated antral glands.
For gene expression analysis after in vitro Notch inhibition, established organoids were passaged (day 0), treated with 1 μM DAPT on days 1, 3 and 5 and harvested on day 6 for RNA extraction. For gene expression analysis of Notch-activated organoids, Lgr5 or Lgr5; ROSANICD organoids were passaged as above, media replaced every other day and harvested on day 6.
For histological analysis, organoids were collected, fixed in 4% PFA for 20 min, washed in 1× PBS and re-suspended in OCT. To measure proliferation, EdU (10 μM) was added to the media for 1.5 h before collection. Staining frozen sections for EdU or E-cadherin was performed as described above.
FACS and LGR5+ stem cell plating
FACS isolation of single LGR5+ antral stem cells from vehicle and DBZ-treated mice was performed as previously described (Barker et al, 2010; Magness et al, 2013; Carulli et al, 2015) with modifications. Antral tissue was incubated in 30 mM EDTA, 1.5 mM dithiothreitol (DTT) in DPBS for 1 h on ice, followed by incubation in 30 mM EDTA in DPBS for 20 min at 37°C. Tissue was shaken vigorously by hand for 30 s, tissue fragments were removed, and glands were pelleted at 1,280× g for 5 min. Glands were washed in DPBS with 10% FBS and 0.1 mg/ml DNase I (Roche) and filtered through a 70-μm cell strainer (BD Bioscience). The filtrate was pelleted, supernatant was removed, and glands were re-suspended in HBSS containing dispase I (2 U/ml, Roche) for 10 min in a shaking 37°C H2O bath. Cells were washed in 10% FBS in DPBS with 0.1 mg/ml DNase I, pelleted, re-suspended in 5 ml HBSS and filtered through a 40-μm cell strainer. Single cells were then pelleted at 400× g for 5 min and re-suspended in 100 μl cell sorting media (Magness et al, 2013). DAPI (3.6 mM) was added for exclusion of dead cells. GFP+ cells were sequentially gated for size, singlets and DAPI− (Appendix Fig S4) using a FACSAria IIu SORP cell sorter (BD Bioscience). LGR5-GFP+ antral stem cells were sorted into 20 μl organoid culture media (50% L-WRN, 20% FBS, 2 mM l-glutamine, 1× pen/strep, 1× fungizone, 1× gentamicin, 10 μM Y-27632 in advanced DMEM/F12), further diluted in Matrigel, and 50 μl aliquots were plated in a 24-well plate (500 stem cells/well). A total of 10 μM Y-27632 was added to culture media for the first 3 days post-plating. Organoid establishment efficiency was quantified by counting the number of organoids formed at 72 h post-plating and normalized to the number of stem cells initially plated.
Statistical analysis
GraphPad Prism software was used for statistical analysis of data sets. Quantitative data are presented as mean ± SE and analyzed using Student's t-test, one-way ANOVA or two-way ANOVA with Dunnett's post hoc test, as indicated. For qRT–PCR data, the control group is pooled from vehicle-treated animals in DBZ and Lgr5; ROSANICD experiments and data are expressed as mRNA fold change (FC) versus control. P < 0.05 was considered significant.
Acknowledgments
We thank Dr. Tasuku Honjo for the floxed-RBPJκ mice, Dr. Hans Clevers for Wnt3A L-cells and the Lgr5 in situ probe, Dr. Jeffrey Whitsett for R-spondin2 expressing cells, Dr. Thaddeus Stappenbeck for L-WRN cells, Dr. Yu-Hwai Tsai for assistance with tissue processing, Jessica Crowley and Tyler Emmendorfer for maintenance of mouse colonies, Dr. Scott Magness for advice regarding flow-sorting experiments and the University of Michigan Flow Cytometry Core for technical assistance with cell sorting. E.S.D. was supported by NIH F32-DK093349, G.B.G. was supported by T32-GM008322 and T32-DK094775, and A.J.C. was supported by T32-GM07863, T32-HD007515 and NIH F30-DK095517. The research was funded by NIH P01-DK062041 and NCI P50-CA130810 project awards to L.C.S. and Core support from the Michigan Gastrointestinal Peptide Center NIH P30-DK34933 and the University of Michigan Cancer Center Support Grant NCI P30-CA6592.
Author contributions
ESD designed and performed experiments, analyzed data and wrote the manuscript. GBG, TMK and AJC performed experiments and analyzed data. KVD, DT and ZL performed experiments. TJG and RK provided reagents and critically reviewed the manuscript. LCS obtained funding, designed experiments and wrote the manuscript.
Conflict of interest
The authors declare that they have no conflict of interest.
Supporting Information
Appendix
Expanded View Figures PDF
Review Process File
References
- Barker N, van Es JH, Kuipers J, Kujala P, van den Born M, Cozijnsen M, Haegebarth A, Korving J, Begthel H, Peters PJ, Clevers H. Identification of stem cells in small intestine and colon by marker gene Lgr5. Nature. 2007;449:1003–1007. doi: 10.1038/nature06196. [DOI] [PubMed] [Google Scholar]
- Barker N, Huch M, Kujala P, van de Wetering M, Snippert HJ, van Es JH, Sato T, Stange DE, Begthel H, van den Born M, Danenberg E, van den Brink S, Korving J, Abo A, Peters PJ, Wright N, Poulsom R, Clevers H. Lgr5(+ve) stem cells drive self-renewal in the stomach and build long-lived gastric units in vitro. Cell Stem Cell. 2010;6:25–36. doi: 10.1016/j.stem.2009.11.013. [DOI] [PubMed] [Google Scholar]
- Bell SM, Schreiner CM, Wert SE, Mucenski ML, Scott WJ, Whitsett JA. R-spondin 2 is required for normal laryngeal-tracheal, lung and limb morphogenesis. Development. 2008;135:1049–1058. doi: 10.1242/dev.013359. [DOI] [PubMed] [Google Scholar]
- Bellacosa A, Kumar CC, Di Cristofano A, Testa JR. Activation of AKT kinases in cancer: implications for therapeutic targeting. Adv Cancer Res. 2005;94:29–86. doi: 10.1016/S0065-230X(05)94002-5. [DOI] [PubMed] [Google Scholar]
- Carulli AJ, Keeley TM, Demitrack ES, Chung J, Maillard I, Samuelson LC. Notch receptor regulation of intestinal stem cell homeostasis and crypt regeneration. Dev Biol. 2015;402:98–108. doi: 10.1016/j.ydbio.2015.03.012. [DOI] [PMC free article] [PubMed] [Google Scholar]
- Chan SM, Weng AP, Tibshirani R, Aster JC, Utz PJ. Notch signals positively regulate activity of the mTOR pathway in T-cell acute lymphoblastic leukemia. Blood. 2007;110:278–286. doi: 10.1182/blood-2006-08-039883. [DOI] [PMC free article] [PubMed] [Google Scholar]
- Dehmer JJ, Garrison AP, Speck KE, Dekaney CM, Van Landeghem L, Sun X, Henning SJ, Helmrath MA. Expansion of intestinal epithelial stem cells during murine development. PLoS ONE. 2011;6:e27070. doi: 10.1371/journal.pone.0027070. [DOI] [PMC free article] [PubMed] [Google Scholar]
- van Es JH, van Gijn ME, Riccio O, van den Born M, Vooijs M, Begthel H, Cozijnsen M, Robine S, Winton DJ, Radtke F, Clevers H. Notch/gamma-secretase inhibition turns proliferative cells in intestinal crypts and adenomas into goblet cells. Nature. 2005;435:959–963. doi: 10.1038/nature03659. [DOI] [PubMed] [Google Scholar]
- van der Flier LG, van Gijn ME, Hatzis P, Kujala P, Haegebarth A, Stange DE, Begthel H, van den Born M, Guryev V, Oving I, van Es JH, Barker N, Peters PJ, van de Wetering M, Clevers H. Transcription factor achaete scute-like 2 controls intestinal stem cell fate. Cell. 2009;136:903–912. doi: 10.1016/j.cell.2009.01.031. [DOI] [PubMed] [Google Scholar]
- Fre S, Huyghe M, Mourikis P, Robine S, Louvard D, Artavanis-Tsakonas S. Notch signals control the fate of immature progenitor cells in the intestine. Nature. 2005;435:964–968. doi: 10.1038/nature03589. [DOI] [PubMed] [Google Scholar]
- Gutierrez-Gonzalez L, Graham TA, Rodriguez-Justo M, Leedham SJ, Novelli MR, Gay LJ, Ventayol-Garcia T, Green A, Mitchell I, Stoker DL, Preston SL, Bamba S, Yamada E, Kishi Y, Harrison R, Jankowski JA, Wright NA, McDonald SA. The clonal origins of dysplasia from intestinal metaplasia in the human stomach. Gastroenterology. 2011;140:1251–1260. doi: 10.1053/j.gastro.2010.12.051. e1251-1256. [DOI] [PubMed] [Google Scholar]
- He XC, Yin T, Grindley JC, Tian Q, Sato T, Tao WA, Dirisina R, Porter-Westpfahl KS, Hembree M, Johnson T, Wiedermann LM, Barrett TA, Hood L, Wu H, Li L. PTEN-deficient intestinal stem cells initiate intestinal polyposis. Nat Genet. 2007;39:189–198. doi: 10.1038/ng1928. [DOI] [PMC free article] [PubMed] [Google Scholar]
- Horst D, Gu X, Bhasin M, Yang Q, Verzi M, Lin D, Joseph M, Zhang X, Chen W, Li YP, Shivdasani RA, Libermann TA. Requirement of the epithelium-specific Ets transcription factor Spdef for mucous gland cell function in the gastric antrum. J Biol Chem. 2010;285:35047–35055. doi: 10.1074/jbc.M110.164541. [DOI] [PMC free article] [PubMed] [Google Scholar]
- Hsu KW, Hsieh RH, Huang KH, Fen-Yau LA, Chi CW, Wang TY, Tseng MJ, Wu KJ, Yeh TS. Activation of the Notch1/STAT3/Twist signaling axis promotes gastric cancer progression. Carcinogenesis. 2012;33:1459–1467. doi: 10.1093/carcin/bgs165. [DOI] [PubMed] [Google Scholar]
- Jaks V, Barker N, Kasper M, van Es JH, Snippert HJ, Clevers H, Toftgard R. Lgr5 marks cycling, yet long-lived, hair follicle stem cells. Nat Genet. 2008;40:1291–1299. doi: 10.1038/ng.239. [DOI] [PubMed] [Google Scholar]
- Jensen J, Pedersen EE, Galante P, Hald J, Heller RS, Ishibashi M, Kageyama R, Guillemot F, Serup P, Madsen OD. Control of endodermal endocrine development by Hes-1. Nat Genet. 2000;24:36–44. doi: 10.1038/71657. [DOI] [PubMed] [Google Scholar]
- Karam SM, Leblond CP. Dynamics of epithelial cells in the corpus of the mouse stomach. II. Outward migration of pit cells. Anat Rec. 1993a;236:280–296. doi: 10.1002/ar.1092360203. [DOI] [PubMed] [Google Scholar]
- Karam SM, Leblond CP. Dynamics of epithelial cells in the corpus of the mouse stomach. III. Inward migration of neck cells followed by progressive transformation into zymogenic cells. Anat Rec. 1993b;236:297–313. doi: 10.1002/ar.1092360204. [DOI] [PubMed] [Google Scholar]
- Keeley TM, Samuelson LC. Cytodifferentiation of the postnatal mouse stomach in normal and Huntingtin-interacting protein 1-related-deficient mice. Am J Physiol Gastrointest Liver Physiol. 2010;299:G1241–G1251. doi: 10.1152/ajpgi.00239.2010. [DOI] [PMC free article] [PubMed] [Google Scholar]
- Kim TH, Shivdasani RA. Notch signaling in stomach epithelial stem cell homeostasis. J Exp Med. 2011;208:677–688. doi: 10.1084/jem.20101737. [DOI] [PMC free article] [PubMed] [Google Scholar]
- Kokubu H, Ohtsuka T, Kageyama R. Mash1 is required for neuroendocrine cell development in the glandular stomach. Genes Cells. 2008;13:41–51. doi: 10.1111/j.1365-2443.2007.01146.x. [DOI] [PubMed] [Google Scholar]
- Lang SA, Gaumann A, Koehl GE, Seidel U, Bataille F, Klein D, Ellis LM, Bolder U, Hofstaedter F, Schlitt HJ, Geissler EK, Stoeltzing O. Mammalian target of rapamycin is activated in human gastric cancer and serves as a target for therapy in an experimental model. Int J Cancer. 2007;120:1803–1810. doi: 10.1002/ijc.22442. [DOI] [PubMed] [Google Scholar]
- Lee CS, Perreault N, Brestelli JE, Kaestner KH. Neurogenin 3 is essential for the proper specification of gastric enteroendocrine cells and the maintenance of gastric epithelial cell identity. Genes Dev. 2002;16:1488–1497. doi: 10.1101/gad.985002. [DOI] [PMC free article] [PubMed] [Google Scholar]
- Leushacke M, Ng A, Galle J, Loeffler M, Barker N. Lgr5(+) gastric stem cells divide symmetrically to effect epithelial homeostasis in the pylorus. Cell Rep. 2013;5:349–356. doi: 10.1016/j.celrep.2013.09.025. [DOI] [PubMed] [Google Scholar]
- Loeffler M, Bratke T, Paulus U, Li YQ, Potten CS. Clonality and life cycles of intestinal crypts explained by a state dependent stochastic model of epithelial stem cell organization. J Theor Biol. 1997;186:41–54. doi: 10.1006/jtbi.1996.0340. [DOI] [PubMed] [Google Scholar]
- Lopez-Diaz L, Hinkle KL, Jain RN, Zavros Y, Brunkan CS, Keeley T, Eaton KA, Merchant JL, Chew CS, Samuelson LC. Parietal cell hyperstimulation and autoimmune gastritis in cholera toxin transgenic mice. Am J Physiol Gastrointest Liver Physiol. 2006;290:G970–G979. doi: 10.1152/ajpgi.00461.2005. [DOI] [PubMed] [Google Scholar]
- Madisen L, Zwingman TA, Sunkin SM, Oh SW, Zariwala HA, Gu H, Ng LL, Palmiter RD, Hawrylycz MJ, Jones AR, Lein ES, Zeng H. A robust and high-throughput Cre reporting and characterization system for the whole mouse brain. Nat Neurosci. 2010;13:133–140. doi: 10.1038/nn.2467. [DOI] [PMC free article] [PubMed] [Google Scholar]
- Magness ST, Puthoff BJ, Crissey MA, Dunn J, Henning SJ, Houchen C, Kaddis JS, Kuo CJ, Li L, Lynch J, Martin MG, May R, Niland JC, Olack B, Qian D, Stelzner M, Swain JR, Wang F, Wang J, Wang X, et al. A multicenter study to standardize reporting and analyses of fluorescence-activated cell-sorted murine intestinal epithelial cells. Am J Physiol Gastrointest Liver Physiol. 2013;305:G542–G551. doi: 10.1152/ajpgi.00481.2012. [DOI] [PMC free article] [PubMed] [Google Scholar]
- McDonald SA, Greaves LC, Gutierrez-Gonzalez L, Rodriguez-Justo M, Deheragoda M, Leedham SJ, Taylor RW, Lee CY, Preston SL, Lovell M, Hunt T, Elia G, Oukrif D, Harrison R, Novelli MR, Mitchell I, Stoker DL, Turnbull DM, Jankowski JA, Wright NA. Mechanisms of field cancerization in the human stomach: the expansion and spread of mutated gastric stem cells. Gastroenterology. 2008;134:500–510. doi: 10.1053/j.gastro.2007.11.035. [DOI] [PubMed] [Google Scholar]
- Miyoshi H, Ajima R, Luo CT, Yamaguchi TP, Stappenbeck TS. Wnt5a potentiates TGF-beta signaling to promote colonic crypt regeneration after tissue injury. Science. 2012;338:108–113. doi: 10.1126/science.1223821. [DOI] [PMC free article] [PubMed] [Google Scholar]
- Miyoshi H, Stappenbeck TS. In vitro expansion and genetic modification of gastrointestinal stem cells in spheroid culture. Nat Protoc. 2013;8:2471–2482. doi: 10.1038/nprot.2013.153. [DOI] [PMC free article] [PubMed] [Google Scholar]
- Murayama T, Inokuchi M, Takagi Y, Yamada H, Kojima K, Kumagai J, Kawano T, Sugihara K. Relation between outcomes and localisation of p-mTOR expression in gastric cancer. Br J Cancer. 2009;100:782–788. doi: 10.1038/sj.bjc.6604915. [DOI] [PMC free article] [PubMed] [Google Scholar]
- Murtaugh LC, Stanger BZ, Kwan KM, Melton DA. Notch signaling controls multiple steps of pancreatic differentiation. Proc Natl Acad Sci USA. 2003;100:14920–14925. doi: 10.1073/pnas.2436557100. [DOI] [PMC free article] [PubMed] [Google Scholar]
- Nomura S, Esumi H, Job C, Tan SS. Lineage and clonal development of gastric glands. Dev Biol. 1998;204:124–135. doi: 10.1006/dbio.1998.9055. [DOI] [PubMed] [Google Scholar]
- Palomero T, Sulis ML, Cortina M, Real PJ, Barnes K, Ciofani M, Caparros E, Buteau J, Brown K, Perkins SL, Bhagat G, Agarwal AM, Basso G, Castillo M, Nagase S, Cordon-Cardo C, Parsons R, Zuniga-Pflucker JC, Dominguez M, Ferrando AA. Mutational loss of PTEN induces resistance to NOTCH1 inhibition in T-cell leukemia. Nat Med. 2007;13:1203–1210. doi: 10.1038/nm1636. [DOI] [PMC free article] [PubMed] [Google Scholar]
- Pellegrinet L, Rodilla V, Liu Z, Chen S, Koch U, Espinosa L, Kaestner KH, Kopan R, Lewis J, Radtke F. Dll1- and dll4-mediated notch signaling are required for homeostasis of intestinal stem cells. Gastroenterology. 2011;140:1230–1240. doi: 10.1053/j.gastro.2011.01.005. e1231-1237. [DOI] [PMC free article] [PubMed] [Google Scholar]
- Qiao XT, Ziel JW, McKimpson W, Madison BB, Todisco A, Merchant JL, Samuelson LC, Gumucio DL. Prospective identification of a multilineage progenitor in murine stomach epithelium. Gastroenterology. 2007;133:1989–1998. doi: 10.1053/j.gastro.2007.09.031. [DOI] [PMC free article] [PubMed] [Google Scholar]
- Sangiorgi E, Capecchi MR. Bmi1 is expressed in vivo in intestinal stem cells. Nat Genet. 2008;40:915–920. doi: 10.1038/ng.165. [DOI] [PMC free article] [PubMed] [Google Scholar]
- Shroyer NF, Helmrath MA, Wang VY, Antalffy B, Henning SJ, Zoghbi HY. Intestine-specific ablation of mouse atonal homolog 1 (Math1) reveals a role in cellular homeostasis. Gastroenterology. 2007;132:2478–2488. doi: 10.1053/j.gastro.2007.03.047. [DOI] [PubMed] [Google Scholar]
- Snippert HJ, van der Flier LG, Sato T, van Es JH, van den Born M, Kroon-Veenboer C, Barker N, Klein AM, van Rheenen J, Simons BD, Clevers H. Intestinal crypt homeostasis results from neutral competition between symmetrically dividing Lgr5 stem cells. Cell. 2010;143:134–144. doi: 10.1016/j.cell.2010.09.016. [DOI] [PubMed] [Google Scholar]
- Snippert HJ, Schepers AG, van Es JH, Simons BD, Clevers H. Biased competition between Lgr5 intestinal stem cells driven by oncogenic mutation induces clonal expansion. EMBO Rep. 2014;15:62–69. doi: 10.1002/embr.201337799. [DOI] [PMC free article] [PubMed] [Google Scholar]
- Stanger BZ, Datar R, Murtaugh LC, Melton DA. Direct regulation of intestinal fate by Notch. Proc Natl Acad Sci USA. 2005;102:12443–12448. doi: 10.1073/pnas.0505690102. [DOI] [PMC free article] [PubMed] [Google Scholar]
- Sun Y, Gao X, Liu J, Kong QY, Wang XW, Chen XY, Wang Q, Cheng YF, Qu XX, Li H. Differential Notch1 and Notch2 expression and frequent activation of Notch signaling in gastric cancers. Arch Pathol Lab Med. 2011;135:451–458. doi: 10.5858/2009-0665-OA.1. [DOI] [PubMed] [Google Scholar]
- Tanigaki K, Han H, Yamamoto N, Tashiro K, Ikegawa M, Kuroda K, Suzuki A, Nakano T, Honjo T. Notch-RBP-J signaling is involved in cell fate determination of marginal zone B cells. Nat Immunol. 2002;3:443–450. doi: 10.1038/ni793. [DOI] [PubMed] [Google Scholar]
- Thiem S, Pierce TP, Palmieri M, Putoczki TL, Buchert M, Preaudet A, Farid RO, Love C, Catimel B, Lei Z, Rozen S, Gopalakrishnan V, Schaper F, Hallek M, Boussioutas A, Tan P, Jarnicki A, Ernst M. mTORC1 inhibition restricts inflammation-associated gastrointestinal tumorigenesis in mice. J Clin Invest. 2013;123:767–781. doi: 10.1172/JCI65086. [DOI] [PMC free article] [PubMed] [Google Scholar]
- Tian H, Biehs B, Chiu C, Siebel CW, Wu Y, Costa M, de Sauvage FJ, Klein OD. Opposing activities of Notch and Wnt signaling regulate intestinal stem cells and gut homeostasis. Cell Rep. 2015;11:33–42. doi: 10.1016/j.celrep.2015.03.007. [DOI] [PMC free article] [PubMed] [Google Scholar]
- Totafurno J, Bjerknes M, Cheng H. The crypt cycle. Crypt and villus production in the adult intestinal epithelium. Biophys J. 1987;52:279–294. doi: 10.1016/S0006-3495(87)83215-0. [DOI] [PMC free article] [PubMed] [Google Scholar]
- VanDussen KL, Samuelson LC. Mouse atonal homolog 1 directs intestinal progenitors to secretory cell rather than absorptive cell fate. Dev Biol. 2010;346:215–223. doi: 10.1016/j.ydbio.2010.07.026. [DOI] [PMC free article] [PubMed] [Google Scholar]
- VanDussen KL, Carulli AJ, Keeley TM, Patel SR, Puthoff BJ, Magness ST, Tran IT, Maillard I, Siebel C, Kolterud A, Grosse AS, Gumucio DL, Ernst SA, Tsai YH, Dempsey PJ, Samuelson LC. Notch signaling modulates proliferation and differentiation of intestinal crypt base columnar stem cells. Development. 2012;139:488–497. doi: 10.1242/dev.070763. [DOI] [PMC free article] [PubMed] [Google Scholar]
- Verzi MP, Khan AH, Ito S, Shivdasani RA. Transcription factor foxq1 controls mucin gene expression and granule content in mouse stomach surface mucous cells. Gastroenterology. 2008;135:591–600. doi: 10.1053/j.gastro.2008.04.019. [DOI] [PMC free article] [PubMed] [Google Scholar]
- Yang Q, Bermingham NA, Finegold MJ, Zoghbi HY. Requirement of Math1 for secretory cell lineage commitment in the mouse intestine. Science. 2001;294:2155–2158. doi: 10.1126/science.1065718. [DOI] [PubMed] [Google Scholar]
- Yeh TS, Wu CW, Hsu KW, Liao WJ, Yang MC, Li AF, Wang AM, Kuo ML, Chi CW. The activated Notch1 signal pathway is associated with gastric cancer progression through cyclooxygenase-2. Cancer Res. 2009;69:5039–5048. doi: 10.1158/0008-5472.CAN-08-4021. [DOI] [PubMed] [Google Scholar]
- Yu G, Wang J, Chen Y, Wang X, Pan J, Li G, Jia Z, Li Q, Yao JC, Xie K. Overexpression of phosphorylated mammalian target of rapamycin predicts lymph node metastasis and prognosis of chinese patients with gastric cancer. Clin Cancer Res. 2009;15:1821–1829. doi: 10.1158/1078-0432.CCR-08-2138. [DOI] [PubMed] [Google Scholar]
Associated Data
This section collects any data citations, data availability statements, or supplementary materials included in this article.
Supplementary Materials
Appendix
Expanded View Figures PDF
Review Process File