

Abstract
PURPOSE
Somatic mutations occur at early stages of adenoma and accumulate throughout colorectal cancer (CRC) progression. The aim of this study was to characterize the mutational landscape of stage II tumors and to search for novel recurrent mutations likely implicated in CRC tumorigenesis.
DESIGN
The exomic DNA of 42 stage II, microsatellite stable, colon tumors and their paired mucosae were sequenced. Other molecular data available in the discovery dataset (gene expression, methylation, and CNV) was used to further characterize these tumors. Additional datasets comprising 553 CRC samples were used to validate the discovered mutations.
RESULTS
As a result, 4,886 somatic single nucleotide variants (SNVs) were found. Almost all SNVs were private changes, with few mutations shared by more than one tumor, thus revealing tumor-specific mutational landscapes. Nevertheless, these diverse mutations converged into common cellular pathways such as cell cycle or apoptosis. Among this mutational heterogeneity, variants resulting in early stop-codons in the AMER1 (also known as FAM123B or WTX) gene emerged as recurrent mutations in CRC. Loses of AMER1 by other mechanisms apart from mutations such as methylation and copy number aberrations were also found. Tumors lacking this tumor suppressor gene exhibited a mesenchymal phenotype characterized by inhibition of the canonical Wnt pathway.
CONCLUSION
In silico and experimental validation in independent datasets confirmed the existence of functional mutations in AMER1 in approximately 10% of analyzed CRC tumors. Moreover, these tumors exhibited a characteristic phenotype.
Keywords: Massively parallel sequencing, Colorectal cancer, Molecular heterogeneity, Wnt pathway, Molecular classification, AMER1, FAM123B, WTX
INTRODUCTION
Colorectal cancer (CRC) is the third most common cancer and the second leading cause of cancer death in the world (1). The classic adenoma-to-carcinoma model postulates that CRC tumorigenesis proceeds through a progressive accumulation of genetic alterations in oncogenes and tumor suppressors genes (2). However, CRC is currently considered a heterogeneous disease. While tumors fitting into the classic progression model (or chromosomal instability model-CIN-) are the most frequent, other tumor phenotypes have been described, such as microsatellite instability (MSI) and CpG island methylator (CIMP) phenotypes (3). Recent studies based on high-throughput technologies have addressed the issue of CRC molecular complexity, revealing high level of heterogeneity among tumors (4).
Among other biological mechanisms, it is widely accepted that somatic mutations lead tumor development in CRC. It is postulated that most mutations within a tumor are undamaging byproducts of tumorigenesis (passenger mutations) while only a few are responsible for driving the initiation and progression of the tumor (driver mutations) (5). In CRC, a number of mutations have been proposed as drivers, such as those in the KRAS and BRAF oncogenes, or in the tumor suppressor genes APC and TP53 (6). However, the seminal study by Wood et al. revealed that the mutational landscapes of CRC genomes are composed of a few frequently mutated genes across patients, “mountains”, but are dominated by a much larger number of infrequently mutated genes, “hills” (7). Although still controversial, these rarely mutated genes may also contribute to tumor development, thus accounting for inter-tumor variability (8)
Next-generation sequencing technologies have revolutionized cancer genomics research by providing fast and accurate information about individual tumors, bringing us closer to personalized medicine (9). It has been reported that approximately 85% of cancer-associated mutations are located in protein-coding regions (10). In consequence, exome sequencing has been revealed as a useful technique for mutation discovery in cancer tissues. Indeed, several studies have successfully described the mutational background of different types of tumors by using this approach (11, 12). Here we have performed an exome sequencing analysis aimed to explore the somatic genomic landscape of microsatellite stable (MSS) stage II colorectal tumors.
METHODS
1. Patients and samples
This study included a subset of 42 paired adjacent normal and tumor tissues (84 samples) from a previously described set of 100 patients with colon cancer diagnosed at stage II and microsatellite stable tumors (13) (colonomics project –CLX-: www.colonomics.org; NCBI BioProject PRJNA188510; Supplementary Table 1). All patients were recruited at the Bellvitge University Hospital (Barcelona, Spain). Written informed consent was obtained from all patients and the Institution’s Ethics Committee approved the protocol. Prior to DNA extraction, purity of the sample was assessed by a pathologist to ensure that at least 80% was tumoral. DNA was extracted using a standard phenol-chloroform protocol. To ensure that adjacent and tumor tissues were paired, dynamic arrays were used to genotype 13 SNPs in the 84 samples (see Material and Methods section 4). All 42 adjacent normal tissues correctly matched with their corresponding tumor (Supplementary Figure 1). Tumor DNA from an additional series of 227 CRC patients from the same hospital was used for validation purposes (Supplementary Table 1). This extended series was not restricted regarding site, stage and microsatellite instability phenotype.
In addition, raw exome sequencing data from 513 samples was downloaded from the Cancer Genome Atlas (TCGA) repository. TCGA-discovery dataset comprised 239 CRC tumors and 100 adjacent mucosae and was used to expand the exome sequencing analysis. These are public samples available in TCGA repository but had not been used in the published work characterizing CRC exomes (14). Moreover, 87 matched non-tumoral and tumoral colorectal samples, herein named TCGA-validation dataset, were used as a validation cohort for AMER1 mutations (Supplementary Table 1). These second set of samples included 44 that already had been analyzed by the TCGA consortium (14), not all of available samples because we requested a paired germline sample to ensure that mutations were somatic. Finally, 224 tumors from the TCGA published work with suitable information about molecular characteristic of the samples were utilized to asses the relationship between AMER1 mutations and CRC molecular subtypes (MSS and CIMP status) (14).
2. Exome sequencing pipeline
Genomic DNA from the set of 42 adjacent-tumor paired samples was sequenced in the National Center of Genomic Analysis, Barcelona, Spain (CNAG) using the Illumina HiSeq-2000 platform. Exome capture was performed with the commercial kit Sure Select XT Human All Exon 50MB (Agilent). Tumor exomes were sequenced at 60X coverage (2×75 bp reads), and exomes from adjacent tissues were sequenced at 40X (2×75 bp reads). FastQ software was used to assess the quality of the sequences (http://www.bioinformatics.bbsrc.ac.uk/projects/fastqc). Bowtie 2.0 software was used to align sequences over the human reference genome HG19 (15). To refine data, reads unmapped, reads with unmapped mate, non-primary alignments, and reads that were PCR or optical duplicates were discarded (http://picard.sourceforge.net/). We also executed a local realignment around indels defined in dbSNP (16) and 1000G (17), and also for the indels detected in this particular study. Variant calling was executed with GATK software and low quality variants (mapping quality below 30, read depth below 10 or frequency < 10%), were discarded (18). GATK has been proved to achieve higher sensitivity and specificity in exome variant calling than other softwares (19). Germline variants were also removed, i.e., variants that were present in normal adjacent paired sequence for each tumor, and variants reported in the 1000G project. Due to the high frequency of indels that were later considered as false positive results, only single nucleotide variants (SNVs) were taken into account in this study. Finally, variants were annotated using the SeattleSeq Variant Annotation web tool (20). The same pipeline was applied to analyze exome data downloaded from TCGA repository. No correlation was observed between the number of mutations found per sample and the quality parameters “number of reads”, “number of no matched reads”, “percentage of unique aligned reads”, “number of duplicate reads” and “coverage”; reinforcing the robustness of the analytic pipeline (Supplementary Figure 2).
Raw exome sequencing data was also used to search for copy number variations (CNV). Coverage data was used to compare the amount of DNA in adjacent vs. tumor samples. The Varscan2 copynumber algorithm was run on adjacent and tumor mpileup obtained from Samtools (21). Next, the copyCaller command was run to adjust raw copy number values for GC content. Finally, R-GADA package was used to perform the segmentation analysis (22). A region was considered lost if the log2 tumor to adjacent mucosa ratio was less than −0.5.
3. Functional and pathways analysis
Databases containing function and pathway information “KEGG”, “Biocarta”, “Reactome” and “GO” were downloaded from MSigDB in GSEA (23). Only the potentially functional SNVs, i.e. coding non-synonymous, stop-gain, stop-lost, splice-5′, splice-3′, coding-synonymous near splice site, 3′-UTR and 5′-UTR variants, were analyzed. For each gene set in each database, a score was calculated by dividing the number of mutations mapping into genes constituting the dataset by the number of genes in such dataset. The score was corrected dividing by the number of samples and multiplying by 100. A p-value was calculated by randomly permuting the original matrix of SNVs. The number of permutations was calculated in each case to ensure that the minimum p-value was at least as small as required by the Bonferroni correction at nominal 0.05 significance level.
4. Validation of KRAS and TP53 point mutations
KASPar genotyping assays (KASP-By-Design, LGC group, Teddington, UK) on the Fluidigm genotyping platform (48.48 Dynamic Array IFG, Fluidigm, San Francisco, CA) were used to validate 6 mutations in KRAS and 8 mutations in TP53. The same methodology was applied to genotype 13 SNPs used to ensure that adjacent and tumor tissues were matched (Supplementary Table 2). Each genotyping assay was previously validated and optimized on the Light-Cycler 480 real-time PCR detection system (Roche Diagnostics GmbH, Mannheim, Germany).
5. Functional prediction of mutations
MutSig software was used to identify the more likely cancer-associated genes from other less suspicious genes. Mutated genes were ranked using three criteria: 1) Abundance of mutations relative to the background mutation rate. 2) Clustering of mutations in hotspots within the gene. 3) Evolutionary conservation of the mutated positions (24). In addition, protein damage predictions of missense mutations in AMER1 were performed by using the in silico algorithms SIFT (25), PolyPhen-2 (26), and PMut (27). Possible alterations of the protein structure were evaluated using the Hope software (28).
6. Sanger sequencing
Sanger sequencing was used to perform a technical validation of exome sequencing. Mutations in KRAS, APC and TP53 genes were sequenced using a standard protocol. Sanger sequencing was also used to validate the recurrent mutations found in AMER1. Two regions in exon 1 (covering 335 and 236 respectively) were sequenced. Sequencing was performed on an ABI Sequencer 3730 and data analyzed using Mutation Surveyor v.3.10. Primer sequences are shown in Supplementary Table 2.
7. Expression data
Gene expression data from GSE44076 dataset (deposited in GEO repository), which includes the 42 sequenced tumors, were used to search for phenotypic similarities among tumors exhibiting loss of AMER1 functionality. “Sub-type B score” and “Sub-type C score” were calculated for each tumor as the mean of absolute expression of those genes described in Roepman et al. (29) as B-type characteristic (53 genes) or C-type characteristic (102 genes). Supplementary Figure 3 showed all molecular data utilized in this study.
8. AMER1 methylation and CIMP phenotype assessment
Tumor methylation in our discovery dataset (CLX data) was analyzed with the Illumina Infinium HumanMethylation450 BeadChip assay covering approximately 20,000 genes (99% of RefSeq genes). AMER1 promoter methylation was extracted from this large dataset. Also, this information has been used to asses CIMP phenotype by interrogating MLH1, RUNX3, CACNA1G, IGF2, NEUROG1, SOCS1, CRABP1 and CDKN2A promoters, as previously reported (30). A tumor was considered to be CIMP high (CIMP-H) if at least 6 out of these 8 genes were hypermethylated.
9. Immunohistochemistry
Xylene-dewaxed paraffin tissue sections (4 microns thick) were obtained from four AMER1 mutated tumors and from three wild type-AMER1 tumors. For antigen retrieval, the slides were boiled after deparaffinization in a pressure cooker for 2 minutes in sodium citrate buffer (10mM Sodium Citrate, 2 mM Citric Acid, pH=6). Endogen peroxidase was blocked by sample immersion in 3% H2O2 during 15 minutes. Blocking was carried out by applying goat serum 1/10 diluted in PBS for 60 minutes at room temperature (RT). Subsequently, the primary antibody against AMER1 (OAAB03558, Aviva Systems Biology, diluted 1:100 in blocking solution) was added and incubated overnight at 4° in a humidified chamber. After rinsing, EnVision system-Goat secondary antibody (Dako, Carpinteria, CA, USA) was applied for 60 minutes at RT and subsequently revealed with DAB substrate (Dako, Carpinteria, CA, USA) exposed for 4 minutes. Slides were counterstained with hematoxylin.
RESULTS
1. Somatic mutational landscape in stage II colon tumors
Exome analysis revealed a total of 11,122 somatic single nucleotide variants (SNVs) within the 42 analyzed tumors (Supplementary Table 3). Many were intergenic and intronic mutations (most of them likely to be false positives due to the lower coverage). Indeed, approximately 50% of SNVs were located in intronic regions (away from canonical splice sites). As expected, all the tumors showed enrichment in C:G > T:A nucleotide changes (Figure 1A). There was no concordance between the number of mutations and the age of the patients, even if only C>T nucleotide changes were taken into account (Supplementary Figure 4). The number of SNVs identified in coding regions and flanking sequences was 4,725. The average number of mutations in coding regions per sample was 117 (range: 6–185) (Figure 1B). From those, 9.6% were coding synonymous, thus a priori not affecting the protein structure. Considering only potentially functional mutations, 22.4% of SNVs were missense, 5.9% in UTR, 2.1% stop-gain or stop-lost, and 0.7% splice-site variants (Supplementary Figure 5).
Figure 1. Single nucleotide somatic mutations (SNVs) across samples.

A. Percentage of mutations by transition / transversion type. B. Number of mutations per sample. Light blue represents the fraction of intronic / intergenic mutations whereas blue represents exonic variants. Dark blue emphasize those potentially functional exonic variants. Horizontal lines represent the mean of SNV for each category.
Remarkably, the vast majority of the identified somatic SNVs (10,985 out of 11,122 total and 4,699 out of 4,725 located in coding regions –more than 99%-) were private events, whereas only 137 SNVs were shared by two or more tumors. Of those, 112 were intronic or intergenic. As expected, the KRAS G12D mutation was the most recurrent change, occurring in 8 out of 42 samples (19%) (Supplementary Table 4). As a methodological validation of the overall discovery pipeline of SNVs, six mutations in KRAS (Q61H, A146T, G12V, G12D, G12S, G13D), and seven in TP53 (G245D, R248Q, R237H, R273C, R175H, R282W, R213*, G245S) were tested using KASPar genotyping assays in the Fluidigm Biomark platform (dynamic arrays), achieving 65% concordance. Of note, 10 out of 11 non-concordant mutations were only found by exome sequencing confirming the better performance and higher sensitivity of this technique (Supplementary Table 5). To further validate the sensitivity of our mutation calling pipeline, 9 point mutations (including 4 not previously validated by dynamic arrays) in APC (1), KRAS (4) and TP53 (4) were validated by Sanger sequencing (the gold standard technique) in all the CLX tumor samples, achieving a 100% concordance (Supplementary Table 5).
After removal of intergenic SNVs (n=962), the remaining 10,160 variants were located in 6,433 genes and 174 of them mapped to more than one gene. Across samples, a total of 723 genes were mutated in more than one tumor. TTN (the largest gene in the human genome) was the most frequently mutated, followed by APC, KRAS and TP53. If only potentially functional mutations were taken into account, APC (22 tumors), KRAS (21 tumors), and TP53 (20 tumors) were the most mutated genes (Figure 2). MutSig software was also used to rank mutated genes on the basis of recurrence and functional effect of mutations. As expected, spurious genes (like the well-know TTN) noticeably went down in the list whereas APC, KRAS and TP53 continued standing out (Supplementary Table 6). These findings were in agreement with previous studies performed to discover mutated genes in CRC (Supplementary Figure 6) (14, 31, 32).
Figure 2. Mutational map representing top mutated genes.

Each column corresponds to each analyzed tumor (n=42) and each line corresponds to genes recurrently mutated. Black hits indicate a functional mutation in such tumor and gene. OncoPrinter tool from cBioPortal has been used to generate this figure (33).
Next, a pathway analysis was performed including 2,856 genes harboring 3,595 potentially functional SNVs. SNVs with putative functional impact accumulated in pathways and functions classically related to cancer such as cell cycle (P-value < 0.001), apoptosis (P-value < 0.001) or cell signaling (P-value < 0.001). Moreover, pathways and functions specifically related to CRC tumors, such as the Wnt pathway (P-value < 0.001), the NOTCH expression and translation (P-value < 0.001), the VEGF pathway (P-value < 0.001), or the TGFB pathway (P-value < 0.001); among others, also appeared enriched in mutated genes. The complete list of statistically significant functions is shown in Supplementary Table 7.
2. SNV analysis in TCGA data
Exome sequencing data from 239 tumors and 100 adjacent mucosae from TCGA (TCGA-discovery) that had not been included in the TCGA Consortium analysis (14) were analyzed using the same pipeline. Only 3.6% of somatic SNVs discovered in our 42 tumors were also found in TCGA-discovery data confirming the high heterogeneity of the CRC mutational landscape. On the other hand, 20 out of 137 recurrent SNVs (15%) were present in the TCGA tumors analyzed (Table 1). Of these, 11 were intronic, one intergenic and one occurred in the 5′-UTR region of the MASP1 gene. Only six out of these 20 recurrent mutations were predicted to have a functional effect at the protein level; five of them being the well-known KRAS G12C, KRAS G12D, TP53 R282W, APC R232* and APC E1353*. A stop-gain mutation in AMER1 c.1489C>T (R497*) was identified in four tumors, two from our series and two from the TCGA-discovery subset, thus deserving further consideration. If only stage II tumors were taken into account barely 1.8% of somatic SNVs discovered in our 42 tumors were validated, but these included 13 out of 137 recurrent ones.
Table 1.
Validated recurrent mutations
Recurrent mutations found in TCGA-discovery data
| Gene | Variant | rs identifier | Function / location | # CLX samples | # TCGA samples |
|---|---|---|---|---|---|
| TP53 | chr17:7577094;G>A | rs28934574 | missense | n=4 AF=0.64;0.6;0.59;0.63 |
n=16 AF=0.63;0.87;0.51;0.84;0.58;0.73;0.57;0.48; 0.39;0.93;1 |
| KRAS | chr12:25398284;C>A | rs121913529 | missense | n=5 AF=0.67;0.46;0.4;0.43;0.46 |
n=25 AF=0.6;0.41;0.45;0.46; 0.67;0.45;0.29;0.43;0. 48;0.3;0.49;0.67;0.2;0. 21;0.43;0.37;0.7;0.44; 0.45;0.31;0.36;0.35;0. 48;0.33;0.4 |
| KRAS | chr12:25398284;C>T | rs121913529 | missense | n=8 AF=0.19;0.46;0.35;0.33;0. 31; 0.24;0.46;0.49 |
n=17 AF=0.35;0.29;0.6;0.25; 0.22;0.3;0.29;0.32;0.27;0.76;0.26;0.35;0.35; 0.42;0.48;0.35;0.52;0. 49;0.31 |
| APC | chr5:112128191;C>T | rs0 | stop-gained | n=4 AF=0.71;0.33;0.29;0.23 |
n=3 AF=0.24;0.34;0.18;0.8 |
| APC | chr5:112175348;G>T | rs0 | stop-gained | n=2 AF=0.71;0.57 |
n=4 AF=0.24;0.34;0.18;0.81 |
| AMER1 | chrX:63411678;G>A | rs0 | stop-gained | n=2 AF=0.31;0.64 |
n=2 AF=0.76;0.65 |
| MASP1 | chr3:187009800;A>T | rs0 | utr-5 | n=3 AF=0.38;0.54;0.41 |
n=1 AF=0.64 |
| MS4A2 | chr11:59861311;A>G | rs113221333 | intronic | n=3 AF=0.20;0.25;0.2 |
n=3 AF=0.31;0.21;0.31 |
| KIF7 | chr15:90173735;G>A | rs0 | intronic | n=3 AF=0.21;0.25;0.2 |
n=1 AF=0.25 |
| KIF13A | chr6:17787892;C>A | rs62394104 | intronic | n=3 AF=0.21;0.16;0.27 |
n=1 AF=0.19 |
| EMC2 | chr8:109468234;T>A | rs111255731 | intronic | n=3 AF=0, 17;0.27;0.18 |
n=1 AF=0.38 |
| HOXD10 | chr2:176983604;C>A | rs73974643 | intronic | n=2 AF=0.21;0.5 |
n=3 AF=0.34;0.21;0.19 |
| SETD2 | chr3:47143125;C>T | rs200952697 | intronic | n=2 AF=0.22;0.22 |
n=3 AF=0.16;0.44;0.29 |
| PDS5B | chr13:33253144;A>C | rs199860513 | intronic | n=2 AF=0.18;0.18 |
n=3 AF=0.36 |
| AGBL1 | chr15:87474796;T>G | rs0 | intronic | n=2 AF=0.23;0.36 |
n=1 AF=0.36 |
| NUP133 | chr1:229623415;A>T | rs0 | intronic | n=2 AF=0.2;0.19 |
n=1 AF=0.3 |
| DPP9 | chr19:4720039;A>C | rs0 | intronic | n=2 AF=0.23;0.35 |
n=1 AF=0.54 |
| PARL | chr3:183584713;C>T | rs199558489 | intronic | n=2 AF=0.25;0.3 |
n=1 AF=0.23 |
| VCL | chr10:75874194;T>C | rs0 | intronic | n=2 AF=0.23;0.19 |
n=1 AF=0.35 |
| intergenic | chr3:195433152;G>A | rs76183393 | intergenic | n=2 AF=0.52;0.33 |
n=3 AF=0.42;0.41;0.66 |
Reference genome: hg19
AF: Allelic Frequency
3. Somatic mutations in AMER1
In addition to the recurrent mutation R497*, two more tumors from our series showed stop-gain mutations in AMER1 (also known as FAM123B or WTX): c.1891C>T (R631*) and c.1876C>T (R626*), with 31%, 64%, 58% and 55% of allelic frequency, respectively. All four mutations were validated by Sanger sequencing (Supplementary Figure 7A). In the TCGA-discovery dataset, 25 out of 239 tumors (10.5%) accumulated 26 different somatic mutations in AMER1 including the recurrent R497* (Supplementary Figure 7B). From these, 10 were stop-codon, 10 missense, 3 coding-synonymous, and 3 were located in the UTR regions of the gene (Figure 3 and Supplementary Table 8).
Figure 3. AMER1 mutations.
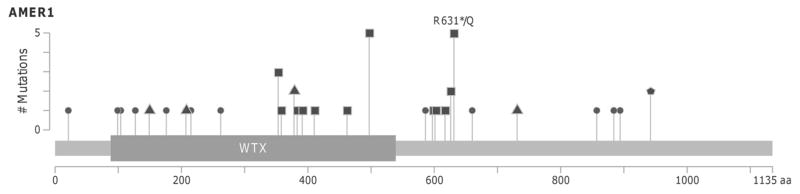
Lollipop plot showing the distribution of AMER1 mutations across the coding protein. Y-axis represents the number of mutations. Circles indicate missense mutations, squares truncating mutations and triangles synonym mutations. Pentagon indicate residues affected by different mutation types. MutationMapper tool from cBioPortal has been used to generate this figure (33).
Additional validation of AMER1 mutations was performed in independent series of CRC, including 87 TCGA cases (TCGA-validation subset) and 227 CRC tumors recruited at the Bellvitge University Hospital. Exome sequencing data analysis of TCGA-validation revealed that 15% (13/87) of the tumors carried somatic variants in AMER1. In all, 2 variants were stop-gain, 4 missense, 2 synonymous and 5 were located in the 3′-UTR region (Supplementary Table 8). The most recurrently mutated regions of AMER1 were Sanger sequenced in the 227 colon tumors from the Bellvitge University Hospital. In this series, three previously identified recurrent stop-gain mutations, R497*, R631* and R626*, were detected in 5 tumors (Supplementary Figure 7C). In all mutated cases, adjacent mucosa exhibited a wild-type genotype supporting the somatic origin of the mutations (Supplementary Figure 7A and C). Regarding the functional effect of the identified missense mutations, ten out of the fourteen were predicted to be damaging by at least one of the prediction algorithms used (Supplementary Table 8).
Under the hypothesis that chromosome deletions can also cause the somatic loss of AMER1, exome sequencing data was used to detect CNVs in chromosome X. One out of the 42 analyzed tumors exhibited the complete loss of one copy of such chromosome (Supplementary Figure 8). Actually, the patient was a female whose tumor also carried a truncating mutation in AMER1, suggesting the complete inactivation of AMER1.
To assess whether other molecular mechanisms, apart from mutation or CNV, could inactivate AMER1, its methylation status was evaluated in 96 samples (including the 42 sequenced tumors, NCBI BioProject PRJNA188510). In females, several tumors were found to be hypo and hyper-methylated in the promoter region when compared to their paired adjacent samples. As expected, a negative correlation (Pearson r = −0.22, p=0.03) between the level of methylation and AMER1 expression was found in this subset of patients. This trend suggests that some tumors may have AMER1 inactive by an epigenetic regulatory mechanism (Supplementary Figure 9). Nevertheless, nor CNV neither methylation were as frequent inactivating events as mutations, in our data.
4. Phenotypic features associated with AMER1 inactivation
To confirm the effect of AMER1 truncating mutations at the protein level, immunohistochemical staining was performed in the 4 (stop-gain) mutated samples of the original series. As expected, no protein expression or reduction in expression was detected in 3 out of 4 analyzed tumors whereas strong staining was detected in all adjacent samples and tumors not harboring mutations in AMER1 (Supplementary Figure 10). To decipher whether AMER1 mutational inactivation confers a characteristic tumor phenotype, we used expression data from the same tumors to assess if AMER1-silenced tumors showed characteristic patterns of expression of related pathways and functions (data deposited in GEO repository with access code GSE44076 and project code PRJNA188510). In addition to AMER1 mutated and hypermethylated tumors, one male patient from the GSE44076 set showing the complete loss of chromosome X was included in this analysis (data not shown). As expected, tumors with altered AMER1 tended to cluster together when analyzing the genes related to beta-catenin binding (Figure 4A) and to the Wnt pathway (Figure 4B). Regarding the latter, overall Wnt-related genes were underexpressed in cluster 1, grouping 7 out of 9 tumors with aberrant AMER1. In fact, over-expressed genes in this cluster included Wnt inhibitors such as PRICKLE1, PRICKLE2 and DAAM2, Wnt antagonists such as the SFRP family and SOX17, and non-canonical Wnt pathway activators such as WNT5A. Moreover, the potential prognostic value of AMER1 was assessed, but no association was found with disease-free survival (Cox’s proportional hazards p-value=0.58).
Figure 4. Phenotypic features associated with AMER1 inactivation.

Heatmap showing gene expression profile of genes implicated in beta-catenin binding function (A) and Wnt pathway (B). Those tumors with loss of AMER1 tend to aggregate in the same cluster. Color bars represent AMER1 mutated tumors (in red from exome sequencing and in orange from Sanger sequencing), a tumor from a male patient with loss of chromosome X by CNV (violet) and a tumor with hypermethylation in AMER1 (dark pink). Under-expression is painted in yellow whereas down-expression is painted in blue C. Boxplots showing differences in score B subtype and score C subtype between tumors lacking and non-lacking AMER1 gene (named as AMER1), between the 2 main clusters defined in figure 4B (named as Clusters), and between tumors with and without mutations in AMER1 in TCGA data (named as TCGA mutations). P-value is based on the non-parametric Mann-Whitney test.
We also evaluated the co-occurrence of AMER1 mutations with mutations in genes related to the Wnt pathway as described in (14). Within 266 tumors (discovery dataset and TCGA), 72% of AMER1-mutated samples had also APC mutated. However, co-occurrence of AMER1 mutations with other Wnt genes were rare (i.e. CTNNB1 1 out of 12, DKK2 1 out of 7, TCF7L2 3 out of 19), or even mutually exclusive (i.e. LRP5) (Supplementary Figure 11).
We next assessed the relationship between AMER1 mutational status and MSI-MSS-CIMP molecular subtypes, as well as KRAS and BRAF mutational status. Samples from CLX and TCGA were used (n=322). We found that the majority of AMER1 lacking tumors were MSS (70%) BRAF wild type (91%) and CIMP–H negative (88%) (Supplementary Figure 12). We also wanted to assess if AMER1-deficient tumors belong to any of the recently described molecular subtypes of CRC. We used the gene lists reported by Roepman et al. (29) to construct a score able to rank tumors according to subtype B or subtype C gene expression. Because our study only included MSS tumors, subtype A (which mainly comprises microsatellite instable tumors, MSI) was not included in the analysis. Subtype B mainly comprises epithelial tumors with active Wnt and better prognosis whereas those subtype C were mesenchymal tumors exhibiting worse prognosis. We observed that AMER1-deficient tumors tend to score higher in the C than in the B subtype (also if only mutated tumors were taking into account – Supplementary Figure 13-). This trend was even more marked when tumors from the two main clusters defined in Figure 4B were compared. The lower score in B subtype shown by AMER1-mutant tumors was also validated in 224 tumors from published TCGA data (Figure 4C). This result was supported by the level of expression of molecular markers associated with the C subtype: a decrease in proliferation markers and an increase in EMT, NOTCH, and VEGF markers (Supplementary Figure 14).
Public data from cBio Cancer Genomics Portal was used to compare mutations and deletions of AMER1 gene across different cancer types (33). Colorectal was the tumor that accumulated more mutations (more than 10%) followed by lung, endometrial and melanoma. On the contrary, other tumors such as leukemia, medulloblastoma, breast or ovary showed none or low levels of AMER1 mutations. One study in prostate cancer found more than 20% of tumors with amplifications in this locus. However, 6 more prostate studies showed nor mutations neither CNV in AMER1 (Supplementary Figure 15).
DISCUSSION
In an attempt to better understand the CRC pathobiology at a genomic level, 42 colon tumors were profiled by means of exome sequencing. Despite the high mutational heterogeneity among tumors, mutations in AMER1 emerged as a recurrent feature in CRC. Reinforcing its putative role as a driver gene, MutSig software scored AMER1 between the top-10 functional genes (p-value = 0.018) along with TP53, APC and KRAS. Though mutations in AMER1 have been observed in other studies, this gene has not received proper attention as a potential driver for CRC.
AMER1 (also known as FAM123B or WTX) is a gene located in chromosome X that codifies a highly conserved membrane protein that acts as scaffold for β-catenin degradation. AMER1 is associated with the plasma membrane via two N-terminal domains and forms complexes with APC, b-catenin, Axin and b-TrCP. It can recruit APC from microtubules to the plasma membrane and it is also involved in stimulating LRP6 phosphorylation (34). In tumors, AMER1 is a negative regulator of the Wnt/b-catenin pathway by promoting b-catenin ubiquitination and degradation (35). Also, it has been reported as a repressor of Wnt signaling when cells establish cell-cell contacts. AMER1 maintains the integrity of cellular junctions by mediating the membrane localization of APC (36).
Truncating mutations in the AMER1 gene are frequent in Wilms tumors (30%), which are pediatric tumors of the kidney (37). Yoo et al. performed a mutational analysis of AMER1 in gastric, colorectal, and hepatocellular carcinomas and found no mutations in CRC tumors (0/141) (38). However, the TCGA consortium reported AMER1 as a frequently mutated gene in CRC (14). Seshagiri et al. also found functional mutations in AMER1 gene in CRC tumors: R177C, E384*, G105D and E244* (39). Recently, mutations in AMER1 have also been described in metastatic CRC samples and their paired primary tumors (40). Interestingly, somatic mutations affecting an X chromosome gene raise the possibility of one-hit inactivation of a tumor suppressor gene. Indeed, 6 out of 7 mutations in our set occurred in male tumors and the loss of the AMER1-wildtype copy of chromosome X was observed in the AMER1-mutated tumor developed by a female. Interestingly, Han et al. previously reported the deletion of the AMER1 locus (Xq11) in Wilms tumors, providing evidence of the inactivation of the gene via copy number changes (41). Regarding our analysis of the TCGA-data, 10 out of the 14 stop-gain mutations were found in males, as well as 10 of the 14 missense mutations. AMER1 has been classically catalogued as a Wnt signaling inhibitor due to its belonging to the beta-catenin complex. In this scenario, loss of AMER1 would lead to activation of canonical Wnt pathway by beta-catenin translocation into the nucleus. However, our results point to the inactivation of Wnt signaling or to the activation of a non-canonical Wnt pathway in AMER1-mutated tumors. These findings suggest that AMER1 has an alternative function to its role in the canonical Wnt-signaling pathway in CRC tumors, as has been proposed by other authors (42). Indeed, it has been described that AMER1 inhibits or activates the Wnt pathway in Wilms disease, depending on the mesenchymal or epithelial origin of the tumor. AMER1 mutations in the mesenchymal lineage lead to nuclear accumulation of beta-catenin and subsequent up-regulation of Wnt targets. On the other hand, AMER1 mutations in the epithelial lineage are not associated with active Wnt (42). This observation agrees with our findings, where AMER1-mutated CRC (epithelial) tumors, show inactive Wnt. Interestingly, more than 50% of tumors harboring AMER1 mutations were also APC-mutants whereas they rarely co-occurred with CTNNB1 and other genes in the Wnt pathway, probably indicating a characteristic and exclusive pathway activation of AMER1-tumors. Regarding molecular classification, our results pointed to AMER1-mutant tumors as mainly MSS and in rare co-occurrence with the CIMP phenotype and BRAF mutations. Recently, molecular sub-typing of CRC that takes into account different molecular features of the tumors has been proposed (4, 29). Our results suggested that the subset of tumors lacking AMER1 expression could belong to type-C tumors. This subtype is characterized by the expression of EMT markers and shows lower proliferative ratio. Clinically, type C tumors exhibit poor prognosis and are chemotherapy resistant. However, our results showed no association between mutational status of AMER1 and tumor relapse.
In concordance with previous observations (43, 44), the mutational patterns of colon tumors are highly heterogeneous. Our results indicate that the vast majority of SNVs were private (non recurrent). Indeed, an independent validation only found 3% of SNVs shared by more than one tumor, confirming the high heterogeneity of the CRC mutational landscape. Nevertheless, 15% of the small fraction of recurrent mutations found in our study were also observed in the TCGA tumors, being the well-known driver mutation KRAS G12D the most recurrent one (14). Also in consistence with previous CRC genomic studies, mutational changes in CRC are predominated by C:G > T:A transitions (14, 32, 45). The background rate of somatic mutations in CRC has been reported to be approximately 1 mutation per megabase (46). However, mutation frequencies in CRC tumors are not homogeneous due to differences in the status of the mismatch repair machinery (MSI vs. MSS) or to the presence or absence of POLE mutations (14, 47). Since our sample did not include microsatellite instable tumors, the observed mutation rate and number of SNVs are similar to those previously reported in MSS colorectal tumors.
In our series APC appeared as the most mutated gene followed by KRAS, TP53 and TTN. TTN mutations have been previously identified in CRC (14) and in other tumors (48), probably due to the fact that it codes for the longest human protein, increasing the likelihood of passenger mutations, most probably unrelated to cancer (24). Other recurrently mutated genes deserve further consideration: mutations in FBXW7, a gene encoding a protein implicated in Notch signaling, were identified in 12% of the tumors. Similar results have been reported in a recent CRC study comparing primary and metastatic colorectal tumors (49). Also, 9.5% of tumors showed mutations in CSMD1, which have been associated with poor prognosis in CRC (50, 51). Interestingly, in our study all functional CSMD1 mutations occurred in patients who relapsed. Recently described as recurrently mutated genes in CRC, SYNE1, FAT4, ATM and USH2A, (32) were also found in our study with more than one tumor mutated (Figure 2).
The mutational patterns of CRC are highly heterogeneous among patients. However, mutations tend to accumulate in common pathways and functions crucial for tumorigenesis (i.e. apoptosis, cell cycle). This suggests that a broad range of equivalent genetic aberrations could deregulate key pathways in carcinogenesis, as has already been postulated (52). In other words, diverse molecular alterations could converge in similar phenotypes.
Exome sequencing is a useful technique to discover still unknown mutations that can lead us to a better understanding of the mechanisms underlying colorectal carcinogenesis. However, it also has technical limitations. Mutations are more easily detected in high-coverage regions, so regions at the extremes of the captured exons many suffer from smaller sensitivity. Also, capture kits do not cover equally all exons in the genome. Moreover, tumor heterogeneity and stromal contamination must be taken into account since it may lead to difficulties in differentiating low frequency mutations from technical artifacts. Our mutation-calling algorithm required a minimum number of reads with the mutation and total coverage to increase the likelihood of a correct mutation calling.
In conclusion, our exome sequencing approach has revealed that MSS stage II colon tumors exhibit a highly heterogeneous somatic mutational landscape. In concordance with previous studies, this finding clearly suggests that CRC is not a single disease and supports the necessity of pathway-directed treatments. We have also described that approximately 10% of CRC tumors often harbor AMER1 inactivation due to somatic mutation, loss of the chromosome X or hyper-methylation (in lower fraction). This subgroup of tumors with AMER1 deficiency also exhibited a particular gene expression pattern in Wnt-signaling pathway genes and show an overall gene expression phenotype similar to the molecular subtype C described by Roepman et al (29). Although promising, further experimental work is required in order to clearly demonstrate the role of AMER1 as a tumor suppressor gene in colon cancer tumors.
Supplementary Material
STATEMENT OF TRANSLATIONAL RELEVANCE.
Exome sequencing analysis in colorectal cancer (CRC) samples reveals that variants resulting in stop-codons in AMER1 (also known as FAM123B or WTX) gene appeared in approximately 10% of the analyzed tumors. Moreover, although less commonly, AMER1 function may also be lost by other mechanisms different from mutations such as promoter hyper-methylation and chromosome deletions. The subset of tumors lacking AMER1 expression showed Wnt pathway inhibition and, regarding molecular sub-typing, could belong to type-C tumors. These results may enlighten about the mechanisms of carcinogenesis and biomarker discovery in those patients lacking AMER1.
Acknowledgments
We would like to thank Carmen Atencia, Pilar Medina, and Isabel Padrol for their help with the clinical annotation of the samples. Also Ana Mª Corraliza for helping with bioinformatics analysis and Gemma Aiza for technical assistance.
Financial support: This study was supported by the Instituto de Salud Carlos III grants (FIS PI09-01037, PI11-01439 and PIE13-00022), CIBERESP CB07/02/2005, Spanish Ministry of Economy and Competitiveness (SAF2012-38885), the Spanish Association Against Cancer (AECC) Scientific Foundation, the Catalan Government DURSI grant 2014SGR647, and National Institutes of Health grant U19CA148107 (CORECT). Sample collection was supported by the Xarxa de Bancs de Tumors de Catalunya sponsored by Pla Director d’Oncología de Catalunya (XBTC).
Footnotes
Conflict of interest: The authors have declared that no competing interests exist.
References
- 1.Ferlay J, Steliarova-Foucher E, Lortet-Tieulent J, et al. Cancer incidence and mortality patterns in Europe: estimates for 40 countries in 2012. Eur J Cancer. 2013;49:1374–403. doi: 10.1016/j.ejca.2012.12.027. [DOI] [PubMed] [Google Scholar]
- 2.Fearon ER, Vogelstein B. A genetic model for colorectal tumorigenesis. Cell. 1990;61:759–67. doi: 10.1016/0092-8674(90)90186-i. [DOI] [PubMed] [Google Scholar]
- 3.Ogino S, Goel A. Molecular classification and correlates in colorectal cancer. J Mol Diagn. 2008;10:13–27. doi: 10.2353/jmoldx.2008.070082. [DOI] [PMC free article] [PubMed] [Google Scholar]
- 4.Sanz-Pamplona RSC, Grasselli J, Molleví DG, Dienstmann R, Paré-Brunet L, Sanjuan X, Biondo S, Capella G, Tabernero J, Salazar R, Moreno V. Unsupervised analyses reveal molecular subtypes associated to prognosis and response to therapy in colorectal cancer. Colorectal Cancer. 2014;3:277–88. [Google Scholar]
- 5.Stratton MR, Campbell PJ, Futreal PA. The cancer genome. Nature. 2009;458:719–24. doi: 10.1038/nature07943. [DOI] [PMC free article] [PubMed] [Google Scholar]
- 6.Markowitz SD, Bertagnolli MM. Molecular origins of cancer: Molecular basis of colorectal cancer. N Engl J Med. 2009;361:2449–60. doi: 10.1056/NEJMra0804588. [DOI] [PMC free article] [PubMed] [Google Scholar]
- 7.Wood LD, Parsons DW, Jones S, et al. The genomic landscapes of human breast and colorectal cancers. Science. 2007;318:1108–13. doi: 10.1126/science.1145720. [DOI] [PubMed] [Google Scholar]
- 8.Gonzalez-Perez A, Lopez-Bigas N. Functional impact bias reveals cancer drivers. Nucleic Acids Res. 2012;40:e169. doi: 10.1093/nar/gks743. [DOI] [PMC free article] [PubMed] [Google Scholar]
- 9.Shendure J, Mitra RD, Varma C, Church GM. Advanced sequencing technologies: methods and goals. Nat Rev Genet. 2004;5:335–44. doi: 10.1038/nrg1325. [DOI] [PubMed] [Google Scholar]
- 10.Izarzugaza JM, Redfern OC, Orengo CA, Valencia A. Cancer-associated mutations are preferentially distributed in protein kinase functional sites. Proteins. 2009;77:892–903. doi: 10.1002/prot.22512. [DOI] [PubMed] [Google Scholar]
- 11.Agrawal N, Frederick MJ, Pickering CR, et al. Exome sequencing of head and neck squamous cell carcinoma reveals inactivating mutations in NOTCH1. Science. 2011;333:1154–7. doi: 10.1126/science.1206923. [DOI] [PMC free article] [PubMed] [Google Scholar]
- 12.Jia D, Dong R, Jing Y, et al. Exome sequencing of hepatoblastoma reveals novel mutations and cancer genes in the Wnt pathway and ubiquitin ligase complex. Hepatology. 2014 doi: 10.1002/hep.27243. [DOI] [PubMed] [Google Scholar]
- 13.Sanz-Pamplona R, Berenguer A, Cordero D, et al. Aberrant gene expression in mucosa adjacent to tumor reveals a molecular crosstalk in colon cancer. Mol Cancer. 2014;13:46. doi: 10.1186/1476-4598-13-46. [DOI] [PMC free article] [PubMed] [Google Scholar]
- 14.TCGA. Comprehensive molecular characterization of human colon and rectal cancer. Nature. 2012;487:330–7. doi: 10.1038/nature11252. [DOI] [PMC free article] [PubMed] [Google Scholar]
- 15.Langmead B, Salzberg SL. Fast gapped-read alignment with Bowtie 2. Nat Methods. 2012;9:357–9. doi: 10.1038/nmeth.1923. [DOI] [PMC free article] [PubMed] [Google Scholar]
- 16.Sherry ST, Ward MH, Kholodov M, et al. dbSNP: the NCBI database of genetic variation. Nucleic Acids Res. 2001;29:308–11. doi: 10.1093/nar/29.1.308. [DOI] [PMC free article] [PubMed] [Google Scholar]
- 17.Abecasis GR, Auton A, Brooks LD, et al. An integrated map of genetic variation from 1,092 human genomes. Nature. 2012;491:56–65. doi: 10.1038/nature11632. [DOI] [PMC free article] [PubMed] [Google Scholar]
- 18.DePristo MA, Banks E, Poplin R, et al. A framework for variation discovery and genotyping using next-generation DNA sequencing data. Nat Genet. 2011;43:491–8. doi: 10.1038/ng.806. [DOI] [PMC free article] [PubMed] [Google Scholar]
- 19.Xu H, DiCarlo J, Satya RV, Peng Q, Wang Y. Comparison of somatic mutation calling methods in amplicon and whole exome sequence data. BMC Genomics. 2014;15:244. doi: 10.1186/1471-2164-15-244. [DOI] [PMC free article] [PubMed] [Google Scholar]
- 20.Ng SB, Turner EH, Robertson PD, et al. Targeted capture and massively parallel sequencing of 12 human exomes. Nature. 2009;461:272–6. doi: 10.1038/nature08250. [DOI] [PMC free article] [PubMed] [Google Scholar]
- 21.Koboldt DC, Zhang Q, Larson DE, et al. VarScan 2: somatic mutation and copy number alteration discovery in cancer by exome sequencing. Genome Res. 2012;22:568–76. doi: 10.1101/gr.129684.111. [DOI] [PMC free article] [PubMed] [Google Scholar]
- 22.Pique-Regi R, Caceres A, Gonzalez JR. R-Gada: a fast and flexible pipeline for copy number analysis in association studies. BMC Bioinformatics. 2010;11:380. doi: 10.1186/1471-2105-11-380. [DOI] [PMC free article] [PubMed] [Google Scholar]
- 23.Subramanian A, Tamayo P, Mootha VK, et al. Gene set enrichment analysis: a knowledge-based approach for interpreting genome-wide expression profiles. Proc Natl Acad Sci U S A. 2005;102:15545–50. doi: 10.1073/pnas.0506580102. [DOI] [PMC free article] [PubMed] [Google Scholar]
- 24.Lawrence MS, Stojanov P, Polak P, et al. Mutational heterogeneity in cancer and the search for new cancer-associated genes. Nature. 2013;499:214–8. doi: 10.1038/nature12213. [DOI] [PMC free article] [PubMed] [Google Scholar]
- 25.Kumar P, Henikoff S, Ng PC. Predicting the effects of coding non-synonymous variants on protein function using the SIFT algorithm. Nat Protoc. 2009;4:1073–81. doi: 10.1038/nprot.2009.86. [DOI] [PubMed] [Google Scholar]
- 26.Adzhubei IA, Schmidt S, Peshkin L, et al. A method and server for predicting damaging missense mutations. Nat Methods. 2010;7:248–9. doi: 10.1038/nmeth0410-248. [DOI] [PMC free article] [PubMed] [Google Scholar]
- 27.Ferrer-Costa C, Gelpi JL, Zamakola L, Parraga I, de la Cruz X, Orozco M. PMUT: a web-based tool for the annotation of pathological mutations on proteins. Bioinformatics. 2005;21:3176–8. doi: 10.1093/bioinformatics/bti486. [DOI] [PubMed] [Google Scholar]
- 28.Venselaar H, Te Beek TA, Kuipers RK, Hekkelman ML, Vriend G. Protein structure analysis of mutations causing inheritable diseases. An e-Science approach with life scientist friendly interfaces. BMC Bioinformatics. 2010;11:548. doi: 10.1186/1471-2105-11-548. [DOI] [PMC free article] [PubMed] [Google Scholar]
- 29.Roepman P, Schlicker A, Tabernero J, et al. Colorectal cancer intrinsic subtypes predict chemotherapy benefit, deficient mismatch repair and epithelial-to-mesenchymal transition. Int J Cancer. 2014;134:552–62. doi: 10.1002/ijc.28387. [DOI] [PMC free article] [PubMed] [Google Scholar]
- 30.Ogino S, Kawasaki T, Kirkner GJ, Kraft P, Loda M, Fuchs CS. Evaluation of markers for CpG island methylator phenotype (CIMP) in colorectal cancer by a large population-based sample. J Mol Diagn. 2007;9:305–14. doi: 10.2353/jmoldx.2007.060170. [DOI] [PMC free article] [PubMed] [Google Scholar]
- 31.Tamborero D, Gonzalez-Perez A, Perez-Llamas C, et al. Comprehensive identification of mutational cancer driver genes across 12 tumor types. Sci Rep. 2013;3:2650. doi: 10.1038/srep02650. [DOI] [PMC free article] [PubMed] [Google Scholar]
- 32.Yu J, Wu WK, Li X, et al. Novel recurrently mutated genes and a prognostic mutation signature in colorectal cancer. Gut. 2014 doi: 10.1136/gutjnl-2013-306620. [DOI] [PMC free article] [PubMed] [Google Scholar]
- 33.Cerami E, Gao J, Dogrusoz U, et al. The cBio cancer genomics portal: an open platform for exploring multidimensional cancer genomics data. Cancer Discov. 2012;2:401–4. doi: 10.1158/2159-8290.CD-12-0095. [DOI] [PMC free article] [PubMed] [Google Scholar]
- 34.Tanneberger K, Pfister AS, Kriz V, Bryja V, Schambony A, Behrens J. Structural and functional characterization of the Wnt inhibitor APC membrane recruitment 1 (Amer1) J Biol Chem. 2011;286:19204–14. doi: 10.1074/jbc.M111.224881. [DOI] [PMC free article] [PubMed] [Google Scholar]
- 35.Major MB, Camp ND, Berndt JD, et al. Wilms tumor suppressor WTX negatively regulates WNT/beta-catenin signaling. Science. 2007;316:1043–6. doi: 10.1126/science/1141515. [DOI] [PubMed] [Google Scholar]
- 36.Grohmann A, Tanneberger K, Alzner A, Schneikert J, Behrens J. AMER1 regulates the distribution of the tumor suppressor APC between microtubules and the plasma membrane. J Cell Sci. 2007;120:3738–47. doi: 10.1242/jcs.011320. [DOI] [PubMed] [Google Scholar]
- 37.Rivera MN, Kim WJ, Wells J, et al. An X chromosome gene, WTX, is commonly inactivated in Wilms tumor. Science. 2007;315:642–5. doi: 10.1126/science.1137509. [DOI] [PubMed] [Google Scholar]
- 38.Yoo NJ, Kim S, Lee SH. Mutational analysis of WTX gene in Wnt/beta-catenin pathway in gastric, colorectal, and hepatocellular carcinomas. Dig Dis Sci. 2009;54:1011–4. doi: 10.1007/s10620-008-0458-9. [DOI] [PubMed] [Google Scholar]
- 39.Seshagiri S, Stawiski EW, Durinck S, et al. Recurrent R-spondin fusions in colon cancer. Nature. 2012;488:660–4. doi: 10.1038/nature11282. [DOI] [PMC free article] [PubMed] [Google Scholar]
- 40.Brannon AR, Vakiani E, Sylvester BE, et al. Comparative sequencing analysis reveals high genomic concordance between matched primary and metastatic colorectal cancer lesions. Genome Biol. 2014;15:454. doi: 10.1186/s13059-014-0454-7. [DOI] [PMC free article] [PubMed] [Google Scholar]
- 41.Han M, Rivera MN, Batten JM, Haber DA, Dal Cin P, Iafrate AJ. Wilms’ tumor with an apparently balanced translocation t(X;18) resulting in deletion of the WTX gene. Genes Chromosomes Cancer. 2007;46:909–13. doi: 10.1002/gcc.20476. [DOI] [PubMed] [Google Scholar]
- 42.Fukuzawa R, Anaka MR, Weeks RJ, Morison IM, Reeve AE. Canonical WNT signalling determines lineage specificity in Wilms tumour. Oncogene. 2009;28:1063–75. doi: 10.1038/onc.2008.455. [DOI] [PubMed] [Google Scholar]
- 43.Vogelstein B, Papadopoulos N, Velculescu VE, Zhou S, Diaz LA, Jr, Kinzler KW. Cancer genome landscapes. Science. 2013;339:1546–58. doi: 10.1126/science.1235122. [DOI] [PMC free article] [PubMed] [Google Scholar]
- 44.Sjoblom T, Jones S, Wood LD, et al. The consensus coding sequences of human breast and colorectal cancers. Science. 2006;314:268–74. doi: 10.1126/science.1133427. [DOI] [PubMed] [Google Scholar]
- 45.Kandoth C, McLellan MD, Vandin F, et al. Mutational landscape and significance across 12 major cancer types. Nature. 2013;502:333–9. doi: 10.1038/nature12634. [DOI] [PMC free article] [PubMed] [Google Scholar]
- 46.Bardelli A, Parsons DW, Silliman N, et al. Mutational analysis of the tyrosine kinome in colorectal cancers. Science. 2003;300:949. doi: 10.1126/science.1082596. [DOI] [PubMed] [Google Scholar]
- 47.Burrell RA, McGranahan N, Bartek J, Swanton C. The causes and consequences of genetic heterogeneity in cancer evolution. Nature. 2013;501:338–45. doi: 10.1038/nature12625. [DOI] [PubMed] [Google Scholar]
- 48.Greenman C, Stephens P, Smith R, et al. Patterns of somatic mutation in human cancer genomes. Nature. 2007;446:153–8. doi: 10.1038/nature05610. [DOI] [PMC free article] [PubMed] [Google Scholar]
- 49.Xie T, Cho YB, Wang K, et al. Patterns of somatic alterations between matched primary and metastatic colorectal tumors characterized by whole-genome sequencing. Genomics. 2014 doi: 10.1016/j.ygeno.2014.07.012. [DOI] [PubMed] [Google Scholar]
- 50.Zhang R, Song C. Loss of CSMD1 or 2 may contribute to the poor prognosis of colorectal cancer patients. Tumour Biol. 2014;35:4419–23. doi: 10.1007/s13277-013-1581-6. [DOI] [PubMed] [Google Scholar]
- 51.Shull AY, Clendenning ML, Ghoshal-Gupta S, et al. Somatic mutations, allele loss, and DNA methylation of the Cub and Sushi Multiple Domains 1 (CSMD1) gene reveals association with early age of diagnosis in colorectal cancer patients. PLoS One. 2013;8:e58731. doi: 10.1371/journal.pone.0058731. [DOI] [PMC free article] [PubMed] [Google Scholar]
- 52.Vogelstein B, Kinzler KW. Cancer genes and the pathways they control. Nat Med. 2004;10:789–99. doi: 10.1038/nm1087. [DOI] [PubMed] [Google Scholar]
Associated Data
This section collects any data citations, data availability statements, or supplementary materials included in this article.