

Abstract
The fibroblast growth factor receptor FGFR1 is a therapeutic target under investigation in multiple solid tumors and clinical trials of selective tyrosine kinase inhibitors (TKI) are underway. Treatment with single TKI represents a logical step towards personalized cancer therapy, but intrinsic and acquired resistance mechanisms limit their long-term benefit. In this study, we deployed RNAi-based functional genomic screens to identify protein kinases controlling the intrinsic sensitivity of FGFR1-dependent lung cancer and head and neck squamous cell cancer (HNSCC) cells to ponatinib, a multi-kinase FGFR-active inhibitor. We identified and validated a synthetic lethal interaction between Mammalian Target of Rapamycin (MTOR) and ponatinib in non-small cell lung carcinoma cells. Additionally, treatment with MTOR-targeting shRNAs and pharmacological inhibitors revealed that MTOR is an essential protein kinase in other FGFR1-expressing cancer cells. The combination of FGFR inhibitors and MTOR or AKT inhibitors resulted in synergistic growth suppression in vitro. Notably, tumor xenografts generated from FGFR1-dependent lung cancer cells exhibited only modest sensitivity to monotherapy with the FGFR-specific TKI, AZD4547, but when combined with the MTOR inhibitor, AZD2014, significantly attenuated tumor growth and prolonged survival. Our findings support the existence of a signaling network wherein FGFR1-driven ERK and activated MTOR/AKT represent distinct arms required to induce full transformation. Further, they suggest clinical efficacy of treatments for FGFR1-driven lung cancers and HNSCC may be achieved by combining MTOR inhibitors and FGFR-specific TKIs.
INTRODUCTION
Our studies and those of others demonstrate that over-expressed, non-mutated FGFR1 participates as an oncogenic driver via autocrine FGFs in cell lines derived from lung cancers of all histologies (1–5), head and neck squamous cell carcinomas (HNSCC) (6,7) and malignant pleural mesothelioma (8). As a result, multiple early phase clinical trials of FGFR-targeting TKIs are now underway including a study of the multi-kinase TKI, ponatinib (9), in lung cancer at our institution (NCT01935336).
The clinical efficacy of FGFR TKIs as single anti-cancer agents is not fully realized. Yet, the problem of intrinsic and acquired resistance to TKI monotherapy has emerged as a major limitation to long-term control or cure of solid tumors (10–13) and portends similar difficulties with single FGFR TKIs as therapeutics. Defining mechanisms of acquired resistance to targeted therapeutics is an ongoing subject of intense investigation and sets the stage for strategies to deploy inhibitors of the resistance mechanisms following treatment failure of the initial drug. Thus, “serial monotherapy” has emerged as a logical approach in clinical oncology for solid tumors including lung cancer. In this regard, however, it is important to review the lessons learned from acquired resistance to antimicrobial and antiviral monotherapy over the past 60 years (reviewed in (12)). The present strategy to combat acquired resistance to monotherapy in cancer by deploying sequential therapies to block emergent resistance pathways (i.e., MET inhibitors after resistance to EGFR-specific TKIs) failed as a strategy to cure TB and HIV infections.
Importantly, therapeutic success in HIV and TB infections was only achieved when combinations of inhibitors were deployed that induced rapid and synergistic suppression of the infectious agent at the onset of therapy, thereby preventing the emergence of drug resistance (12). We hypothesize that the development of rational, mechanism-based combinations of inhibitors that simultaneously inhibit multiple elements within transforming RTK co-activation networks (14) active in cancer cells may achieve a similar impact on cancer cure or control. In this study, we deployed functional genomics screens with a kinome targeting shRNA library to identify auxiliary pathways that co-signal with FGFR1 in lung cancer and HNSCC cell lines. Our studies establish mammalian target of rapamycin (MTOR) as a protein kinase with essential properties in some FGFR1-dependent cancer cell lines as well as auxiliary, synthetic lethal properties in the context of FGFR inhibitors in other cell lines. In sum, our findings identify MTOR as a protein kinase that contributes to the intrinsic sensitivity of cancer cells to FGFR TKIs such that combined treatment with MTOR inhibitors and FGFR TKIs elicits synergistic growth inhibition. Thus, direct MTOR kinase inhibitors are attractive agents to consider combining with FGFR-specific TKIs for treatment of FGFR1-dependent lung cancers and HNSCCs.
MATERIALS AND METHODS
Cell Culture
All cancer cell lines used in this study were submitted to fingerprint analysis by the University of Colorado Cancer Center DNA Sequencing and Analysis Core to confirm their authenticity. Cell lines were routinely cultured in Roswell Park Memorial Institute-1640 (RPMI-1640) growth medium (Invitrogen, Carlsbad, CA) supplemented with 10% fetal bovine serum (FBS) with 1% penicillin-streptomycin (Sigma-Aldrich, St. Louis, MO) at 37°C in a humidified 5% CO2 incubator.
Lentivirus Preparation
The Human Kinase TRC shRNA library (obtained from the Functional Genomics Shared Resource within the University of Colorado Cancer Center) was packaged in 293T cells as follows. 293T cells were incubated overnight at 37°C in a 5% CO2 humidified incubator with Turbofect transfection reagent, 5.0 μg pΔ8.9, 5.0 μg pCMV-VSV-G and 3.0 μg kinome library. The virus-containing media from the 293T cells was then filtered through a 0.45 μm filter after adding 1μg/mL polybrene and either used immediately as described or stored at 4°C until ready for use. In experiments where MTOR was validated as an essential or synthetic lethal kinase, two MTOR shRNAs in the pLKO.2 lentiviral vector (TRCN0000332888 and TRCN0000363722) distinct from those shRNAs included in the library or an shRNA targeting GFP as a negative control were packaged with the pCMV-VSV-G and pΔ8.9 component vectors. The virus was titered on NIH3T3 fibroblasts and the effect on cell growth was measured by clonogenic growth assay as described.
Functional Genomics Screens
In Vitro and In Vivo Growth Assays
Clonogenic and anchorage-independent growth assays
To measure the effect of inhibitors or shRNA-mediated knock down on cell growth, cells were seeded at 100 cells per well in six well tissue culture plates in full media. After 24 hrs, cells were treated as indicated and cultured for 14 days with the addition of fresh media containing inhibitors every 7 days. Plates were rinsed twice with phosphate buffered saline (PBS), fixed and stained with a solution of 0.5% (wt/vol) crystal violet in 6.0% (vol/vol) gluteraldehyde for 30 min at room temperature. Plates were rinsed in distilled H2O and photographed. For measurement of anchorage-independent growth in soft agar, 20,000 cells were suspended in 1.5 mL media and 0.35% noble agar and overlaid on base layers containing 1.5mL media and 0.5% noble agar in 6-well plates. Wells overlaid with 2 mL media containing drugs were fed once a week and allowed to grow for 14 to 21 days. Viable colonies were stained for 24 hrs with 250μL 1mg/mL nitroblue tetrazolium. Digital photographs of both clonogenic and soft agar wells were used to quantify total colony area by Metamorph imaging software (Molecular Devices, Downingtown, PA).
Cell Proliferation Assay
Cells were plated at 100 cells per well in 96 well tissue culture plates and treated with inhibitors at various doses. When the DMSO-treated control wells became confluent (1–2 weeks), cell numbers were assessed using a CyQUANT Direct Cell Proliferation Assay (Invitrogen) according to the manufacturer’s instructions.
Xenograft Tumor Studies
H1581 and Colo699 cells were suspended in 50% Matrigel/phosphate-buffered saline at 10 million cells per mL and 1 million cells were injected subcutaneously in both flanks of female nu/nu mice according to protocols approved by the University of Colorado Institutional Animal Care and Use Committee. When at least one of the tumors reached a volume of 100 mm3, the mice were randomized into treatment groups (n=9–10/group) of diluent control (1% Polysorbate 80), AZD4547 (12.5 mg/kg), AZD2014 (10 mg/kg) or both AZD4547 and AZD2014. Drugs were delivered daily by oral gavage (~0.25 mL/mouse). Peak plasma levels of AZD4547 following similar dosing are ~1–2 μM (15). Also, a total Cmax of 11 μM (free Cmax of 0.51 μM) is achieved 30 minutes after a single 10 mg/kg dose of AZD2014 (S. Cosulich, AstraZeneca, unpublished data). Tumor volumes were determined by caliper measurements of the long and short diameter performed twice per week using the modified ellipsoid formula for volume, V=1/2(Length×Width2). Mice were euthanized when tumors reached a volume greater than 2 cm3 or they exhibited signs of morbidity specified in the IACUC protocol.
Immunoblot Analyses
Phospho-ERK, total ERK, phospho-AKT S473, total AKT, p-p70S6K T389, total p70S6K, p-S6 S235/236, total S6, p-Rictor T1135, total Rictor, MTOR and PARP1 were measured by immunoblotting using antibodies obtained from Cell Signaling Technology, Inc. (Danvers, MA). Aliquots of cell extracts prepared in lysis buffer (0.5% Triton X-100, 50 mM β-glycerophosphate (pH 7.2), 0.1 mM Na3VO4, 2 mM MgCl2, 1 mM EGTA, 1mM DTT, 0.3 M NaCl, 2 μg/mL leupeptin and 4 μg/mL aprotinin) were submitted SDS-PAGE. After electrophoretic transfer to nitrocellulose, filters were blocked in 3% bovine serum albumin (BSA; Cohn Fraction V, ICN Biomedicals, Inc., Aurora, OH) in Tris-buffered saline with 0.1% Tween 20 (TTBS). The filters were then incubated overnight at 4°C with antibodies, washed three times in TTBS and incubated for one hour at room temperature with alkaline phosphatase coupled goat anti-rabbit antibodies. The filters were developed using Luminata Classico substrate (Millipore Corporation, Billerica, MA) according to the manufacturer’s instructions. When blotting phosphorylated proteins, the filters were stripped and probed for the corresponding total signaling enzyme level or Na/K-ATPase α-subunit (Santa Cruz Biotechnology, Inc., Santa Cruz, CA) as a loading control.
Caspase 3 Assay
H1581 cells were plated at 200,000 cells per well in six well tissue culture plates in full media. After 24 hrs, cells were treated with DMSO, 300 nM AZD4547, 100 nM AZD8055, or combination in triplicate and cultured for 3 days. Cells were harvested and Caspase 3 Activity was assessed using the CASPASE-3 Cellular Activity Assay Kit PLUS (Enzo Life Sciences, Inc., Farmingdale, NY) according to the manufacturer’s instructions.
Chemicals
Ponatinib was obtained by material transfer agreement from Ariad Pharmaceuticals, Inc. (Cambridge, Massachusetts). AZD4547 and AZD2014 were obtained by material transfer agreement from AstraZeneca (Alderley Park, UK). AZD8055, GSK690693 and MK2206 were purchased from Selleck Chemicals (Houston, TX). Stocks of the drugs were prepared in DMSO at concentrations such that the final concentration of DMSO was 0.1% v/v.
RESULTS
A functional genomics-based synthetic lethal screen with a kinome shRNA library identifies MTOR as a collaborator with FGFR1
Our recent studies demonstrate through molecular and pharmacological approaches an autocrine role for non-mutated FGFR1 in multiple cancers including lung cancer, malignant mesothelioma and HNSCC (1,2,6,8). Based on precedent from monotherapy with TKIs in other oncogene-driven lung cancers including those bearing mutant EGFR or rearranged ALK (10,11,13), intrinsic and/or acquired resistance mechanisms are predicted to limit the clinical response of FGFR inhibitors as well. To screen for signal pathways whose activity reduces intrinsic sensitivity of lung cancer cell lines to FGFR inhibitors, we performed functional genomics-based synthetic lethal screens with a kinome-targeting shRNA library (see Materials and Methods) and lung cancer cell lines exhibiting high sensitivity (Colo699, H520, H1703) and moderate/low sensitivity (H1299, H157) to ponatinib (Table 1 and (2)). While ponatinib is a multi-kinase inhibitor with IC50 values ranging from 0.2–8 nM on ABL and SRC family kinases, FGFR1, 2 and 4, PDGFRs, VEGFRs and RET (16), our recent studies in lung cancer and mesothelioma cell lines indicate that sensitivity to the TKI is closely associated with FGFR1 expression and function (2,8). The cell lines were transduced with lentiviruses encoding the kinome-targeting shRNAs in the pLKO.1 vector at a multiplicity of infection <1. Following selection for puromycin resistance which eliminates non-transduced cells and cells expressing a shRNA targeting an essential gene, the cells were treated with or without ponatinib for 3 days followed by an additional 3 days of culture in medium lacking the drug. The shRNAs were amplified from genomic DNA by PCR and submitted to massively parallel deep sequencing and the reads were analyzed by BiNGS!SL-seq (17) to determine the count frequency of the individual shRNAs in the control and treated samples. Kinase genes that are synthetic lethal (SL) with respect to ponatinib treatment are defined herein by significantly decreased shRNA counts in the treated samples with at least 2 independent shRNAs.
TABLE 1.
Ponatinib, AZD4547 and AZD8055 sensitivity of lung and HNSCC cell lines
| Cell Line | Tissue and histology | Ponatinib IC50 (nM) | AZD4547 IC50 (nM) | AZD8055 IC50 (nM) | AZD2014 IC50 (nM) |
|---|---|---|---|---|---|
| H520 | Lung squamous cell carcinoma | 53 | 57 | 23 | 21 |
| Colo699 | Lung adenocarcinoma | 14 | 6 | 61 | 4 |
| H1703 | Lung adenosquamous carcinoma | 24 | 460 | 60 | 8 |
| CCL30 | Nasopharynx, squamous cell carcinoma | ND | 9 | 66 | ND |
| H1581 | Lung large cell carcinoma | 1 | 2 | 78 | 40 |
| H1299 | Lung large cell carcinoma | 140 | >1000 | 178 | 25 |
| H157 | Lung squamous cell carcinoma | 119 | >1000 | 632 | 210 |
| 584-A2 | Larynx, squamous cell carcinoma | ND | 6 | >1000 | ND |
The tissue source and histology of the cancer cell lines used in the studies is summarized. The sensitivity of the cell lines to ponatinib is from (2). The sensitivities of the cell lines to the FGFR inhibitor, AZD4547, and the MTOR inhibitor, AZD8055, were determined with clonogenic or anchorage-independent growth assays using drug concentrations from 0 – 1 μM. The sensitivity of the cell lines to AZD2014 was measured using cell proliferation assays and the CyQUANT reagent over drug concentrations from 0 – 1 μM. The primary data for AZD8055 sensitivity on six of the cell lines are shown in Figure 2C and the IC50 values were calculated with the Prism software program.
The functional genomics analysis identified MTOR as the top-ranking SL hit in both H157 and H1299 cells, but not in the more ponatinib-sensitive H520 and H1703 cells (Table S2) or Colo699 cells (data not shown). To validate MTOR as a synthetic lethal gene with respect to ponatinib in H157 and H1299 cells, lentiviral-encoded shRNAs distinct from those used in the kinome shRNA library were transduced into H157 and H1299 cells. As shown in Figure 1A, both MTOR-targeting shRNAs reduced MTOR protein levels relative to a non-silencing control shRNA targeting GFP. While MTOR silencing, alone, exerted little or no effect on clonogenic growth of H157 or H1299 cells, enhanced growth inhibition by ponatinib upon MTOR knockdown was observed in both cell lines (Fig. 1B–D). Finally, treatment of H157 cells with ponatinib and the MTOR inhibitor, AZD8055 (18), yielded significantly greater clonogenic growth inhibition than ponatinib alone (Fig. S3). These results validate MTOR as a synthetic lethal gene with ponatinib.
Figure 1. Validation of MTOR as a synthetic lethal gene with FGFR inhibition by RNAi-mediated knockdown.

A, H157 and H1299 cells were transduced with either a negative control shRNA targeting GFP, or one of two independent MTOR targeting shRNAs (TRCN0000363722 or TRCN0000332888), henceforth abbreviated as MTOR 22 and MTOR 88, respectively. Cells were selected for resistance to puromycin and resulting colonies were harvested and immunoblotted for MTOR protein levels. The protein level of the α-subunit of Na/K-ATPase was measured as a loading control. B, As in A except H157 cells were treated with 300 nM ponatinib or DMSO at the time of puromycin selection. Resulting colonies were stained with crystal violet and photographed. A representative well of three replicates is shown. Mean total colony area (± SEM, n=3) for the indicated shRNA transductions and ponatinib treatments were quantified as described in the Materials and Methods and the data are graphically presented for H157 (C) and H1299 cells (D), respectively.
MTOR is an essential gene in multiple FGFR1-dependent cancer cell lines
MTOR was not identified as a synthetic lethal protein kinase in H520, H1703 or Colo699 cells (Table S2 and data not shown). Because the synthetic lethal screen format (see Figure S1) eliminates shRNAs targeting essential kinases due to the selection for stable puromycin resistant cells, it is possible that MTOR shRNAs were eliminated from the transduced cell population in Colo699, H520 and H1703 cells. We performed an essential kinase screen in FGFR1-dependent Colo699 lung adenocarcinoma cells and FGFR1-dependent 584-A2 HNSCC cells (see Supplementary Materials and Methods). The count frequency of multiple MTOR shRNAs was determined 2 and 7 days post-transduction by sequencing of amplified shRNAs and the results are presented graphically in Figure 2A. Five of six independent MTOR-targeting shRNAs were eliminated from the pool of recovered shRNAs in Colo699 cells 7 days post-transduction. By contrast, none of the six shRNAs were eliminated from 584-A2 cells after 7 days of incubation. Thus, the results are consistent with an essential role of MTOR in Colo699 cells, but not 584-A2 cells. The essential function of MTOR in Colo699 cells was further validated with two shRNA distinct from those used in the kinome library where strong reduction of clonogenic growth resulted from transduction of MTOR shRNAs relative to the GFP targeting shRNA control (Fig. 2B).
Figure 2. MTOR is an essential kinase in Colo699 cells.

An essential kinase screen was performed with the kinome shRNA lentiviral library as described in the Materials and Methods. In A, the count frequencies following Illumina sequencing of six MTOR targeting shRNAs is presented for Colo699 and 584-A2 cells. The findings show loss of five of the six MTOR shRNAs by 7 days of culture in Colo699 cells, but not 584-A2 cells. B, Colo699 cells were transduced with either a negative control shRNA targeting GFP, or one of two independent MTOR targeting shRNAs (MTOR 22 or MTOR 88). Cells were selected for resistance to puromycin and resulting colonies following 2 weeks of culture were stained with crystal violet and total colony area was quantified. C, The indicated cell lines and others noted in Table 1 were submitted to clonogenic growth assays (see Materials and Methods) with 0 – 1 μM AZD8055. After ~ 2 weeks, the colonies were fixed and stained with crystal violet and total colony area was quantified. The IC50 values were calculated with the Prism software program and presented in Table 1.
As a pharmacological approach to define the relative requirement of MTOR for growth and survival in FGFR1-dependent cancer cell lines, clonogenic cell growth was measured in a panel of cell lines in the presence of increasing concentrations of AZD8055. AZD8055, and the congener, AZD2014, are highly selective for MTOR in either the TORC1 or TORC2 complexes, with little activity on other members of the phosphatidylinositol kinase superfamily (18). In clonogenic/anchorage-independent growth assays, H157 and 584-A2 cells exhibited low sensitivity (IC50 >600 nM) and H1299 cells intermediate sensitivity (IC50 ~180 nM) to AZD8055 (Figure 2C and Table 1). By contrast, Colo699, H520 and H1703 as well as the FGFR1-dependent lung cancer cell line, H1581, and the HNSCC cell line, CCL30, were uniformly sensitive to AZD8055 with IC50 values <80 nM. This rank order of sensitivity among the cancer cell lines to AZD8055 was confirmed with a cell proliferation assay (Fig. S4) and was similar to that observed with AZD2014 (Table 1). The panel of cell lines was very sensitive to the TORC1-specific inhibitor, rapamycin, although little or no difference in relative sensitivity between the cell lines was observed with IC50 values ranging from 0.3 to 2 nM (Fig. S5). Combined, the studies indicate that FGFR1-dependent lung cancer and HNSCC cell lines exhibit variable degrees of MTOR dependency for growth and survival and explains the observation that MTOR was not identified as synthetic lethal with ponatinib in Colo699, H520 and H1703 cells because it exerts an essential function in these cell lines relative to H157 and H1299 cells.
Synergistic growth inhibition by FGFR and MTOR inhibitors in Colo699 and H1581 cells
Despite the range of MTOR dependencies measured in the panel of cancer cell lines, we tested whether FGFR and MTOR inhibitors might still yield additive or synergistic growth inhibition in cell lines even when MTOR exhibits an essential phenotype. As shown in Figure S6, combination treatment with either ponatinib or AZD4547, a specific FGFR1,2,3 inhibitor (15), and AZD8055 resulted in significantly greater clonogenic growth inhibition relative to FGFR inhibitor, alone, in Colo699, H1703 and H520 cells. To rigorously test for synergistic growth inhibition resulting from simultaneous blockade of FGFR1 and MTOR, FGFR1-dependent lung cancer cell lines (H1581, Colo699) or an HNSCC cell line (CCL30) exhibiting high sensitivity to AZD8055 (Table 1), were treated in a 96-well plate format (see Materials and Methods) with multiple concentrations of AZD4547, alone and in combination with the MTOR inhibitor, AZD8055. The effects on cell growth measured by the CyQUANT assay are shown in Figure 3 and S7 and analysis of the resulting data by the method of Chou and Talalay (19) revealed synergistic growth inhibition over multiple concentrations of the two drugs. The greater than additive growth inhibition by combined AZD4547 and AZD8055 was confirmed with the distinct MTOR inhibitor, AZD2014 (18), in H1581, Colo699 and 584-A2 cells (Fig. 4) and with rapamycin and AZD4547 in Colo699 and H1581 cells (Fig. S8). Thus, the identification of MTOR as a synthetic lethal pathway with FGFR1 is observed pharmacologically in multiple FGFR1-dependent cancer cell lines.
Figure 3. Synergistic growth inhibition of H1581 and Colo699 cells by AZD4547 and AZD8055.

The indicated cell lines were seeded at 100 cells/well in 96-well plates. The next day, the growth medium was replaced with 100 μL medium containing the indicated combinations of AZD4547 and AZD8055 in triplicate and incubation was continued for ~10–14 days. The medium and drugs were replaced every 7 days. Cell growth was assessed with the CyQUANT reagent as described in the Materials and Methods and the mean fluorescence (n=3) for each treatment is plotted on the y-axis. The data were submitted to further analysis with the Calcusyn program for determination of the degree of synergy achieved by the combinations relative to the monotherapy treatments. The resulting CI values are tabulated below and the degree of synergy indicated.
Figure 4. AZD4547 and MTOR inhibitor, AZD2014, alone and combined on growth of H1581 and Colo699 cells.
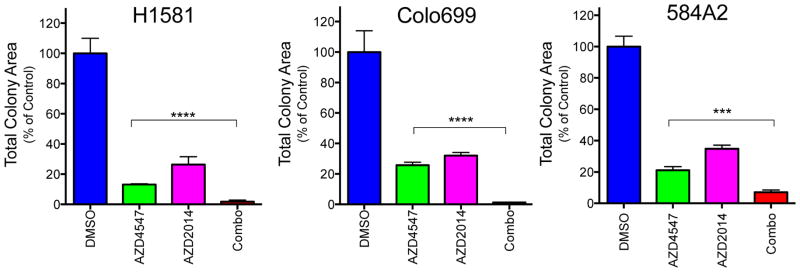
H1581, Colo699 and 584-A2 cells were submitted to anchorage-independent growth assays with 100 nM (H1581) or 300 nM (Colo699, 584-A2) AZD4547 with or without 100 nM AZD2014. After 14–21 days, viable colonies were stained with NBT and total colony area was measured as described in the Materials and Methods. The data were normalized to DMSO control treatments and are the means and SEM (n=3) where **** indicates p<0.0001.
To explore the mechanism by which simultaneous inhibition of FGFR1 and MTOR yield synergistic growth inhibition, the activity of signaling pathways known to be regulated by these protein kinases was monitored by immunoblot analyses. Figure 5A reveals that AZD4547 inhibited ERK phosphorylation, but had little or no effect on phosphorylation of the TORC2 site (S473) of AKT in H1581 and Colo699 cells. Additionally, none of the TORC1 targets (p70S6K, S6, Rictor) showed altered phosphorylation by FGFR1 inhibition with AZD4547. By contrast, AZD8055 inhibited phosphorylation of AKT-Ser473, p70S6K, S6 and Rictor, but not phosphorylation of ERK (Fig. 5A). Finally, combined AZD4547 and AZD8055 treatment inhibited phosphorylation of ERKs and multiple targets of TORC1 and TORC2, consistent with the functioning of an RTK co-activation network (14) in which MTOR is regulated in parallel, not distal to FGFR1. These results are also observed with rapamycin and AZD4547 except that no inhibition of AKT Ser473 phosphorylation is observed (Fig. S9). Dual blockade of FGFR1 and MTOR, but not inhibition of either target alone, induced PARP1 cleavage in H1581 cells as measured by immunoblot analysis, suggesting the induction of apoptosis with the combination inhibitor treatment (Fig. 5B). As an independent biochemical measure of apoptosis, the activity of caspase 3 was assayed in extracts from H1581 cells similarly treated. Figure 5C shows a ~5 fold increase in caspase 3 activity in cells treated with combined AZD4547 and AZD8055 relative to control cells or cells treated with the single agents.
Figure 5. Signal pathway inhibition and apoptosis induction by AZD4547 and AZD8055 alone, and in combination.

A, H1581 and Colo699 cells were incubated with 0.1% DMSO as a control, AZD4547 (300 nM), AZD8055 (100 nM) or the combination of the two drugs for 2 hours as described in the Materials and Methods. Cell extracts were prepared and submitted to immunoblot analyses for the indicated signaling intermediates. Phospho-AKT (S473) is a measure of TORC2 activity while phospho-p70S6K (T389), phospho-S6 (S235/236) and phospho-Rictor (T1135) are measures of activity through the TORC1 pathway. The filters were stripped and reprobed for total ERK, AKT, p70S6K, S6 and Rictor to insure equal loading of cell protein in each lane. B, H1581 cells were treated for 3 days with 0.1% DMSO as a control, AZD4547 (300 nM), AZD8055 (100 nM) or the combination of the two drugs. Cell extracts were prepared and submitted to immunoblot analysis of PARP1 and the α-subunit of the NaK-ATPase as a loading control. The cleavage product of PARP1 is indicated. C, Cell extracts from H1581 cells treated 3 days with 0.1% DMSO, AZD4547 (300 nM), AZD8055 (100 nM) or the combination of the two drugs were submitted to a caspase 3 enzymatic assay as described in the Materials and Methods. The data are the initial rates of the assays in triplicate determinations. Caspase 3 activity in combination-treated cells is significantly different (p<0.0005) from activity in either monotherapy-treated extracts.
It is noteworthy that neither AKT1, 2 nor 3 were identified as high-ranking hits in the synthetic lethal screens (Table S2), despite the findings in Figure 5 showing marked inhibition of AKT phosphorylation by MTOR kinase inhibitors. It is possible that functional redundancy occurs among the distinct AKT gene products such that silencing of any one AKT gene fails to exert a phenotype. We tested the ability of two AKT inhibitors, MK2206 (20) and GSK690693 (21) to exert synergistic growth inhibition with FGFR inhibitors. The sensitivity of Colo699 cells to these AKT inhibitors is shown in Figure S10A and indicates only modest sensitivity to the single agents. As shown in Figures S10B and S11, strong synergy of MK2206 and ponatinib in Colo699 cells and GSK690693 and ponatinib in H1581 cells was observed. Thus, the findings in Figures 3–5 and S10–11 support the parallel activation of the MTOR-AKT signaling pathway as a modulator of the intrinsic sensitivity of multiple FGFR1-dependent cancer cell lines to FGFR TKIs.
Enhanced tumor growth inhibition by combination AZD4547 and AZD2014 in flank xenograft assays
H1581 and Colo699 cells were implanted in the flanks of female nu/nu mice as described in the Materials and Methods. When the tumors reached ~100 mm3, the mice were randomized into treatment groups; diluent control, AZD4547 (12.5 mg/kg), AZD2014 (10mg/kg) or the combination of both drugs. As shown in Figure 6B and C, treatment of flank H1581 tumors with either AZD4547 or AZD2014 alone yielded little growth inhibition relative to diluent control (Fig. 6A). In fact, the modest effect of AZD4547 monotherapy is surprising considering the potency with which this cell line is inhibited by AZD4547 in vitro (Fig. 3 and Table 1). However, in combination, AZD4547 and AZD2014 yielded significant tumor growth inhibition (Fig. 6D and E) and significantly prolonged survival (Fig. 6F), consistent with the synergistic growth inhibition observed in vitro. Similar relative activities of AZD4547 and AZD2014 as monotherapies, and in combination were observed following treatment of flank Colo699 xenografts (Figure S12A–F), although the survival benefit afforded by the combination therapy was not statistically significant (p=0.06).
Figure 6. Combination AZD4547 and AZD2014 provides superior growth inhibition of H1581 xenografts.

Flank xenografts derived from H1581 cells were generated as described in the Materials and Methods. When the tumors reached 100 mm3, the mice were randomized to treatment by daily oral gavage with diluent (A), 12.5 mg/kg AZD4547 (B), 10 mg/kg AZD2014 (C) or combined AZD4547 and AZD2014 (D). The individual tumor volumes relative to their initial volumes are shown for the different treatment groups. The average fold change in tumor volume among the groups after 2 weeks of treatment is shown in E and reveals significantly greater growth inhibition by the combination relative to either monotherapy. F, Kaplan-Meier survival curve analysis of the mice in the 4 groups demonstrates significantly longer survival (p=0.0002) with combination therapy relative to the mice treated with diluent or the monotherapies.
DISCUSSION
Using an unbiased RNAi screen, our study highlights MTOR as an actionable protein kinase that can be targeted in combination with FGFR1 to achieve synergistic growth inhibition in FGFR1-dependent cancer cell lines. The molecular basis for the synergism appears to involve the collapse of a greater signaling network by the combination therapy than that achieved by either FGFR1 or MTOR inhibition alone. The findings in Figure 5 support the dominant regulation of the ERK pathway downstream of FGFR1 and activation of TORC1 targets (p70S6K and S6) and TORC2 targets (pAKT S473) by MTOR. Moreover, this rationally derived combination of MTOR inhibitors with FGFR inhibitors is consistent with an extensive literature demonstrating benefit of adding MTOR inhibitors to various targeted therapeutics. For example, a rapamycin analog increased growth inhibition by ponatinib in FGFR2-driven endometrial cancer cell lines (22) and combining a dual PI3K-MTOR inhibitor with TKIs active on BCR-ABL yielded increased growth inhibition of CML cell lines (23). Combination of a BTK inhibitor with the MTOR inhibitor, AZD2014, induced synergistic killing of diffuse large B cell lymphoma cells (24) and the benefit of combining IGF inhibitors with MTOR inhibitors for reducing growth of Ewing sarcoma cell lines has been documented (25). The generality of the synergistic growth suppression achieved with addition of MTOR inhibitors indicates the degree to which MTOR participates in cancer signaling networks.
The identification of MTOR as a synthetic lethal protein kinase in the setting of ponatinib treatment of H157 and H1299 cells as well as the ability of AZD8055 and AZD2014 to synergize with AZD4547 in Colo699 and H1581 cells supports a model where MTOR signals in parallel with, not downstream of FGFR1. In this regard, our results are consistent with the existence of receptor tyrosine kinase (RTK) co-activation networks as reviewed by Xu and Huang where the ERK pathway distal to FGFR1 and MTOR represent distinct fragile points (14). The ability of the MEK inhibitor, selumetinib, to synergize with the MTOR inhibitor, AZD8055, supports this hypothesis (26). The identification of receptors or RTKs that reside upstream of MTOR in FGFR1-dependent cancer cells remains to be defined. Also, MTOR exists within two distinct signaling complexes, TORC1 and TORC2 (27) and the identity of the precise complex mediating the synthetic lethal and essential activities measured in our study were not resolved. The kinome shRNA library lacked shRNAs to Raptor and Rictor that would distinguish TORC1 and TORC2 and specific silencing of Rictor or Raptor yielded equivocal results (data not shown). A likely scenario is that both complexes participate in growth regulation in lung and HNSCC cells and clearly, both TORC1 and TORC2 are inhibited by AZD8055 and AZD2014 (18). Also, rapamycin strongly inhibited growth (Figs. S5 and S8), supporting the critical involvement of TORC1. It is noteworthy that AKT1, 2 or 3 were not high-ranking hits in the screens, although redundancy among the three gene products could preclude identification of any with our RNAi-based approach. Like MTOR inhibitors, two independent AKT inhibitors synergized with ponatinib for growth inhibition of multiple cell lines (Figure S10 and S11), providing support for AKT as at least one important target of MTOR in these cancer cells.
In light of the potent in vitro sensitivity of Colo699 and H1581 cells to FGFR TKIs (Figs. 3 and 4), we were surprised by the modest degree of growth inhibition achieved with AZD4547 alone when these cell lines were propagated as flank xenografts in nu/nu mice (Fig. 6, Fig. S12). Still, this degree of growth inhibition is not inconsistent with the early results of clinical trials of AZD4547 and BGJ398 in squamous cell lung cancer where only partial responses have been observed thus far in less than 20% of patients (28,29). Based on our present studies showing strong in vivo responses with flank xenografts that are limited to combination treatment with AZD4547 and AZD2014, we wonder if targeting auxiliary pathways such as MTOR will be required to observe significant clinical responses in FGFR1-dependent lung cancers and HNSCCs. If so, it is important that FGFR1 not be immediately abandoned as a therapeutic target in these settings based solely on a marginal clinical response to FGFR TKI monotherapy. While the frequent and profound tumor shrinkage responses observed in lung cancers bearing mutant EGFR or rearranged ALK treated with TKI monotherapies have established a new expectation for clinical responsiveness, we hypothesize that cancers driven by non-mutated drivers like FGFR1 may inherently depend more on RTK co-activation networks for full transforming potential (14). Admittedly, clinical investigation of combination therapies is unwieldy relative to monotherapy and bears increased concern of drug toxicity. Still, the fact that many lung cancers and the majority of HNSCC will present with non-mutated oncogene drivers necessitates careful consideration of combination therapies as a starting point in treatment design.
Supplementary Material
Acknowledgments
We thank the Next-Generation Sequencing Production Core and staff within the University of Colorado School of Medicine, Department of Biochemistry & Molecular Genetics for expert assistance with the Illumina Genome Analyzer II sequencing of the kinome shRNA library. In addition, we acknowledge AstraZeneca for the supply of AZD4547 and AZD2014 as well as ARIAD Pharmaceuticals for the supply of ponatinib.
GRANT SUPPORT
The studies were supported by the NIH (Lung SPORE P50 CA58187, UC Cancer Center Support Grant P30 CA046934) and the VA (Merit Award 1BX001994-01).
Footnotes
Disclosure of Potential Conflicts of Interest: L. Heasley is the recipient of a research contract from ARIAD Pharmaceuticals, Inc.
AUTHOR’S CONTRIBUTIONS
Conception and design: L. Heasley, K. Singleton, A.C. Tan
Development of methodology: K. Singleton, J. Kim, A.C. Tan
Acquisition of data: K. Singleton, T. Hinz, E. Kleczko, L. Marek, J. Kwak, J. Kim, T. Harp
Analysis and interpretation of data: K. Singleton, T. Hinz, E. Kleczko, L. Marek, J. Kwak, J. Kim, A.C. Tan, L. Heasley
Writing, review and/or revision of the manuscript: L. Heasley, K. Singleton
References
- 1.Marek L, Ware KE, Fritzsche A, Hercule P, Helton WR, Smith JE, et al. Fibroblast growth factor (FGF) and FGF receptor-mediated autocrine signaling in non-small-cell lung cancer cells. Molecular pharmacology. 2009;75(1):196–207. doi: 10.1124/mol.108.049544. [DOI] [PMC free article] [PubMed] [Google Scholar]
- 2.Wynes MW, Hinz TK, Gao D, Martini M, Marek LA, Ware KE, et al. FGFR1 mRNA and protein expression, not gene copy number, predict FGFR TKI sensitivity across all lung cancer histologies. Clinical cancer research. 2014;20(12):3299–309. doi: 10.1158/1078-0432.CCR-13-3060. [DOI] [PMC free article] [PubMed] [Google Scholar]
- 3.Harding TC, Long L, Palencia S, Zhang H, Sadra A, Hestir K, et al. Blockade of nonhormonal fibroblast growth factors by FP-1039 inhibits growth of multiple types of cancer. Sci Transl Med. 2013;5(178):178ra39. doi: 10.1126/scitranslmed.3005414. [DOI] [PubMed] [Google Scholar]
- 4.Dutt A, Ramos AH, Hammerman PS, Mermel C, Cho J, Sharifnia T, et al. Inhibitor-sensitive FGFR1 amplification in human non-small cell lung cancer. PloS one. 2011;6(6):e20351. doi: 10.1371/journal.pone.0020351. [DOI] [PMC free article] [PubMed] [Google Scholar]
- 5.Weiss J, Sos ML, Seidel D, Peifer M, Zander T, Heuckmann JM, et al. Frequent and focal FGFR1 amplification associates with therapeutically tractable FGFR1 dependency in squamous cell lung cancer. Sci Transl Med. 2010;2(62):62ra93. doi: 10.1126/scitranslmed.3001451. [DOI] [PMC free article] [PubMed] [Google Scholar]
- 6.Marshall ME, Hinz TK, Kono SA, Singleton KR, Bichon B, Ware KE, et al. Fibroblast growth factor receptors are components of autocrine signaling networks in head and neck squamous cell carcinoma cells. Clinical cancer research. 2011;17(15):5016–25. doi: 10.1158/1078-0432.CCR-11-0050. [DOI] [PMC free article] [PubMed] [Google Scholar]
- 7.Goke F, Bode M, Franzen A, Kirsten R, Goltz D, Goke A, et al. Fibroblast growth factor receptor 1 amplification is a common event in squamous cell carcinoma of the head and neck. Modern pathology. 2013;26(10):1298–306. doi: 10.1038/modpathol.2013.58. [DOI] [PubMed] [Google Scholar]
- 8.Marek LA, Hinz TK, von Massenhausen A, Olszewski KA, Kleczko EK, Boehm D, et al. Nonamplified FGFR1 Is a Growth Driver in Malignant Pleural Mesothelioma. Molecular cancer research. 2014;12(10):1460–9. doi: 10.1158/1541-7786.MCR-14-0038. [DOI] [PMC free article] [PubMed] [Google Scholar]
- 9.Gozgit JM, Wong MJ, Moran L, Wardwell S, Mohemmad QK, Narasimhan NI, et al. Ponatinib (AP24534), a multitargeted pan-FGFR inhibitor with activity in multiple FGFR-amplified or mutated cancer models. Molecular cancer therapeutics. 2012;11(3):690–9. doi: 10.1158/1535-7163.MCT-11-0450. [DOI] [PubMed] [Google Scholar]
- 10.West H, Oxnard GR, Doebele RC. Acquired resistance to targeted therapies in advanced non-small cell lung cancer: new strategies and new agents. American Society of Clinical Oncology educational book / ASCO American Society of Clinical Oncology Meeting; 2013. [DOI] [PMC free article] [PubMed] [Google Scholar]
- 11.Doebele RC, Pilling AB, Aisner DL, Kutateladze TG, Le AT, Weickhardt AJ, et al. Mechanisms of resistance to crizotinib in patients with ALK gene rearranged non-small cell lung cancer. Clinical cancer research : an official journal of the American Association for Cancer Research. 2012;18(5):1472–82. doi: 10.1158/1078-0432.CCR-11-2906. [DOI] [PMC free article] [PubMed] [Google Scholar]
- 12.Glickman MS, Sawyers CL. Converting cancer therapies into cures: lessons from infectious diseases. Cell. 2012;148(6):1089–98. doi: 10.1016/j.cell.2012.02.015. [DOI] [PMC free article] [PubMed] [Google Scholar]
- 13.Garraway LA, Janne PA. Circumventing cancer drug resistance in the era of personalized medicine. Cancer discovery. 2012;2(3):214–26. doi: 10.1158/2159-8290.CD-12-0012. [DOI] [PubMed] [Google Scholar]
- 14.Xu AM, Huang PH. Receptor tyrosine kinase coactivation networks in cancer. Cancer research. 2010;70(10):3857–60. doi: 10.1158/0008-5472.CAN-10-0163. [DOI] [PMC free article] [PubMed] [Google Scholar]
- 15.Gavine PR, Mooney L, Kilgour E, Thomas AP, Al-Kadhimi K, Beck S, et al. AZD4547: an orally bioavailable, potent, and selective inhibitor of the fibroblast growth factor receptor tyrosine kinase family. Cancer research. 2012;72(8):2045–56. doi: 10.1158/0008-5472.CAN-11-3034. [DOI] [PubMed] [Google Scholar]
- 16.O’Hare T, Shakespeare WC, Zhu X, Eide CA, Rivera VM, Wang F, et al. AP24534, a pan-BCR-ABL inhibitor for chronic myeloid leukemia, potently inhibits the T315I mutant and overcomes mutation-based resistance. Cancer cell. 2009;16(5):401–12. doi: 10.1016/j.ccr.2009.09.028. [DOI] [PMC free article] [PubMed] [Google Scholar]
- 17.Kim J, Tan AC. BiNGS!SL-seq: a bioinformatics pipeline for the analysis and interpretation of deep sequencing genome-wide synthetic lethal screen. Methods in molecular biology. 2012;802:389–98. doi: 10.1007/978-1-61779-400-1_26. [DOI] [PubMed] [Google Scholar]
- 18.Pike KG, Malagu K, Hummersone MG, Menear KA, Duggan HM, Gomez S, et al. Optimization of potent and selective dual mTORC1 and mTORC2 inhibitors: the discovery of AZD8055 and AZD2014. Bioorganic & medicinal chemistry letters. 2013;23(5):1212–6. doi: 10.1016/j.bmcl.2013.01.019. [DOI] [PubMed] [Google Scholar]
- 19.Chou TC. Drug combination studies and their synergy quantification using the Chou-Talalay method. Cancer research. 2010;70(2):440–6. doi: 10.1158/0008-5472.CAN-09-1947. [DOI] [PubMed] [Google Scholar]
- 20.Hirai H, Sootome H, Nakatsuru Y, Miyama K, Taguchi S, Tsujioka K, et al. MK-2206, an allosteric Akt inhibitor, enhances antitumor efficacy by standard chemotherapeutic agents or molecular targeted drugs in vitro and in vivo. Molecular cancer therapeutics. 2010;9(7):1956–67. doi: 10.1158/1535-7163.MCT-09-1012. [DOI] [PubMed] [Google Scholar]
- 21.Heerding DA, Rhodes N, Leber JD, Clark TJ, Keenan RM, Lafrance LV, et al. Identification of 4-(2-(4-amino-1,2,5-oxadiazol-3-yl)-1-ethyl-7-{[(3S)-3-piperidinylmethyl]oxy}-1H-imidazo[4,5-c]pyridin-4-yl)-2-methyl-3-butyn-2-ol (GSK690693), a novel inhibitor of AKT kinase. Journal of medicinal chemistry. 2008;51(18):5663–79. doi: 10.1021/jm8004527. [DOI] [PubMed] [Google Scholar]
- 22.Gozgit JM, Squillace RM, Wongchenko MJ, Miller D, Wardwell S, Mohemmad Q, et al. Combined targeting of FGFR2 and mTOR by ponatinib and ridaforolimus results in synergistic antitumor activity in FGFR2 mutant endometrial cancer models. Cancer chemotherapy and pharmacology. 2013;71(5):1315–23. doi: 10.1007/s00280-013-2131-z. [DOI] [PubMed] [Google Scholar]
- 23.Okabe S, Tauchi T, Tanaka Y, Kitahara T, Kimura S, Maekawa T, et al. Efficacy of the dual PI3K and mTOR inhibitor NVP-BEZ235 in combination with nilotinib against BCR-ABL-positive leukemia cells involves the ABL kinase domain mutation. Cancer biology & therapy. 2014;15(2):207–15. doi: 10.4161/cbt.26725. [DOI] [PMC free article] [PubMed] [Google Scholar]
- 24.Ezell SA, Mayo M, Bihani T, Tepsuporn S, Wang S, Passino M, et al. Synergistic induction of apoptosis by combination of BTK and dual mTORC1/2 inhibitors in diffuse large B cell lymphoma. Oncotarget. 2014;5(13):4990–5001. doi: 10.18632/oncotarget.2071. [DOI] [PMC free article] [PubMed] [Google Scholar]
- 25.Zhong H, Fazenbaker C, Breen S, Chen C, Huang J, Morehouse C, et al. MEDI-573, alone or in combination with mammalian target of rapamycin inhibitors, targets the insulin-like growth factor pathway in sarcomas. Molecular cancer therapeutics. 2014;13(11):2662–73. doi: 10.1158/1535-7163.MCT-14-0144. [DOI] [PubMed] [Google Scholar]
- 26.Holt SV, Logie A, Davies BR, Alferez D, Runswick S, Fenton S, et al. Enhanced apoptosis and tumor growth suppression elicited by combination of MEK (selumetinib) and mTOR kinase inhibitors (AZD8055) Cancer research. 2012;72(7):1804–13. doi: 10.1158/0008-5472.CAN-11-1780. [DOI] [PubMed] [Google Scholar]
- 27.Laplante M, Sabatini DM. mTOR signaling in growth control and disease. Cell. 2012;149(2):274–93. doi: 10.1016/j.cell.2012.03.017. [DOI] [PMC free article] [PubMed] [Google Scholar]
- 28.Nogova L, Sequist LV, Cassier PA, Hidalgo M, Delord J-P, Schuler MH, et al. Targeting FGFR1-amplified lung squamous cell carcinoma with the selective pan-FGFR inhibitor BGJ398. Journal of clinical oncology. 2014;32(5s):abstr 8034. [Google Scholar]
- 29.Paik PK, Shen R, Ferry D, Soria J-C, Mathewson A, Kilgour E, et al. A phase 1b open-label multicenter study of AZD4547 in patients with advanced squamous cell lung cancers: Preliminary antitumor activity and pharmacodynamic data. Journal of clinical oncology. 2014;32(5s):abstr 8035. doi: 10.1158/1078-0432.CCR-17-0645. [DOI] [PMC free article] [PubMed] [Google Scholar]
Associated Data
This section collects any data citations, data availability statements, or supplementary materials included in this article.