

Abstract
We identified dynamic changes in recruitment of neural connectivity networks across three phases of a flexible rule learning and set-shifting task similar to the Wisconsin Card Sort Task: switching, rule learning via hypothesis testing, and rule application. During fMRI scanning, subjects viewed pairs of stimuli that differed across four dimensions (letter, color, size, screen location), chose one stimulus, and received feedback. Subjects were informed that the correct choice was determined by a simple unidimensional rule, for example “choose the blue letter.” Once each rule had been learned and correctly applied for 4-7 trials, subjects were cued via either negative feedback or visual cues to switch to learning a new rule. Task performance was divided into three phases: Switching (first trial after receiving the switch cue), hypothesis testing (subsequent trials through the last error trial), and rule application (correct responding after the rule was learned). We used both univariate analysis to characterize activity occurring within specific regions of the brain, and a multivariate method, constrained principal component analysis for fMRI (fMRI-CPCA), to investigate how distributed regions coordinate to subserve different processes. As hypothesized, switching was subserved by a limbic network including the ventral striatum, thalamus, and parahippocampal gyrus, in conjunction with cortical salience network regions including the anterior cingulate and frontoinsular cortex. Activity in the ventral striatum was associated with switching regardless of how switching was cued; visually cued shifts were associated with additional visual cortical activity. After switching, as subjects moved into the hypothesis testing phase, a broad fronto-parietal-striatal network (associated with the cognitive control, dorsal attention, and salience networks) increased in activity. This network was sensitive to rule learning speed, with greater extended activity for the slowest learning speed late in the time course of learning. As subjects shifted from hypothesis testing to rule application, activity in this network decreased and activity in the somatomotor and default mode networks increased.
Keywords: Shifting, functional networks, functional connectivity, reversal learning, hypothesis testing, ventral striatum, salience network, cognitive control network
The ability to flexibly change cognitive strategies and learn new rules to guide behavior is at the center of human cognitive control and is reliant on intact frontoparietal systems. One of the best clinical measurements of frontal lobe damage is the Wisconsin Card Sort Task (WCST) (Berg, 1948), which involves both rule switching and rule learning components. People with damage to the prefrontal cortex tend to perseverate on a learned rule despite negative feedback, and do not switch to and test an alternative strategy. In this study we combined univariate methods with multivariate functional connectivity analysis to test the hypothesis that switching in tasks like the WCST is subserved by a corticostriatal salience network including the ventral striatum. We also tested whether the method of informing subjects that they need to switch, through negative feedback or through a visual cue, affects activity in these neural systems. Finally, we characterized how cognitive control networks were dynamically recruited across different task phases.
1.1 Hypothesis testing, rule application, and switching
In our study we used a continuous task which involved hypothesis testing, rule application, and switching to a new rule. Previous studies using rule learning tasks have found that hypothesis formation and testing are associated with neural activity in a prefrontal-parietal-striatal network. A large number of prefrontal regions are typically recruited, including dorsolateral, inferior frontal / anterior insula, anterior prefrontal, and medial frontal regions (Crescentini et al., 2011; Hartstra et al., 2010; Landmann et al., 2007; Lie et al., 2006; Konishi et al., 1999; Seger and Cincotta, 2006). Parietal activity is typically widespread but particularly prominent in inferior parietal and intraparietal sulcus regions (Crescentini et al., 2011). Prefrontal and parietal region activity typically increases during rule learning, and then decreases after subjects have learned the rule and are correctly applying it to new stimuli. During rule application, other neural systems increase in activity including regions associated with the default network (Crescentini et al., 2011), the hippocampus and medial temporal cortex (Seger and Cincotta, 2006), the bilateral insula (Seger and Cincotta, 2006) and motor regions (Crescentini et al., 2011). Within the striatum, Seger and Cincotta (2006) reported that activity in the anterior caudate increased sharply at the beginning of each rule learning task whereas posterior caudate showed a flatter time course in which activity persisted across rule learning and into the rule application phase.
Most previous rule learning studies have trained subjects using discrete rule learning problems, and have not examined how subjects dynamically switch between rules. Studied that have examined switching have often reported activity in the basal ganglia and regions of the inferior frontal cortex and anterior cingulate sometimes termed the cingulo-opercular or salience network. Within the basal ganglia, switching is particularly strongly associated with ventral regions of the striatum, including nucleus accumbens and ventral caudate and putamen (Monchi et al., 2001;Simard et al., 2011). Seger and Cincotta (2006) reported activity in a discrete rule learning task in the ventral striatum that rose suddenly at the beginning of each rule learning task, indicating a potential role in shifting to the new problem. The ventral striatum has also been associated with switching across species in reversal learning tasks, in which the organism has only two stimuli to choose from and must switch to choosing the other stimulus (Robbins and Roberts, 2007; Dalton et al., 2014). The salience network has been associated with many of the functions necessary for switching, including shifting attention in a bottom-up fashion to behaviorally relevant stimuli and relaying this information to control systems (Sridharan et al., 2008; Uddin, 2015). Dosenbach et al (2006) found that the salience network was the only cortical area whose activity spiked at the beginning and end of instructed tasks, indicating an important role in implementing task sets and shifting to new sets. Sestieri et al (2014) found that this region had both task-general sustained activity along with increased transient activity in response to behaviorally relevant task events.
1.2 Resting state neural networks
In addition to testing hypotheses concerning neural systems underlying switching, an additional goal of our study was to characterize how regions recruited during rule learning interact during task performance, both in order to identify patterns of functional connectivity and to be able to relate these networks to those that have been identified on the basis of intrinsic connectivity during the resting state. Because of our interest in frontoparietal and striatal contributions to rule learning and shifting, we focus on intrinsic connectivity networks involving these regions. Although the exact number of networks and borders between them depend on the parcellation methods, there is general agreement on at least five frontoparietal networks (Buckner et al., 2013; Menon, 2011;Power et al., 2011;Shirer et al., 2012; Yeo et al., 2011): the default mode network (ventromedial frontal and posterior cingulate), sensorimotor (primary motor and somatosensory cortex), dorsal attention (premotor, frontal eye fields, and superior parietal regions), cognitive (or executive) control (lateral prefrontal and parietal) and salience (anterior insula / inferior frontal and anterior cingulate).
Most of these networks were identified on the basis of cortical interactions; in addition there is evidence that different regions of the basal ganglia interact with each of these networks as well, consistent with known anatomical connections (Choi et al., 2012). Frontal regions have a topographic projection to the basal ganglia: corticostriatal projection neurons originating along a gradient from orbitofrontal cortex to motor cortex terminate in the striatum along a gradient beginning at the ventromedial striatum and progressing dorsally, laterally and posteriorly to the posterior putamen (Haber, 2003; Verstynen et al., 2012). Consistent with this gradient, the salience network (inferior frontal / anterior insula region and anterior cingulate) correlates with ventral striatal regions, whereas the cognitive control network (dorsolateral prefrontal regions) correlates with more dorsal regions of the caudate (Choi et al., 2012).
An emerging area of research focuses on how intrinsic connectivity networks interact with each other, and how these interactions underlie task performance (Gordon et al., 2012;Nomura et al., 2010). Cole and colleagues (2013) argue that the cognitive control network is more highly interactive than other networks, and should be thought of as a hub; these connections are consistent with this network's role in flexible control of cognitive functions (Duncan, 2001). A number of studies have identified anticorrelated patterns between the default network and frontoparietal network (Chen et al., 2013; Dang et al., 2012; Vanhaudenhuyse et al., 2011). The mechanism underlying this anticorrelated pattern is unclear; some studies find that it is mediated by the salience network (Sridharan et al., 2008; Uddin, 2015) and others find that the frontoparietal network mediates antagonistic processing between default and dorsal attentional (Spreng et al., 2013). Another open question is how these networks identified during resting state conditions are recruited during task performance, and the degree to which active task performance changes the connectivity patterns. Krienen and colleagues (2014) found that there was substantial commonality in coupling patterns across states, reflecting perhaps an anatomically constrained functional core, along with dynamic patterns of shifting connectivity in response to task demands.
1.3 Overview of the study
We examined neural network recruitment associated with learning, rule application, and switching using both traditional univariate analysis and multivariate connectivity analysis using constrained principal component analysis for fMRI (fMRI-CPCA; Woodward et al., 2013; Metzak et al., 2011, 2012). Subjects performed a continuous task in which they chose one of two stimuli differing on four dimensions (color, letter identity, size, and location), and received feedback as to whether their choice was correct or not. Performance was monitored so that after subjects had learned the rule they had the opportunity to apply the rule for several trials, after which they were cued to switch to a new rule. The rule learning and application portions were similar to our previous study (Seger and Cincotta, 2006), and as in that study we predicted that univariate analyses would identify frontal regions and parietal regions along with head of the caudate as being active during rule learning but less active during rule application. We further predicted that multivariate analyses would find that these regions demonstrate correlated activity during rule learning.
We compared three different types of switch cueing. In the feature cued condition, we changed the salient visual features associated with two dimensions of the stimuli: the letters and colors. In externally cued the color of the rectangle surrounding the stimuli was changed; the stimulus features remained the same. Finally, in feedback cued, both the stimulus features and surrounding rectangle color remained the same, but subjects were given feedback consistent with a new rule. Similarly to the classic WCST, subjects began to receive negative feedback and cueing was only provided via feedback. The WCST instructions specifically tell the administrator to avoid any other cue to the subject for switching, including any given by facial expression or tone of voice (Berg, 1948). Monchi and colleagues (Monchi et al., 2001;Simard et al., 2011) found that activity in the caudate and ventrolateral prefrontal cortex was important for planning a set shift, and in the putamen and posterior parietal cortex for executing it.
For multivariate analysis, we used fMRI-CPCA (Woodward et al., 2013; Metzak et al., 2011, 2012) to identify functionally interconnected networks during task performance across the switching, rule learning and rule application phases. Univariate and multivariate analyses each have their own strengths and limitations and provide complementary results. Because most fMRI studies use univariate methods they allow for easy comparison with previous research. However, univariate methods are best for identifying individual active regions, not distributed networks. In contrast, components identified in multivariate methods like, fMRI-CPCA reflect a pattern of task-related variance derived from all voxels in the brain and can provide information about how distributed regions cooperate to subserve a particular function. Data driven approaches like fMRI-CPCA can help segregate and characterize task-related processes that might not have been predicted by the experimenter, but are less well suited for testing specific hypotheses about specific regions; whereas univariate analyses allow for traditional significance testing. In the present paper, we used univariate analyses to test hypotheses about activity occurring within specific regions of the brain, and used fMRI-CPCA to investigate how distributed regions coordinate during different cognitive functions.
We first hypothesized that switching would recruit attentional and task set implementation mechanisms subserved by the salience network (anterior cingulate and inferior frontal / anterior insula) and interconnected regions of the basal ganglia, particularly the ventral striatum (Choi et al., 2012). For the univariate analysis, we predicted greater activity in these regions when comparing switching with other task phases. For the multivariate analyses, we predicted that these regions would be assigned to a common component, indicating functional connectivity, and that activity in this component would be highest in the switching phase of the task.
With regard to our switch cueing manipulation, we hypothesized that the ventral striatum would play a role in switching in our task no matter how the switch was cued. For visually cued switching, including feature and externally cued, we predicted additional visual cortical activity. The comparison of externally cued and feature cued was intended to separate the mere presence of a visual cue from an intrinsic change in the nature of the stimuli being processed; we made no a priori predictions concerning how these two conditions would differ.
In the overall analyses across all task phases we predicted that univariate analyses would identify similar regions as those found in Seger and Cincotta (2006) when comparing rule learning with rule application: broad recruitment of fronto-parietal-striatal executive control regions. We expected that multivariate analyses would provide additional insight into how these regions were functionally connected during task performance, and that activity within these extended networks would correlate with task phase. Specifically, we predicted that the executive control regions would be assigned to a common component, and that activity in this component would correlate with task phase, with highest activity in the hypothesis testing phase. We further predicted that regions of the default mode network would show an opposite pattern of result: decreased activity during hypothesis testing, and increased activity during rule application.
Materials and Methods
Subjects
A total of 12 adults participated in the study, 4 male and 8 female, with an average age of 24.0 years (range: 19-35). Subjects met criteria for magnetic resonance imaging (MRI) scanning (no metallic implants, no claustrophobia) and were neurologically healthy (no known neurological or psychiatric injury or disease, not taking any psychoactive medication or drugs).
Rule Learning and Switching Task
The rule learning task was based on a task developed by Levine (1975) and previously studied using fMRI by Seger and Cincotta (2006). In the rule task subjects completed a series of multi-trial rule learning problems. In each problem, subjects were presented with pairs of letters, one on the left side of the screen and one on the right side, and had to choose one of them by pressing the response button corresponding to the side of the screen that the correct letter appeared on. The letters differed on 4 dimensions: letter, color, size and position. Letters were selected from all 26 upper-case letters of the alphabet and colors from a set of 8 different easily named colors (red, orange, yellow, blue, green, turquoise, purple, and brown); for each rule learning problem, 2 of the letters and 2 of the colors were selected randomly. For size, there were two options: small (25 points) or large (45 points), and for location there were two positions: left or right. Each stimulus feature appeared in one of the two letters on each trial, but the pairings of features were randomized across trials, as shown in Figure 1. On each trial, subjects viewed two stimuli and selected one via a key corresponding to its location (left or right). After making a response, subjects received either positive (“Correct!” in green) or negative (“Wrong” in red) feedback. Subjects were told that the correct rule would be based on a single feature and dimension (i.e., “choose the red item” or “choose the small item”). Each stimulus pair was presented for 2 s, during which the subject made their response. Stimuli remained on the screen for the full time regardless of the subject's response time. The interval between stimuli and feedback was a random interval varied between 0 and 1 s. Feedback was presented for 1 s, for a total trial length of 3-4 s. In addition, there was a 0 to 1 s randomly jittered intertrial interval between feedback and the presentation of the stimulus for the next trial.
Figure 1.
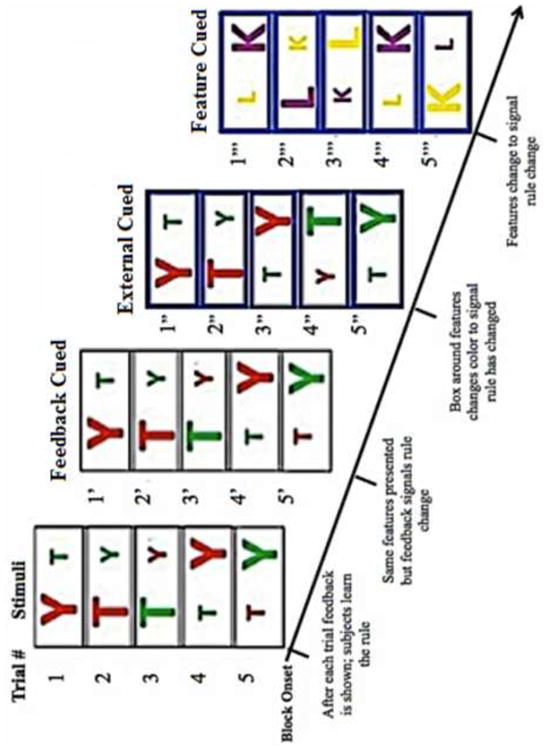
Diagrammatic representation of problem structure showing consecutive stimulus displays. After subjects applied a learned rule correctly for 4-7 trials, the rule was switched. Subjects were cued that it was time to switch in one of three manners: Feedback cued: there was no visual indication that subjects should switch in the stimulus displays; subjects merely began to receive negative feedback. Externally cued: the color of the box surrounding the stimuli changed color to indicate that subjects should switch rules. However, the stimuli continued to used the same color and letter features. Feature cued: The color and letter features of the stimui were changed.
After subjects had successfully learned each rule (as indicated by a sequence of 4-7 correct responses, varied randomly) one of three shift conditions randomly occurred in the task. (1) feature cued: new color and letter features were selected for the objects. In this condition the cueing was visual, but intrinsic to the stimulus displays. (2) externally cued: Subjects were signaled by an external cue (change in the color of the box surrounding the stimuli) that they should shift to a new rule. Stimulus features were not changed. (3) feedback cued: subjects received negative feedback and had to begin hypothesis testing again. In all conditions feedback immediately changed to be based on the new rule, and therefore subjects received negative feedback in all conditions. Subjects completed a practice session before scanning
Image Acquisition
Images were obtained with a 3.0 Tesla MRI scanner (Siemens TIM Trio) equipped with a 12-channel head coil at the Intermountain Neuroimaging Consortium (Boulder, CO). Structural images were collected using a T1-weighted rapid gradient-echo (MPRAGE) sequence (256 × 256 matrix; FOV, 256; 192 1-mm slices). Functional images were reconstructed from 28 axial oblique slices obtained using a T2* -weighted EP2d sequence (TR, 1500ms; TE, 25ms; FA, 75; FOV, 220-mm, 96 × 96 matrix; 4.5-mm thick slices; no inter-slice gap). The first three volumes, which were collected before the magnetic field reached a steady state, were discarded.
Image analyses: Univariate General Linear Model
The primary conditions were compared using BrainVoyager QX 2.8 (Goebel et al., 2006). Image preprocessing in Brain Voyager involved slice time correction, 3D motion correction, temporal filtering to correct for signal drifts (components with a frequency of less than 3 cycles across each 20 minute scan), spatial normalization, and spatial smoothing with a 6 mm FWHM Gaussian kernel. Rule learning and rule application conditions were defined individually for each rule learning problem on the basis of the subject's behavioral performance, as in Seger and Cincotta (2006). The rule learning epoch began at the first trial of the problem and extended through the trial of last error. The first trial of each rule learning problem was defined for the externally and feature cued conditions as the trial in which the visual change was made (color of surrounding box, or stimulus features, respectively). For the feedback cued condition, the first trial of the rule learning problem was defined as the first trial on which negative feedback was received by the subject, avoiding the possibility that a subject might respond correctly at the beginning of the problem by chance, and not receive the negative feedback cue indicating switch was necessary until later in the rule learning problem. The rule application epoch began on the trial following the trial of last error and extended through the trial preceding the switch. Within the rule learning epoch we defined two additional epochs, the switching epoch and hypothesis testing epoch. The switching epoch included the first 2 TRs (3 s) of each problem, roughly corresponding with the first trial. The hypothesis testing epoch began on the 3rd TR and continued through the trial of last error. The switching conditions were further divided into feature, externally, and feedback cued conditions. For each contrast between conditions, we generated maps corrected for multiple comparisons using the cluster level threshold implemented in Brain Voyager; this procedure uses a Monte Carlo process to estimate the minimum cluster size required for a particular alpha level based on the smoothness and number of activated voxels in each individual map. Coordinates presented in the Tables were converted from Talairach space to Montreal Neurological Institute (MNI) space using BrainMap Ginger ALE 2.3 (Brainmap.org) to allow for easier comparison with the FMRI-CPCA results in MNI space.
Constrained Principal Component Analyses for fMRI
To investigate task-related differences across functional networks, we used fMRI-CPCA using a finite-impulse response (FIR) model, as implemented in the fMRI-CPCA toolbox (available free of charge at www.nitrc.org/projects/fmricpca). FMRI-CPCA combines multivariate regression and principal component analysis to identify multiple functional networks associated with a given task. It is particularly appropriate for experimental paradigms extending across multiple trials, as in the present study (Whitman et al., 2013;Woodward et al., 2013;Metzak et al., 2011; Braunlich et al., 2015). FMRI-CPCA allows one to estimate changes in the BOLD response across peristimulus time within each functional network, and also allows statistical inference. For this analyses, preprocessing was performed using SPM 8 (http://www.fil.ion.ucl.ac.uk/spm/software/spm8). Preprocessing involved correction of slice time acquisition differences (images were adjusted to the 14th slice), motion correction of each volume to the first volume of the first run using 3rd degree spline interpolation, coregistration of the functional to the structural data, normalization to the MNI template, smoothing (with a 6 mm Gaussian kernel), and temporal filtering (with a 128 s high-pass filter).
FMRI-CPCA uses two matrixes, Z, which contains the BOLD time course of each voxel, with one column per voxel and one row per scan, and the design matrix, G which contains a finite impulse response (FIR) model of the BOLD response related to the event onsets. Z is regressed onto G, yielding a matrix, GC, of predicted scores. As a result, GC contains the variance in Z, that is accounted for by the design matrix, G. Components are extracted from the variance in GC via singular value decomposition, yielding U, a matrix of left singular vectors, D a diagonal matrix of singular vectors, and V, a matrix of right singular vectors. VD was rescaled by square root of [number of rows in Z – 1] and orthogonally (varimax) rotated prior to display. Varimax rotation maximizes the sum of the variances of the squared loadings so that coefficients are either large or near zero, with few intermediate values. This allows each variable to be associated with at most one factor, which simplifies the results in that factors are divided to as great a degree as possible into disjoint sets. Varimax rotation in fMRI-CPCA has been used in several previous studies (e.g., Braunlich et al., 2015; Metzak et al., 2012; Metzak et al., 2011). The advantages for fMRI are that individual brain regions are more likely to be assigned to single components after varimax rotation, and the results are therefore easier to interpret. However, there is currently no way of evaluating which rotation method, if any, is most likely to reveal “true” patterns of connectivity. The assumption underlying the choice of varimax rotation, that it is preferable to assign regions to single components, may not be appropriate in all situations. In order to ensure that varimax rotation did not lead to misleading patterns of results, we examined both the unrotated and rotated versions. Overall, for both fMRI-CPCA analyses, rotation made no difference in the first components of each analysis, either to the percentage of variance accounted for or for the regions assigned to the components. Varimax rotation appeared to primarily shift variance accounted for from component two to the other components. This allowed for a clearer division into multiple components. For example, after orthogonalization in CPCA 1 the motor systems remains in Component 2, and the default mode network is in Component 3. This is useful for interpretation in that these two networks did show different time courses in the rotated version that did correspond with hypothesized networks.
These rescaled values of VD were overlaid on a structural image to visualize the functional networks. We included the top 10% of the loadings in the Tables and Figures; we chose a relatively lenient threshold in order to provide as complete a description as possible of all regions participating in individual components. We verified that using a stricter (5%) threshold reduced the size of the clusters, but did not change the pattern of reported results substantially. For each component we graphed the predictor weight timecourse across all the voxels, time locked to the switch trial. We did not adjust predictor weights at time 1 to zero because recent studies have shown that this can lead to misleading results if conditions differ at time 1 (Lavigne et al., 2015) For each combination of peristimulus time-point, condition and subject, fMRI-CPCA estimates a set of predictor weights (P), which are the values that relate the design matrix, G, to the networks associated with each component, such that U = G × P. The predictor weights therefore indicate the importance of each condition to each component across peristimulus time. For individual components, we subjected these predictor weights to analysis of variance in order to identify main effects and interactions between condition and time-point. If a condition by time point interaction was observed, we performed post hoc tests to identify time points at which conditions significantly differed.
We performed two fMRI-CPCA analyses. In one, we divided problems by switch cueing condition, resulting in three conditions: feedback cued, externally cued, and feature cued. The goal of this analysis was to identify functional connectivity networks across the time course of learning, and to identify any differences in networks between switching conditions when variance was constrained by switching condition. In the other, we used the spontaneously occurring differences in length of the rule learning period and grouped problems by number of trials to learn (final error trial); the mean learning rate (as described in Results, below) was 5 trials. This resulted in 5 conditions with sufficiently many trials to include in the analysis including problems learned in 3 trials, 4 trials, 5 trials, 6 trials, and 7 or more trials. The number of problems included in each condition were roughly equal, with the exception of those learned in 7+ trials which had a higher number of problems included. The few problems in which subjects learned in fewer than 3 trials were excluded from this analysis. Manipulating the length of time in particular phases of a task is particularly helpful for isolating processes in tasks in which the processes must occur in the same sequence. For example, Woodward et al. (2013) manipulated the length of a memory maintenance period in a working memory task in order to identify functional networks associated with encoding, maintenance, and retrieval. In our task, switching, hypothesis testing, and rule application always occur in the same order A network associated with functions specific to rule hypothesis testing should show a rise and fall at earlier time points when the rule is learned quickly (e.g., 3 or 4 trials) than when it is learned more slowly (e.g., 6 or 7 trials).
Results
Behavioral results
The primary measure was the number of trials required to learn, which was operationally defined as the trial of last error. Overall, subjects required a mean of 5.0 trials. Performance was calculated separately for the three switching conditions: subjects reached criterion significantly faster in the feature cued condition (M = 4.1, SD = 1.6) than the feedback cued (M = 5.8, SD = 1.3; t(11)=2.460, p<0.05); neither condition differed significantly from the externally cued (M = 5.3, SD = 1.6). We also examined learning time and reaction time for the different rule features. Overall, color rules were learned most quickly (M = 4.4; SD = 1.8), and position rules most slowly (M=5.7, SD =2.3), with letter (M=5.1; SD = 2.1) and size (M=5.1, SD = 1.7) rules intermediate. Only the difference between color and position was significant (t(11)=2.377, p<0.05). Although the position rules were learned most slowly, the mean reaction times for position rule based decisions were the fastest (M=647 ms), significantly more so than color (M=704 ms), letter (M=733 ms) and size (M=722 ms), ts (11) = 3.9, 4.3, 4.0, respectively, ps < 0.05. No other pairwise difference reached significance.
Univariate Imaging results
Rule Learning versus Rule Application
Rule learning (combination of Switching and Hypothesis Testing epochs) activated a wide fronto-parietal-striatal network, as described in Table 1 and depicted in Figure 2. Frontal regions included the bilateral anterior insula/inferior frontal region, bilateral dorsolateral prefrontal cortex, bilateral anterior prefrontal cortex, and medial frontal regions. Parietal regions were centered along the intraparietal sulcus bilaterally. Basal ganglia activity extended bilaterally across the head of the caudate and anterior putamen. Overall, the results were consistent with those reported in Seger and Cincotta (2006), despite the methodological differences: that study did not require switching because individual multi-trial rule learning problems were separated by a control task. For rule application, areas of greater activity in comparison with rule learning were found in the left parahippocampal gyrus and in regions of medial frontal and parietal cortex often associated with the default mode network.
Table 1. Regions associated with Rule Learning and Rule Application.
| Condition | x | y | z | mm3 |
|---|---|---|---|---|
| Rule Learning > Rule Application | ||||
| Frontal | ||||
| L. Middle Frontal Gyrus and Medial frontal | 43 | 26 | 36 | 25631 |
| R. Middle and Superior Frontal Gyrus | -32 | 12 | 59 | 2726 |
| R. Middle Frontal Gyrus | -55 | 11 | 22 | 8278 |
| R. Inferior Frontal / Anterior insula | 49 | 13 | 3 | 1945 |
| L. Inferior Frontal / Anterior insula | -33 | 18 | -6 | 1967 |
| L. Anterior Prefrontal | -39 | 59 | 10 | 1269 |
| R. Anterior Prefrontal | 26 | 56 | -17 | 5539 |
| Basal ganglia | ||||
| R. Caudate Head / Anterior Putamen | 10 | 7 | 5 | 2191 |
| Caudate Head / Anterior Putamen | -16 | -2. | 16 | 4295 |
| Parietal and temporal | ||||
| R. Intraparietal Sulcus / Superior Parietal | 30 | -57 | 44 | 15650 |
| L. Intraparietal Sulcus / Superior Parietal | -38 | -57 | 49 | 13918 |
| L. Lateral Occipital Lobe | -42 | -60 | -21 | 5222 |
| Rule Application > Rule Learning | ||||
| R. Superior Temporal Gyrus | 68 | -6 | 2 | 1128 |
| B. Posterior Cingulate / Medial Parietal | -6 | -53 | 19 | 13112 |
| B. Medial Prefrontal | 0 | 50 | -16 | 18396 |
| L. Middle Temporal Gyrus | -49 | 18 | -39 | 7102 |
| L. Parahippocampal Gyrus | -26 | -19 | -26 | 3483 |
Note: Corrected for multiple comparisons using the cluster level threshold simulator, voxelwise threshold p < .001, alpha = .05, cluster size = 36 voxels (288 mm3). x, y, z: MNI coordinates. mm3: Size of cluster in cubic millimeters.
Figure 2.
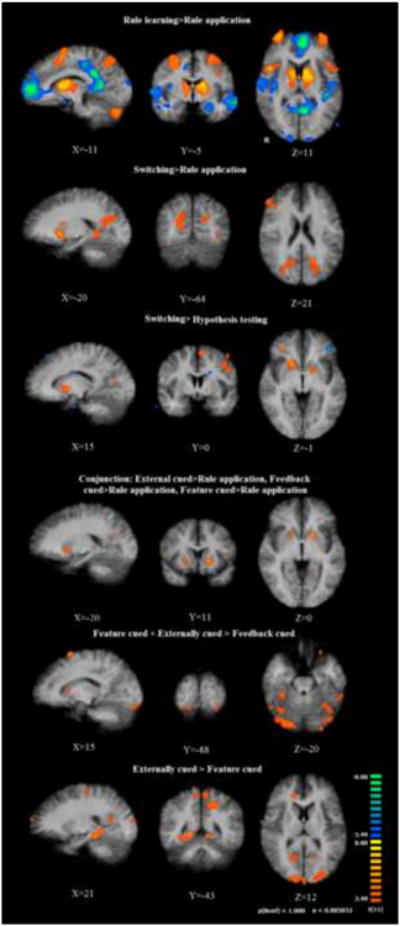
Regions identified via univariate general linear model contrasts. Top row: rule learning versus rule application. Red-orange color map: rule learning > rule application. Blue color map: rule application > rule learning. Second row: Switching (all conditions) versus rule application. Third row: Conjunction analysis showing common region of activity in ventral putamen across all three switching conditions in comparison with rule application. Fourth row: Switching (all conditions) versus hypothesis testing. Red-orange color map: Switching > hypothesis testing. Blue color map: hypothesis testing > switching. Fifth and sixth rows: contrasts between switching cue conditions: Feature cued + Externally cued > Feedback cued, and Externally cued > Feature cued, respectively. All contrasts are shown overlaid on the subjects' average normalized high resolution anatomical image.
Effects of Switching
We first identified common regions of activity for rule switching by comparing activity at the time of switch cue with rule application and with hypothesis testing. As shown in Figure 2 and Table 2, the contrast of switching in comparison with rule application revealed that the ventral striatum (left ventral putamen) and left parahippocampal cortex were active during switching, along with right lateral prefrontal and bilateral medial parietal cortex. We followed up with a conjunction analysis across the three individual contrasts of each switching condition versus rule application (feedback cued > rule application, externally cued > rule application, feature cued > rule application), which identified a single common region of activity: the left ventral putamen.
Table 2. Regions associated with Switching.
| Condition | x | y | z | mm3 |
|---|---|---|---|---|
| Switching > Rule Application (29 voxels / 232 mm3) | ||||
| R. Middle Frontal Gyrus | 52 | 40 | 14 | 785 |
| R. Medial Parietal / Posterior Cingulate | 29 | -57 | 7 | 5045 |
| L. Medial Parietal / Posterior Cingulate | -19 | -59 | 22 | 2555 |
| L. Parahippocampal Gyrus | -22 | -49 | -6 | 1557 |
| L. Ventral Putamen | -19 | 9 | -8 | 1878 |
| Conjunction (25 voxels / 200 mm3.) | ||||
| L. Ventral Putamen | -16 | 9 | -9 | 723 |
|
| ||||
| Switching > Hypothesis Testing (36 voxels / 288 mm3) | ||||
| R Medial Frontal Gyrus | 8 | 15 | 52 | 13662 |
| L. Medial Frontal Gyrus | -8 | 6 | 59 | 15417 |
| R. Middle Frontal Gyrus | 60 | 11 | 35 | 2646 |
| L. Precentral Gyrus | -47 | 2 | 54 | 19440 |
| L. Precentral Gyrus | -63 | -2 | 45 | 12582 |
| R. Postcentral Gyrus | 70 | -13 | 54 | 297 |
| R. Precuneus | 24 | -67 | 30 | 20088 |
| R. Precuneus | 28 | -53 | 48 | 5292 |
| L. Precuneus | -27 | -67 | 34 | 4833 |
| L. Inferior Frontal Gyrus | -50 | 10 | 30 | 14472 |
| R. Inferior Frontal Gyrus | 33 | 42 | -12 | 8208 |
| R. Inferior Frontal Gyrus | 30 | 36 | -34 | 2025 |
| L. Inferior Frontal Gyrus | -32 | 39 | -37 | 2700 |
| R. Inferior Frontal Gyrus | 27 | 35 | -14 | 3645 |
| L. Insula | -41 | 17 | 6 | 2133 |
| R. Cerebellum | 43 | -46 | -23 | 7074 |
| L. Fusiform Gyrus | -47 | -58 | -10 | 837 |
| R. Cuneus | 37 | -86 | 34 | 14067 |
| R. Lingual Gyrus | 27 | -62 | 9 | 13824 |
|
| ||||
| L. Hippocampus | -24 | -40 | 4 | 4779 |
| R. Ventral Putamen and Caudate | 20 | 19 | -9 | 23247 |
| R. Caudate Head | 14 | 20 | 8 | 10152 |
| L. Ventral Putamen | -15 | 4 | -4 | 15579 |
| Hypothesis Testing > Switching | ||||
| L. Middle Frontal Gyrus | -44 | 53 | -18 | 20655 |
| L. Superior Frontal Gyrus | -14 | 44 | 49 | 3699 |
| R. Superior Frontal Gyrus | 30 | 70 | 19 | 243 |
| L. Inferior Frontal Gyrus | -41 | 41 | -10 | 9963 |
| R. Middle Temporal Gyrus | 69 | -2 | -34 | 2106 |
| R. Superior Temporal Gyrus | 69 | 20 | -30 | 7047 |
| R. Fusiform Gyrus | 59 | -46 | -26 | 2160 |
| B. Cerebellum | 1 | -95 | -21 | 2403 |
| L. Cerebellum | -54 | -75 | -25 | 2295 |
| L. Parahippocampal Gyrus | -31 | -28 | -34 | 2916 |
| L. Caudate Body | -18 | 3 | 27 | 4050 |
| R. Caudate Tail | 24 | -26 | 19 | 540 |
|
| ||||
| Feature cued + Externally cued > Feedback cued (threshold: 15 voxels / 120 mm3) | ||||
| R. Fusiform Gyrus | 55 | -60 | -20 | 593 |
| R. Occipital Lobe | 23 | -89 | -20 | 2142 |
| R. Fusiform Gyrus | 36 | -66 | -19 | 548 |
| R. Fusiform Gyrus | 35 | -41 | -25 | 525 |
| L. Inferior Temporal Gyrus, Occipital Lobe | -55 | -59 | -8 | 10764 |
| R. Supplementary Motor Area | 21 | 18 | 60 | 5248 |
| L. Middle Frontal Gyrus | -33 | 58 | 4 | 1679 |
| L. Premotor Cortex | -34 | 2 | 63 | 678 |
| L. Middle Frontal Gyrus | -49 | 40 | 16 | 3794 |
| L Supplementary Motor Area | -22 | 21 | 57 | 3776 |
| R. Caudate / Putamen | 10 | 9 | -2 | 739 |
| L. Caudate / Putamen | -3 | 7 | 5 | 2371 |
| Externally cued > Feature cued (threshold: 28 voxels / 224 mm3) | ||||
| R. Parahippocampal Gyrus | 20 | -46 | -4 | 2528 |
| L. Parahippocampal Gyrus | 0 | -59 | -6 | 3216 |
| B. Occipital Lobe | 17 | -95 | 18 | 2939 |
| L. Lateral Occipital Lobe | -39 | -90 | 5 | 3534 |
| R Middle Temporal Gyrus | 71 | -3 | -2 | 1105 |
| R. Medial Frontal / Supplementary Motor area | 14 | -20 | 61 | 815 |
| B. Medial Parietal / Precuneus | -9 | -49 | 64 | 5229 |
Note: All contrasts were individually corrected for multple comparisons using the cluster level threshold simulator, voxelwise threshold p < .005, alpha = .05. The resulting cluster threshold for each contrast is indicated in parenthesis next to the contrast name. The conjunction analysis was a conjunction of three contrasts: feedback cued > rule application, feature cued > rule application, and externally cued > rule application. x, y, z: MNI coordinates. mm3: Size of cluster in cubic millimeters.
When switching was compared with hypothesis testing, regions of the ventral striatum extending into the dorsal caudate nucleus were again more active during switching. In addition, cortical regions of the salience network (inferior frontal gyrus / anterior insula) and motor regions were more active for switching than hypothesis testing. In contrast, there was greater activity for hypothesis testing than switching in the bilateral middle and superior frontal gyri, and in more dorsal and posterior regions of the caudate.
We then compared activity related to type of switch cue. Our first comparison was between the two visually cued conditions and feedback only cued switching (feature cued + externally cued > feedback cued). This contrast resulted in a number of regions across the occipital and temporal lobe visual areas. There were also bilateral regions of activity in the anterior striatum extending to both caudate and putamen; these regions held an intermediate position between the relatively ventral regions active across all switching conditions (in the switching > rule application contrast), and the relatively dorsal regions active in rule learning (in the rule learning > rule application contrast). No regions were more active for the feedback cued condition in this contrast, possibly due to the fact that subjects began to receive negative feedback in all conditions following rule switch. Finally we directly compared the two visual conditions (externally cued > feature cued), which revealed a number of regions more active for externally cued. These regions were the bilateral parahippocampal gyri, visual cortical regions, and a portion of the supplementary motor area.
fMRI-CPCA functional networks, constrained by wwitching conditions
Our first fMRI-CPCA analysis focused on identifying networks with variance constrained by the design matrix representing the Switching conditions (feedback cued, externally cued, feature cued). We chose to extract 5 components, consistent with visual inspection of the scree plot indicating a salient reduction in the variance accounted for by a greater number of components. The 5 components in order accounted for 27.19%, 10.33%, 6.61%, 4.29%, and 3.11% of variance after varimax rotation. Allowing for the slow nature of the hemodynamic response (typically peaking at 6 seconds post-activity), activity associated with the switching trial (trial 1) should be reflected in immediate changes in the first 6 seconds; activity associated with hypothesis testing (on average trials 2-5, lasting an average of 12.5 seconds) with subsequent changes, and activity associated with rule application beginning between trials 4 to 6 (seconds 10 to 15) and extending through the end of the problem. For each component we determined overlap with intrinsic connectivity networks by comparison with Yeo et al. (2011).
Component 1
As shown in Table 3 and Figure 3A, Component 1 consisted of a large frontal, parietal, striatal and cerebellar network. Regions of the frontal lobe included dorsolateral prefrontal cortex (middle and superior frontal gyri), the relatively posterior region of the anterior prefrontal cortex, and the bilateral inferior frontal / anterior insula region. Parietal lobe activity extended bilaterally along the intraparietal sulcus. This component included regions of the salience network (inferior frontal / anterior insula, and anterior cingulate), dorsal attentional (intraparietal sulcus), and cognitive control network (dorsolateral prefrontal) (Buckner et al., 2013; Menon, 2011; Power et al., 2011; Shirer et al., 2012; Yeo et al., 2011). The cerebellum also participated in this component, in particular medial and lateral regions of the cerebellar cortex that Buckner and colleagues (2011) found to be correlated with the cognitive control frontoparietal network. This component also included regions of the head of the caudate found to correlate with the frontoparietal network by Choi and colleagues (2012).
Table 3. Switch Conditions fMRI-CPCA Analysis, Component 1 loadings.
| Neural regions | Cluster volume(mm3) | Brodmann area for peak locations | MNI coordinate (X Y Z) for peak locations | Loading value | Network | |||
|---|---|---|---|---|---|---|---|---|
| 1 | B. Superior Parietal Lobule / Intraparietal Sulcus | 43216 | 7 | -36 | -56 | 48 | 0.38 | DA |
| 2 | L. Middle Frontal Gyrus | 11008 | 9 | -42 | 28 | 36 | 0.36 | ECN |
| 3 | R. Middle Frontal Gyrus | 8536 | 8 | 46 | 26 | 40 | 0.33 | ECN |
| 4 | B. Superior Frontal Gyrus | 4832 | 6 | 0 | 16 | 54 | 0.34 | ECN |
| 5 | R. Middle Frontal Gyrus | 2784 | 6 | 30 | 8 | 62 | 0.33 | ECN |
| 6 | L. Middle Frontal Gyrus | 2752 | 10 | -38 | 54 | 8 | 0.32 | ECN |
| 7 | L. Cerebellum | 2552 | -8 | -82 | -26 | 0.31 | ECN | |
| 8 | R. Cerebellum | 2368 | 38 | -68 | -28 | 0.32 | ECN | |
| 9 | L. Cerebellum | 2096 | -36 | -70 | -30 | 0.30 | ECN | |
| 10 | R. Middle Frontal Gyrus | 1472 | 10 | 32 | 60 | 12 | 0.30 | ECN |
Note: Includes all clusters > 9 voxels; L = left, R = right, B = bilateral. Network refers to the intrinsic connectivity network with greatest overlap for the region. VS=Visual; SM=Somatomotor; DA=Dorsal Attention; SA=Salience; L=Limbic; DMN=Default Mode Network; ECN=Executive Control Network.
Figure 3.
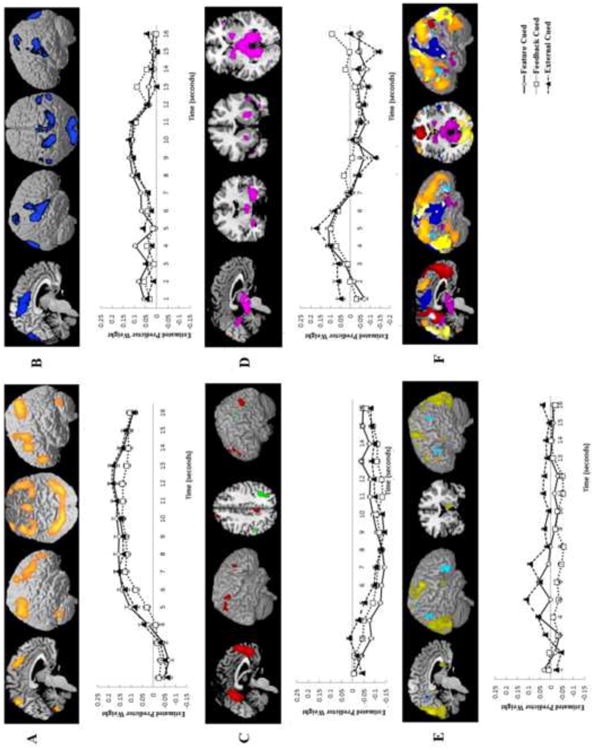
Components identified in the Switch Condition fMRI-CPCA analysis, in which variance was constrained by switching cue condition. Regions within each component are illustrated as a colored overlay on the MNI brain template in MRIcron. Components 1 (A), 2 (B), and 4 (D) had only positive loadings. In Component 3 (C), positive loadings are shown in red and negative in green; in Component 5 (E) positive loadings are shown in yellow and negative in blue. Graphs for each component show the estimated hemodynamic response across all voxels with positive loadings within the component for each condition across the first 16 seconds of each rule learning problem, beginning with the switch trial. Error bars show standard error. Bottom right (F) images show all components overlaid on the same rendered brain for comparison purposes. Colors follow those used in each individual component images.
The time course of this component shows a pattern of increasing activity at the beginning of each switch, that continues across the time of hypothesis testing and into early rule application. This time course pattern is consistent with univariate GLM analyses that found most of these areas were significantly more active in rule learning than during rule application (compare with Table 1, rule learning > rule application contrast). An ANOVA carried out on the predictor weights revealed a significant main effect of time point, F (15, 165) = 13.8, p < .001, η2=.56. There was no main effect of switch condition or interaction between condition and time point, ps > .05.
Component 2
Component 2 consisted of primarily motor regions, including the bilateral pre and postcentral gyri, and the motor cingulate (see Table 4 and Figure 3B). This network overlaps to a large degree the somatomotor networks identified in resting state studies (Power et al., 2011; Yeo et al., 2011). In addition, some regions of the occipital lobe and cuneus participated in this network. The combination of motor and visual regions in this component may reflect similarities in relative timing of visual demands and motor demands during trials across the task. The time course of this component showed an increase at the end of rule learning and the beginning of rule application, consistent with previous studies showing a shift to motor system reliance during learning (Crescentini et al., 2011) and reliance on motor regions for simple abstract rule learning (Kayser and D'Esposito, 2013). An ANOVA carried out on the predictor weights revealed a main effect of time point, F(15, 165) = 1.8, p < .05, η2=.14. There was no main effect of switch condition or interaction between condition and time point, ps > .05.
Table 4. Switch Conditions fMRI-CPCA Analysis, Component 2 loadings.
| Neural regions | Cluster volume(mm3) | Brodmann area for peak locations | MNI coordinate (X Y Z) for peak locations | Loading value | Network | |||
|---|---|---|---|---|---|---|---|---|
| 1 | B. Medial Frontal Gyrus, Cingulate | 37 512 | 31 | 0 | -8 | 44 | 0.19 | SM |
| 2 | R. Inferior Parietal Lobule / Superior temporal gyrus | 17808 | 40 | 60 | -32 | 26 | 0.19 | SM |
| 3 | B. Occipital lobe / Cuneus | 16104 | 19 | -12 | -94 | 32 | 0.21 | VS |
| 4 | L. Inferior Parietal Lobule / Superior temporal gyrus | 8968 | 40 | -58 | -36 | 26 | 0.17 | SM |
| 5 | L. Postcentral Gyrus | 608 | 3 | -44 | -20 | 40 | 0.14 | SM |
| 6 | L. Insula / Postcentral Gyrus | 344 | 13 | -46 | -14 | 24 | 0.14 | SM |
| 7 | L. Medial Frontal Gyrus | 200 | 10 | -4 | 54 | -4 | 0.14 | DMN |
| 8 | R. Insula / Precentral gyrus | 88 | 13 | 38 | 4 | 12 | 0.14 | SM |
Note: includes all clusters > 9 voxels; L = left, R = right, B = bilateral. Network refers to the intrinsic connectivity network with greatest overlap for the region. VS=Visual; SM=Somatomotor; DA=Dorsal Attention; SA=Salience; L=Limbic; DMN=Default Mode Network; ECN=Executive Control Network.
Component 3
Components 3 and 5 were the only ones of the components that had both positive and negative (e.g., negatively correlated with the time course) loadings. The positive loadings in component 3 were much larger than the negative, and as shown in Figure 3C (red overlay) and Table 4 included regions of the bilateral medial frontal cortex, bilateral posterior cingulate, and the left angular gyrus. These regions are commonly associated with the default mode network (Andrews-Hanna et al., 2010), and match the specific regions previously identified in whole brain network parcellations (Power et al., 2011; Yeo et al., 2011). The time course of component 3 showed a gradual decrease in activity during the rule learning phase, followed by a plateau during the rule application phase. This pattern is consistent with the default network being anticorrelated with frontoparietal cognitive control networks (Hellyer et al., 2014), and having generally higher activity during tasks requiring less time or effort (as is true of rule application in comparison with rule learning). These regions also were active in the rule learning > rule application univariate contrast (compare with Table 1). An ANOVA carried out on the predictor weights revealed a significant main effects of time point, F(15, 165) = 2.3, p < .01, η2=.17, and interaction between time point and switch condition, F(30, 330) = 1.8, p < .01, η2=.14.but no significant main effect of switch condition, F(2,22) = 2, p > .05, η2=.02, Visual inspection of the time course indicates that the interaction was driven by higher early activity for externally cued during switching and rule learning, followed by higher activity for feedback cued during rule application. Post hoc pairwise comparisons showed that externally cued was significantly higher than feature cued at 3 and 5 s (t(11) = 4.3, p < .01, t(11) = 2.8, p < .05) and significantly higher than feedback cued at 3 s, t(11) = 2.9, p < .05. Feedback cued was significantly higher than feature cued at 13 s, t(11) = 3, p < .05.
The negative loadings consisted of small, highly localized clusters located bilaterally in the intraparietal sulcus, and in left lateral prefrontal cortex (see Table 5, and Figure 3C green overlay). In the univariate GLM analysis these regions were active in rule learning in the rule learning > rule application contrast (compare with Table 1). It is possible that these regions were clustered in component 3 rather than component 1, along with the majority of the frontoparietal regions, due to the slightly different time course. For these negatively loaded component 3 regions, activity would have increased gradually across rule learning, and decreased in rule application to a greater degree than was characteristic of component 1.
Table 5. Switch Conditions fMRI-CPCA Analysis, Component 3 loadings.
| Neural regions | Cluster volume(mm3) | Brodmann area for peaklocations | MNI coordinate (X Y Z) for peak locations | Loading value | Network | |||
|---|---|---|---|---|---|---|---|---|
| Positive loadings | ||||||||
| 1 | B. Anterior Cingulate /Medial Frontal | 42696 | 10 | -4 | 52 | -2 | 0.22 | DMN |
| 2 | B. Cingulate Gyrus | 24232 | 31 | -4 | -54 | 28 | 0.23 | DMN |
| 3 | L. Angular Gyrus | 5680 | 39 | -42 | -74 | 32 | 0.20 | DMN |
| 4 | L. Inferior and Middle Temporal Gyrus | 1872 | 20 | -62 | -12 | -22 | 0.16 | DMN |
| 5 | L. Postcentral Gyrus | 1280 | 5 | -30 | -42 | 72 | 0.14 | SM |
| 6 | R. Cuneus | 880 | 19 | 28 | -84 | -36 | 0.13 | VS |
| 7 | L. Fusiform Gyrus | 200 | 20 | -30 | -36 | -18 | 0.12 | DMN |
| 8 | R. Fusiform Gyrus | 168 | 20 | 60 | -6 | -26 | 0.12 | DMN |
| 9 | R. Postcentral Gyrus | 168 | 7 | 16 | -52 | 72 | 0.12 | SM |
| 10 | R. Cerebellum | 104 | 48 | -64 | 44 | .12 | DMN | |
| Negative loadings | ||||||||
| 1 | R. Inferior Parietal Lobule | 2920 | 40 | 34 | -50 | 42 | -0.15 | DA/ECN |
| 2 | L. Inferior Parietal Lobule | 552 | 40 | -48 | -42 | 46 | -0.14 | ECN |
| 3 | L. Inferior Frontal Gyrus | 520 | 9 | -44 | 4 | 32 | -0.14 | SA |
| 4 | R. Inferior Parietal Lobule | 272 | 40 | 48 | -38 | 46 | -0.12 | ECN |
Note: includes all clusters > 9 voxels; L = left, R = right, B = bilateral. Network refers to the intrinsic connectivity network with greatest overlap for the region. VS=Visual; SM=Somatomotor; DA=Dorsal Attention; SA=Salience; L=Limbic; DMN=Default Mode Network; ECN=Executive Control Network.
Component 4
Component 4 consisted primarily of limbic regions including the bilateral ventral striatum (ventral putamen), dopaminergic midbrain, thalamus, and bilateral parahippocampal gyrus (see Table 5 and Figure 3D). The time course of this component shows a sharp increase at the beginning of switching that rapidly decreases, before rule learning is complete. This pattern is consistent with functions related to detecting the need for a switch and initial execution of the switch, rather than the hypothesis testing. These areas are similar to those identified in the switching > rule application and switching > hypothesis testing contrast in the univariate analyses (compare with Table 2). An ANOVA carried out on the predictor weights revealed a significant main effect of time point, F(15, 165) = 4.7, p < .001, η2=.3, and interaction between time point and switch condition, F(30, 330) = 1.8, p < .01, η2=.14, but no significant main effect of switch condition F(2,22) = 1.5, p >.05, η2=.12. The interaction appears to be driven by differences between the shift conditions at the initial time point as well as in the hypothesis testing and rule application phases, but not during the switch phase (seconds 2-6). Post hoc pairwise comparisons showed that externally cued was significantly higher than feature cued and feedback cued at 1 s (t(11) = 3, p < .05, t(11) = 2.8, p < .05). Feedback cued was significantly higher than externally cued at 9 and 15 s (((t(11) = 3, p < .05, t(11) = 4, p < .01) and feature cued at 16 s, t(11) = 4, p < .01; feature cued was significantly higher than externally cued at 15 s, t(11) = 3.9, p < .01.
Component 5
Component 5 also had positive and negative loadings, described in Table 7 and Figure 3E. The positive loadings were primarily visual cortical regions that extended across large portions of the extrastriate visual cortex. The negative loadings were in medial parietal cortex, and small regions of lateral parietal and inferior frontal cortex. Observation of the predictor weight graph indicates a flat time course across conditions, but with generally highest activity for externally cued conditions and lowest for feedback cued. This observation is supported by the ANOVA carried out on the predictor weights which revealed a significant main effect of switch condition, F(2,22) = 4.4, p < .05, η2=.28, but no effect of time point or interaction between time point and switch condition, ps > .1. These results are consistent with the univariate results shown in Table 2 in which there was greater occipital and parietal activity for externally cued shifts in comparison with feature cued.
Table 7. Switch Conditions fMRI-CPCA Analysis, Component 5 loadings.
| Neural regions | Cluster volume(mm3) | Brodmann area for peak locations | MNI coordinate (X Y Z) for peak locations | Loading value | Network | |||
|---|---|---|---|---|---|---|---|---|
| Positive loadings | ||||||||
| 1 | B. Occipital Lobe | 66032 | 18 | -14 | -76 | 4 | 0.12 | VS |
| 2 | R. Precentral Gyrus | 2536 | 6 | 56 | -2 | 48 | 0.11 | SM |
| 3 | L. Precentral Gyrus | 2296 | 6 | -34 | -10 | 68 | 0.10 | SM |
| 4 | R. Anterior Cingulate | 912 | 32 | 8 | 18 | -8 | 0.09 | SA |
| 5 | L. Inferior Occipital Gyrus | 824 | 18 | -40 | -84 | -10 | 0.09 | VS |
| 6 | L. Middle Frontal Gyrus | 616 | 9 | -36 | 40 | 38 | 0.11 | SA |
| 7 | R. Superior Frontal Gyrus | 568 | 6 | 16 | -4 | 76 | 0.09 | ECN |
| 8 | L. Middle Frontal Gyrus | 320 | 10 | -42 | 42 | 14 | 0.09 | ECN |
| 9 | L. Cerebellum | 304 | -46 | -44 | -24 | 0.09 | SA | |
| 10 | R. Postcentral Gyrus | 240 | 1 | 46 | -30 | 66 | 0.09 | SM |
| 11 | L. Middle Frontal Gyrus | 224 | 6 | -36 | 12 | 62 | 0.10 | ECN |
| 12 | L. Superior Parietal Lobule | 184 | 7 | -38 | -66 | 48 | 0.08 | DA |
| Negative loadings | ||||||||
| 1 | L. Precuneus | 2040 | 7 | 0 | -52 | 34 | -0.13 | ECN |
| 2 | R. Inferior Frontal Gyrus | 1496 | 47 | 46 | 30 | -8 | -0.11 | SA |
| 3 | L. Inferior Frontal Gyrus | 968 | 45 | -48 | 22 | 16 | -0.10 | SA |
| 4 | R. Inferior Parietal Lobule | 888 | 40 | 32 | -42 | 50 | -0.10 | DA |
| 5 | R. Inferior Parietal Lobule | 320 | 39 | 50 | -68 | 40 | -0.09 | ECN |
| 6 | L. Supramarginal Gyrus | 320 | 40 | -62 | -46 | 38 | -0.09 | ECN |
| 7 | L. Superior Frontal Gyrus | 200 | 8 | -22 | 18 | 48 | -0.09 | ECN |
Note: includes all clusters > 9 voxels; L = left, R = right, B = bilateral. Network refers to the intrinsic connectivity network with greatest overlap for the region. VS=Visual; SM=Somatomotor; DA=Dorsal Attention; SA=Salience; L=Limbic; DMN=Default Mode Network; ECN=Executive Control Network.
fMRI-CPCA Functional networks, constrained by number of learning trials
The second fMRI-CPCA analysis focused on identifying networks with variance constrained by the design matrix including number of learning trials (3, 4, 5, 6, or 7+). The goal of this analysis was to use the differences in time spent in the rule learning phase to better isolate components implementing functions specific to rule learning, similar to the approach taken in Woodward et al., 2013. We chose to extract 3 components, consistent with visual inspection of the scree plot. The 3 components in order accounted for 27.2%, 10.8%, and 8.8% of variance after rotation.
Component 1
Component 1 involved regions of the cognitive control network similar to that in Component 1 of the switch condition constrained fMRI-CPCA analysis. These regions extended across bilateral intraparietal sulcus and superior parietal lobe, middle frontal gyri, inferior frontal / anterior insula, anterior cingulate, caudate, and cerebellum. An ANOVA on the predictor weights revealed a main effect of time-point F(15, 165) = 11.8, p < .001, η2=.52, and a significant interaction between condition and time-point F(60, 660) = 1.61 p < .01, η2=.13, but no main effect of number of learning trials, F(4,44) = .81, p > .05, η2=.07. Conditions in which learning was faster (3, 4, and 5 trials) generally had a steeper slope, and had a higher and earlier peak in activity than those in which learning was slower (6 and 7+ trials). Post hoc pairwise comparisons found that condition 3 was significantly higher than condition 6 at 8 s, t(11)=2.2, p < .05, and condition 4 was significantly higher than condition 6 at 9 s, t(11)=2.79, p < .05. The slowest learning condition, 7+, was associated with a late rise, remaining elevated as the other conditions decreased. Post hoc pairwise comparisons showed that condition 7 was significantly higher than condition 6 at 10 and 12 seconds (t(11) = 2.24, p < .05, and t(11) = 2.6, p < .05, respectively), and significantly higher than condition 5 at 15 and 16 s (t(11) = 2.9, p < .05, and t(11) = 2.5, p < .05, respectively), and significantly higher than condition 4 at 15 s and 16s (t(11) = 3.7, p < .05, and t(11) = 3.7, p < .05, respectively). These patterns of recruitment are consistent with component 1 subserving functions associated specifically with rule learning.
Component 2
Component 2 included regions of medial frontal, medial parietal regions often associated with the default mode network, along with portions of superior temporal cortex, somatomotor cortex, and cerebellum associated with the sensorimotor network. The overall trend of activity in this component was a decrease during hypothesis testing followed by an increase during rule application. For component 2, an ANOVA on the predictor weights revealed a main effect of time-point F(15, 165) = 4.7, p < .001, η2=.3, and a significant interaction between condition and time-point F(60, 660) = 1.69, p <.05, η2=.13 but no main effect of condition, F(4,44) =2.13, p > .05, η2=.16,. Post hoc tests showed overall patterns consistent with faster learning (lower number of trials) resulting in less activity reduction. Condition 3 was significantly higher than condition 7 at 8, 10, 12, and 13 s ((t(11) = 2.3, p < .05, t(11) = 2.7, p < .05, t(11) = 2.4, p < .05; t(11) = 2.4, p < .05) and condition 4 was significantly higher than condition 7 at 10, 11, 12, 13, and 15 s (t(11) = 3.9, p < .05, t(11) = 4.3, p < .05, t(11) = 3.0, p < .05; t(11) = 3.2, p < .05, t(11) = 3.7, p < .05). In addition, at 11 s, 4 was also higher than 3, 5, and 6 (t(11) = 2.8, p < .05, t(11) = 2.8, p < .05; t(11) = 2.2, p < .05), and at 10 s 4 was higher than 3 (t(11) = 2.5, p < .05). This is consistent with an earlier shift to the default network when the rule was learned more quickly, and correspondingly a smaller overall decrease in activity in the default network.
Component 3
Component 3 showed both positive and negative loadings. As shown in Table 10 and Figure 4, the positive loadings included bilateral inferior parietal and lateral inferior frontal gyrus regions along with regions of the ventral striatum and brainstem. The negative loadings included medial frontal regions extending through the bilateral head of the caudate to the insula and superior temporal gyri. The ANOVA on the predictor weights revealed a main effect of time-point F(15, 165) = 3.8, p < .001, η2=.26, but no main effect of condition, F(4,44) = .74, p > .05, η2=.06, and no interaction between condition and time-point F(60, 660) = .78, p >.05, η2=.06. Although there was a significant effect of time point, there was no clear trend of increase or decreased activity across time point; overall activity in this component was fairly consistent, indicating that functions associated with this network might be required across the time course.
Table 10. Trial Number Conditions fMRI-CPCA Analysis, Component 3 loadings.
| Neural regions | Cluster volume(mm3) | Brodmann area for peak locations | MNI coordinate (X Y Z) for peak locations | Loading value | Network | |||
|---|---|---|---|---|---|---|---|---|
| Positive loadings | ||||||||
| 1 | R. Inferior Parietal Lobule | 13272 | 40 | 34 | -50 | 42 | 0.17957 | ECN |
| 2 | L. Inferior Parietal Lobule | 7352 | 40 | -48 | -42 | 46 | 0.166 | ECN |
| 3 | L. Inferior Frontal Gyrus | 1280 | 9 | -44 | 4 | 32 | 0.15827 | SA |
| 4 | R. Middle Frontal Gyrus | 712 | 9 | 48 | 32 | 34 | 0.12193 | SA |
| 5 | L. Parietal Lobe / Precuneus | 296 | 7 | -10 | -76 | 56 | 0.12144 | ECN |
| 6 | R. Inferior Frontal Gyrus | 64 | 9 | 46 | 6 | 28 | 0.1092 | SA |
| Negative loadings | ||||||||
| 1 | B. Medial Frontal gyrus | 59120 | 10 | -4 | 54 | 18 | -0.20624 | DMN |
| 2 | B. Anterior Cingulate | 41696 | 25 | 0 | 8 | -6 | -0.13748 | SA |
| 3 | L. Middle /Superior Temporal Gyrus | 7936 | 21 | -54 | -16 | -16 | -0.13033 | DMN |
| 4 | L. Cingulate Gyrus | 7440 | 31 | 0 | -52 | 26 | -0.13365 | DMN |
| 5 | L. Middle / Superior Temporal Gyrus | 6208 | 39 | -50 | -70 | 28 | -0.13823 | DMN |
| 6 | R. Middle Temporal Gyrus | 6112 | 38 | 48 | 2 | -42 | -0.1145 | DMN |
| 7 | R. Inferior Frontal Gyrus | 2600 | 47 | 44 | 26 | -14 | -0.10013 | SA |
| 8 | R. Superior Temporal Gyrus | 1720 | 22 | 64 | -52 | 10 | -0.10184 | DA |
| 9 | L. Superior Frontal Gyrus | 1184 | 6 | -8 | 16 | 68 | -0.09715 | ECN |
| 10 | R. Parietal Lobe / Postcentral Gyrus | 1120 | 34 | -40 | 74 | -0.10783 | DA | |
| 11 | L. Parahippocampal Gyrus | 1032 | 36 | -26 | -22 | -24 | -0.09282 | |
| 12 | R. Head of Caudate | 824 | 16 | 22 | -4 | -0.11956 | ECN | |
| 13 | L. Superior Temporal Gyrus | 648 | 41 | -46 | -30 | 6 | -0.09651 | SM |
| 14 | R. Middle /Superior Temporal Gyrus | 640 | 22 | 68 | -42 | 2 | -0.09533 | DMN |
| 15 | R. Temporal Lobe / Angular Gyrus | 632 | 39 | 54 | -68 | 30 | -0.08401 | DMN |
| 16 | R. Middle Temporal Gyrus | 392 | 21 | 66 | -28 | -10 | -0.09396 | DMN |
| 17 | L. Inferior Frontal Gyrus | 152 | 45 | -54 | 24 | 14 | -0.08546 | SA |
| 18 | L. Parietal Lobe / Postcentral Gyrus | 136 | 1 | -36 | -32 | 72 | -0.08742 | ECN |
| 19 | R. Posterior Cerebellum | 104 | 48 | -66 | -46 | -0.09422 | ECN | |
| 20 | L. Temporal Lobe / Sub-Gyral | 80 | 20 | -40 | -12 | -16 | -0.09154 | DMN |
Note: includes all clusters > 9 voxels; L = left, R = right, B = bilateral. Network refers to the intrinsic connectivity network with greatest overlap for the region. VS=Visual; SM=Somatomotor; DA=Dorsal Attention; SA=Salience; L=Limbic; DMN=Default Mode Network; ECN=Executive Control Network.
Figure 4.
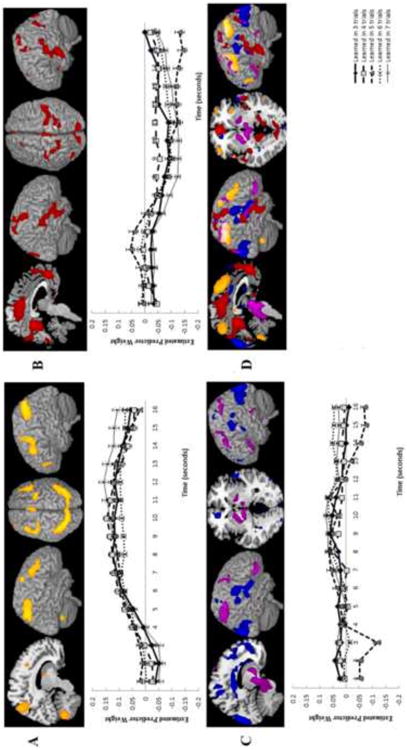
Components identified in the Trial Number Condition fMRI-CPCA analysis, in which variance was constrained by length of the rule learning epoch. Regions within each component are illustrated as a colored overlay on the MNI brain template in MRIcron. Components 1 (A) and 2 (B) had only positive loadings. In Component 3 (C), positive loadings are shown in red and negative in green. Graphs for each component show the estimated hemodynamic response across all voxels with positive loadings within the component for each condition across the first 16 seconds of each rule learning problem, beginning with the switch trial. Error bars show standard error. Bottom right (D) images show all components overlaid on the same rendered brain for comparison purposes. Colors follow those used in each individual component images.
Discussion
In this study we combined univariate and multivariate analyses to test hypotheses concerning recruitment of neural networks across different phases of a rule learning, application, and switching task. We hypothesized that switching would recruit the cortical salience network and the ventral striatum; univariate analyses found activity in ventral striatum across all switching conditions, accompanied by dorsal basal ganglia and visual cortical recruitment when switches were cued visually. Multivariate analyses found recruitment of a transient ventral striatal and limbic network at the time of switch and a separate visual network recruited for Externally cued switches (Figure 3 D and E). We also examined large scale activity patterns across phases of the task. Univariate comparisons found cognitive control and dorsal attention networks were active during rule learning in comparison with rule application; these regions were largely assigned to single components in the multivariate analyses (Component 1 in both analyses). Activity in these components increased steadily and maintained their activity across the hypothesis testing process (Figure 3A), and were differentially affected by learning speed, with an earlier peak for faster learning, and a more delayed plateau for the slowest learning speed (Learning trial number Figure 4A). During the rule application phase, activity in this component decreased, whereas there was a relative increase in activity in components related to somatomotor function (Figures 3B and 4B) and the default mode network (Figure 3C)
Recruitment of frontoparietal cognitive control networks in rule learning and application
Component 1 in both fMRI-CPCA analyses accounted for the largest proportion of variance. These components included regions characteristic of three different intrinsic networks defined in resting state studies: the cognitive control network (particularly the dorsolateral prefrontal, anterior prefrontal, and lateral parietal regions), the dorsal attention network (particularly the intraparietal sulcus) and the salience network (particularly the inferior frontal / anterior insula region and anterior cingulate). These networks often work together, and have sometimes been termed the “task active” network (Buckner et al., 2009) in contrast with the default network. The time course of component 1 in both fMRI-CPCA analyses showed a gradual increase and maintenance across the rule learning phase, followed by a decrease during rule application. Importantly, in the second fMRI-CPCA analysis component 1 was sensitive to length of the rule learning epoch, supporting its role in functions specific to rule learning.
The cognitive control network may play a number of roles in rule learning. One is as a hub (Cole et al., 2013), flexibly coupling with other networks. Another is through control mechanisms underlying working memory maintenance and manipulation; in the rule learning task, individual rules must be maintained, and manipulated to keep track of which have been tested and which have not. Previous studies have especially implicated similar regions of parietal and dorsolateral prefrontal cortex in working memory manipulation and maintenance for verbal information (Champod and Petrides, 2010; Marvel and Desmond, 2012).
The dorsal attention network is important for attention to external stimuli, in particular spatial processing, and for connections between stimuli and motor control (Szczepanski et al., 2013; Cieslik et al., 2011). Our task included spatial demands and conditional motor responses to the left or right side depending on the rule. The salience network is involved in detecting and orienting to salient external and internal stimuli and events (Menon, 2011; Power and Petersen, 2013; Power et al., 2011). These detection and orienting processes have both stimulus-specific and task general components; the later resulting in extended activity across task performance (Dosenbach et al., 2006; Olsen et al., 2013; Sestieri et al., 2014). This common pattern of extended activity across task performance may be one reason that the salience network and cognitive control network were identified as being in the same component.
It is important to note that our task is likely to recruit a number of cognitive functions, and thus recruitment of these networks cannot be associated with any one unique function. For example, the hypothesis testing phase likely demands that subjects generate hypotheses, maintain the current and previously tested hypotheses in working memory, and process negative feedback. Any of these factors might underlie differences between the hypothesis testing phase and the rule application phase, in which a single rule is maintained in working memory and negative feedback is not encountered.
The role of the ventral striatum and limbic network in switching
Several of the analyses indicate a special role for the ventral striatum in switching. In the univariate analysis, ventral striatum was the sole region identified in a conjunction analysis as being recruited for all three types of switching. The ventral striatum along with a number of other limbic regions, notably the parahippocampal gyrus, dopaminergic midbrain, and thalamus formed clusters in components identified in both fMRI-CPCA analyses. In the first fMRI-CPCA analysis looking at task related variance related to the three switching conditions this was component 4; in all three switching conditions, activity peaked sharply at the time of switching and then dropped down to baseline. In the second fMRI-CPCA analysis examining variance related to learning speed, the ventral striatum and brainstem were parts of the positively weighted loadings in component 3 and maintained a similar time course across time in these conditions. It should be noted that across all analyses the ventral striatum also showed a significantly different pattern of activity from more dorsal regions of the head of the caudate which were active across rule learning and participated in component 1 with lateral frontal and parietal cognitive control regions in both fMRI-CPCA analyses.
Previous studies have also found switching related activity in the ventral striatum. Researchers studying the WCST report activity in the caudate in preparing to shift, and the putamen in first trial after the shift (Monchi et al., 2001;Simard et al., 2011). Although they identified these loci of activity as being in the dorsal striatum, the reported coordinates fall around z = 0, near the (arbitrary) border of dorsal and ventral striatum near z = 0, and quite close to the region identified in our study centered at z = -8. Similarly, regions of the head of the caudate reported by Seger and Cincotta (2006) that rose suddenly at the beginning of each rule learning task were also near z = 0 and overlapped with this ventral striatal region. The ventral striatum has also been associated with switching in reversal learning tasks, in which the organism has only two stimuli to choose from and must switch to choosing the other stimulus. Animal studies have found that reversal learning requires orbitofrontal cortex and the ventral striatum (Robbins and Roberts, 2007; Dalton et al., 2014), though reversal learning also affects activity in striatal and lateral prefrontal regions (Pasupathy and Miller, 2005). Human neuroimaging studies have identified a reversal learning neural network that includes ventral striatum along with a cortical regions including ventrolateral PFC / anterior insula, anterior cingulate, parietal cortex, and dorsolateral prefrontal cortex (Cools et al., 2002; D'Cruz et al., 2011; Freyer et al., 2009; Xue et al., 2008). Technically, our task was not a reversal learning task (in which reinforcement to the exact same stimuli is reversed), but rather an extradimensional shift task (in which subjects shift to making discriminations on a new stimulus dimension). The latter has been widely used in animal research, but only one functional imaging study of humans has been published (Rogers et al., 2000) which found extradimensional shifts were associated with greater frontal lobe recruitment, whereas reversals were associated with caudate recruitment. However, it used a block design and did not compare each condition to a neutral baseline, so it is impossible to determine regions (such as ventral striatum) that might potentially be shared across tasks.
Although the ventral striatum is clearly associated with switching, it is unclear what specific function related to switching it carries out. The best studied task to elicit ventral striatal activity, reversal learning, is deceptively simple. It includes a large number of potential cognitive functions, including prediction error associated with unexpected receipt of negative feedback and attending to and assessing new behavioral options, as well as functions related to learning (and unlearning) new approach (and avoidance) behaviors (Greening et al., 2011). Our task includes a number of these processes as well. However, the time course of the activity in the ventral striatum (sharp increase at the first switch trial) implies that its contributions to task performance are elicited immediately, rather than extending over multiple trials, as would be expected for learning related functions. This idea that the ventral striatum is not involved in rule learning is consistent with studies by Cools and colleagues (Cools et al., 2004; Dang et al., 2012) that found ventral striatum activity in a task in which subjects had to switch between objects but were not required to learn a new rule. What then are potential switching functions elicited on the very first trial? One role could be related to prediction error elicited by the negative feedback in the first switching trial; prediction error is likely to be large because it comes at the end of the string of positive feedback trials that characterizes the rule application period. The ventral striatum has been associated with prediction error in many studies (Seger et al., 2010; Garrison et al., 2013). However, prediction error is present throughout the rule learning phase, albeit to a lower degree.
Another possibility is that the ventral striatum contributes to identifying behaviorally or motivationally important stimuli, in our task the switch cues. The basal ganglia are sensitive to novelty and surprise (Redgrave et al., 2013; Schiffer et al., 2012). On a cortical level, identifying these stimuli is generally associated with medial frontal and inferior frontal / anterior insula regions of the salience network (Seeley et al., 2007). The ventral striatum has been associated in previous studies with the salience network, and previous studies of the ventral striatum typically find that limbic regions in general (Seeley et al., 2007), and the ventral striatum in particular (Choi et al., 2012), coactivate with cortical regions in the salience network. Furthermore, connectivity within this network has been associated with individual differences in anxiety and impulsivity within the midbrain (Seeley et al., 2007;Jung et al., 2014).
In our study the primary cortical regions of the salience network (anterior cingulate and fronto-insular cortex) showed a complicated pattern of association. In the univariate analysis these regions were more active for switching than for hypothesis testing, but were also more active overall during rule learning (switching and hypothesis testing combined) than rule application. In the multivariate analysis, these regions correlated with both the executive control network (fMRI-CPCA1 and 2 components 1) and with the ventral striatum and limbic regions (fMRI-CPCA 1 component 4; fMRI-CPCA 2 component 3). These activity patterns may reflect the multiple functions of the salience network in both responding to individual stimuli (e.g., in our task, the switch cues and/or negative feedback) and searching or monitoring for potentially important stimuli across task (Olsen et al., 2013;Sestieri et al., 2014).
Visual versus feedback cued switching
We also manipulated the visual indicators that a rule switch is necessary. In all cases subjects received feedback consistent with the new rule, and therefore began to receive negative feedback. In the feedback cued condition, no visual cue was given. In the feature cued condition switching the cue was a combination of salient feature changes in the stimuli (change in color and letter dimensions), whereas in the externally cued condition it was a change in a nearby part of the display not inherent to the stimuli itself. Visual regions were more active for both visually cued conditions in comparison with the feedback only condition, and greater for the externally cued condition than the feature cued condition. Visual regions were also involved in Component 5, which revealed a complementary pattern of activity across shifting and rule learning time courses, with greatest activity in externally cued and lowest in feedback cued, with intermediate in feature cued. It is unclear why the two visual conditions differed, and why activity associated with the externally cued condition was greater than the feature cued condition, even though the latter involved more visual changes overall. One possibility is that the externally cued condition required broader spatial attention. Frontostriatal regions overall were also more active for the visually cued conditions than feedback only, including a region of the caudate and putamen just superior to the ventral region recruited by all three conditions, and dorsolateral prefrontal and parietal. All these regions participated in Component 1, and the time course there is consistent in that higher total activity was reached for the visually cued conditions than the feedback only condition.
Univariate versus multivariate results
In this study we utilized both univariate with multivariate analyses, which each allow for different types of inferences. Univariate analyses provide information about activity occurring within specific regions. The multivariate method we used, fMRI-CPCA, identifies components that each reflect a pattern of task-related variance derived from all voxels in the brain. The maps derived from fMRI-CPCA analyses, therefore, provide information about regions that cooperate to subserve a particular function. Furthermore, univariate analyses make specific assumptions about the relationship between the design matrix and the BOLD response, whereas fMRI-CPCA uncovers patterns of task-related variance in a data-driven manner. fMRI-CPCA is not able to directly measure effective connectivity; instead, it demonstrates task related coactivation, which could be driven by influence of other regions, including top-down influence and stimulus-evoked influences (e.g., see Woodward et al., 2013; Al-Andros and colleagues, 2012)
In the present paper, we used univariate analyses to characterize activity within specific neural regions, and fMRI-CPCA to investigate how distributed regions coordinate to subserve different processes. Overall, the results were complementary. Both univariate and multivariate indicated a role for a frontoparietal cognitive control network in rule learning; univariate indicated activity was greater during rule learning than application, whereas fMRI-CPCA indicated that these areas showed correlated patterns of activity that were condition related, increasing in activity during the rule learning phase, and sensitive to number of trials for learning. For switching, both univariate and multivariate supported an important role for the ventral striatum; univariate found greater activity in all switching conditions, and fMRI-CPCA found that ventral striatum and other limbic regions showed correlated increases in activity at the time of switch when variance was constrained by switching condition. There were a few small but interesting discrepancies. The univariate analysis did not identify cerebellar activity in the rule learning > rule application analysis, but the multivariate analyses found functional connectivity between the cerebellum and regions within the cognitive control network (Components 1 in both fMRI-CPCA analyses). There were also interesting contrasts between the two fMRI-CPCA analyses potentially due to the differences in the aspect of task related conditions that constrained the variance. For the ventral striatum, when variance was constrained by switch condition, there was a spike in activity at the time of switch, whereas activity did not change across time point in a regular manner when variance was constrained by conditions defined on the basis of learning speed.
Summary and conclusion
We identified a pattern of dynamic recruitment of different frontoparietal networks during an continuous rule learning and switching task. Detecting the need to switch to a new rule was associated with the ventral striatum along with other regions in a limbic network. As subjects performed hypothesis testing within the rule learning phase, activity increased in frontoparietal cognitive control and attention networks. After the rule was learned the cognitive control networks decreased in activity, accompanied by a relative increase in the default mode and sensorimotor networks.
Table 6. Switch Conditions fMRI-CPCA Analysis, Component 4 loadings.
| Neural regions | Cluster volume(mm3) | Brodmann area for peak locations | MNI coordinate(X Y Z) for peak locations | Loading value | Network | |||
|---|---|---|---|---|---|---|---|---|
| 1 | B. Ventral striatum, thalamus, and Parahippocampal Gyrus | 80680 | 30 | 18 | -38 | -2 | 0.15 | |
| 2 | L. Inferior Frontal Gyrus | 264 | 47 | -40 | 20 | -6 | 0.09 | SA |
| 3 | R. Inferior Frontal Gyrus | 256 | 47 | 48 | 28 | -4 | 0.10 | SA |
| 4 | R. Middle Frontal Gyrus | 128 | 11 | 30 | 34 | -12 | 0.09 | ECN |
| 5 | R. Middle Temporal Gyrus | 80 | 21 | 54 | -2 | -24 | 0.09 | DMN |
| 6 | R. Middle Temporal Gyrus | 80 | 22 | 64 | -46 | 4 | 0.09 | DMN |
Note: includes all clusters > 9 voxels. L = left, R = right, B = bilateral. Network refers to the intrinsic connectivity network with greatest overlap for the region. VS=Visual; SM=Somatomotor; DA=Dorsal Attention; SA=Salience; L=Limbic; DMN=Default Mode Network; ECN=Executive Control Network.
Table 8. Trial Number Conditions fMRI-CPCA Analysis, Component 1 loadings.
| Neural regions | Cluster volume(mm3) | Brodmann area for peak locations | MNI coordinate (X Y Z) for peak locations | Loading value | Network | |||
|---|---|---|---|---|---|---|---|---|
| 1 | L. Superior Parietal Lobule | 64528 | 7 | -36 | -56 | 48 | 0.3763 | DA |
| 2 | R. Middle Frontal Gyrus | 30864 | 6 | 30 | 8 | 62 | 0.32778 | ECN |
| 3 | R. Cerebellum | 27296 | 38 | -68 | -28 | 0.32372 | ECN | |
| 4 | L. Middle Frontal Gyrus | 20984 | 9 | -42 | 28 | 36 | 0.35976 | ECN |
| 5 | B. Superior frontal gyrus | 10136 | 6 | 0 | 16 | 54 | 0.33983 | ECN |
| 6 | L. Middle Frontal Gyrus | 6080 | 10 | -38 | 54 | 8 | 0.32509 | ECN |
| 7 | L. Inferior Frontal Gyrus | 1344 | 47 | -52 | 16 | -4 | 0.23751 | SA |
| 8 | R. Insula | 888 | 13 | 34 | 22 | -2 | 0.27081 | SA |
| 9 | L. Insula | 592 | 13 | -32 | 20 | 2 | 0.25175 | SA |
| 10 | R. Body of Caudate | 328 | 12 | 2 | 10 | 0.22142 | ECN | |
| 11 | B. Cingulate Gyrus | 184 | 23 | 0 | -30 | 28 | 0.22476 | ECN |
| 12 | L. Body of Caudate | 112 | -14 | 2 | 12 | 0.21844 | ECN | |
Note: Includes all clusters > 9 voxels; L = left, R = right, B = bilateral. Network refers to the intrinsic connectivity network with greatest overlap for the region. VS=Visual; SM=Somatomotor; DA=Dorsal Attention; SA=Salience; L=Limbic; DMN=Default Mode Network; ECN=Executive Control Network.
Table 9. Trial Number Conditions fMRI-CPCA Analysis, Component 2 loadings.
| Neural regions | Cluster volume(mm3) | Brodmann area for peak locations | MNI coordinate (X Y Z) for peak locate ons | Loading value | Network | |||
|---|---|---|---|---|---|---|---|---|
| 1 | R. Inferior Parietal Lobule | 124016 | 40 | 60 | -32 | 26 | 0.19707 | SM |
| 2 | L. Occipital Lobe / Cuneus | 33440 | 19 | -10 | -92 | 32 | 0.21749 | VS |
| 3 | L. Posterior Lobe, Cerebellum | 2536 | -20 | -76 | -12 | 0.14075 | DMN | |
| 4 | R. Middle and Superior Temporal Gyrus | 920 | 39 | 50 | -74 | 10 | 0.14423 | SM |
| 5 | R. Insula / Superior Temporal | 704 | 13 | 38 | 6 | 10 | 0.1421 | SM |
| 6 | R. Posterior lobe, Cerebellum | 624 | 20 | -64 | -14 | 0.13293 | DMN | |
| 7 | L. Insula / Superior Temporal | 480 | 13 | -38 | 4 | 12 | 0.13565 | SM |
| 8 | B. Medial Frontal Gyrus | 320 | 10 | -4 | 54 | -4 | 0.13221 | DMN |
| 9 | L. Middle and Superior Temporal Gyrus | 200 | 19 | -38 | -60 | 14 | 0.12547 | VS |
Note: includes all clusters > 9 voxels; L = left, R = right, B = bilateral. Network refers to the intrinsic connectivity network with greatest overlap for the region. VS=Visual; SM=Somatomotor; DA=Dorsal Attention; SA=Salience; L=Limbic; DMN=Default Mode Network; ECN=Executive Control Network.
Highlights.
Univariate and multivariate identification of networks in rule learning and switching
Learning was associated with a fronto-parietal-striatal cognitive control network
Rule application was associated with default mode and somatosensory networks
Switching was associated with a ventral striatal limbic network
Acknowledgments
This study was supported by the National Institutes of Health, USA (R01 MH079182), the Chiang Jiang Scholars program of the Ministry of Education of China, and the National Natural Science Foundation of China (31371050).
Footnotes
Publisher's Disclaimer: This is a PDF file of an unedited manuscript that has been accepted for publication. As a service to our customers we are providing this early version of the manuscript. The manuscript will undergo copyediting, typesetting, and review of the resulting proof before it is published in its final citable form. Please note that during the production process errors may be discovered which could affect the content, and all legal disclaimers that apply to the journal pertain.
References
- Al-Aidroos N, Said CP, Turk-Browne NB. Top-down attention switches coupling between low-level and high-level areas of human visual cortex. Proc Natl Acad Sci U S A. 2012;109:14675–14680. doi: 10.1073/pnas.1202095109. [DOI] [PMC free article] [PubMed] [Google Scholar]
- Andrews-Hanna JR, Reidler JS, Sepulcre J, Poulin R, Buckner RL. Functional-anatomic fractionation of the brain's default network. Neuron. 2010;65:550–562. doi: 10.1016/j.neuron.2010.02.005. [DOI] [PMC free article] [PubMed] [Google Scholar]
- Berg EA. A simple objective technique for measuring flexibility in thinking. Journal of General Psychology. 1948;39:15–22. doi: 10.1080/00221309.1948.9918159. [DOI] [PubMed] [Google Scholar]
- Braunlich K, Gomez-Lavin J, Seger CA. Frontoparietal networks involved in categorization and item working memory. Neuroimage. 2014;107C:146–162. doi: 10.1016/j.neuroimage.2014.11.051. [DOI] [PMC free article] [PubMed] [Google Scholar]
- Buckner RL, Krienen FM, Castellanos A, Diaz JC, Yeo BTT. The organization of the human cerebellum estimated by intrinsic functional connectivity. J Neurophysiol. 2011;106:2322–2345. doi: 10.1152/jn.00339.2011. [DOI] [PMC free article] [PubMed] [Google Scholar]
- Buckner RL, Krienen FM, Yeo BTT. Opportunities and limitations of intrinsic functional connectivity MRI. Nat Neurosci. 2013;16:832–837. doi: 10.1038/nn.3423. [DOI] [PubMed] [Google Scholar]
- Buckner RL, Sepulcre J, Talukdar T, Krienen FM, Liu H, Hedden T, Andrews-Hanna JR, Sperling RA, Johnson KA. Cortical hubs revealed by intrinsic functional connectivity: mapping, assessment of stability, and relation to Alzheimer's disease. J Neurosci. 2009;29:1860–1873. doi: 10.1523/JNEUROSCI.5062-08.2009. [DOI] [PMC free article] [PubMed] [Google Scholar]
- Champod AS, Petrides M. Dissociation within the frontoparietal network in verbal working memory: a parametric functional magnetic resonance imaging study. J Neurosci. 2010;30:3849–3856. doi: 10.1523/JNEUROSCI.0097-10.2010. [DOI] [PMC free article] [PubMed] [Google Scholar]
- Chen AC, Oathes DJ, Chang C, Bradley T, Zhou ZW, Williams LM, Glover GH, Deisseroth K, Etkin A. Causal interactions between fronto-parietal central executive and default-mode networks in humans. Proc Natl Acad Sci U S A. 2013;110:19944–19949. doi: 10.1073/pnas.1311772110. [DOI] [PMC free article] [PubMed] [Google Scholar]
- Choi EY, Yeo BTT, Buckner RL. The organization of the human striatum estimated by intrinsic functional connectivity. J Neurophysiol. 2012;108:2242–2263. doi: 10.1152/jn.00270.2012. [DOI] [PMC free article] [PubMed] [Google Scholar]
- Cieslik EC, Zilles K, Grefkes C, Eickhoff SB. Dynamic interactions in the fronto-parietal network during a manual stimulus-response compatibility task. Neuroimage. 2011;58:860–869. doi: 10.1016/j.neuroimage.2011.05.089. [DOI] [PMC free article] [PubMed] [Google Scholar]
- Cole MW, Reynolds JR, Power JD, Repovs G, Anticevic A, Braver TS. Multi-task connectivity reveals flexible hubs for adaptive task control. Nat Neurosci. 2013;16:1348–1355. doi: 10.1038/nn.3470. [DOI] [PMC free article] [PubMed] [Google Scholar]
- Cools R, Clark L, Owen AM, Robbins TW. Defining the neural mechanisms of probabilistic reversal learning using event-related functional magnetic resonance imaging. J Neurosci. 2002;22:4563–4567. doi: 10.1523/JNEUROSCI.22-11-04563.2002. [DOI] [PMC free article] [PubMed] [Google Scholar]
- Cools R, Clark L, Robbins TW. Differential responses in human striatum and prefrontal cortex to changes in object and rule relevance. J Neurosci. 2004;24:1129–1135. doi: 10.1523/JNEUROSCI.4312-03.2004. [DOI] [PMC free article] [PubMed] [Google Scholar]
- Crescentini C, Seyed-Allaei S, De Pisapia N, Jovicich J, Amati D, Shallice T. Mechanisms of rule acquisition and rule following in inductive reasoning. J Neurosci. 2011;31:7763–7774. doi: 10.1523/JNEUROSCI.4579-10.2011. [DOI] [PMC free article] [PubMed] [Google Scholar]
- Dalton GL, Phillips AG, Floresco SB. Preferential involvement by nucleus accumbens shell in mediating probabilistic learning and reversal shifts. J Neurosci. 2014;34:4618–4626. doi: 10.1523/JNEUROSCI.5058-13.2014. [DOI] [PMC free article] [PubMed] [Google Scholar]
- Dang LC, Donde A, Madison C, O'Neil JP, Jagust WJ. Striatal dopamine influences the default mode network to affect shifting between object features. J Cogn Neurosci. 2012;24:1960–1970. doi: 10.1162/jocn_a_00252. [DOI] [PMC free article] [PubMed] [Google Scholar]
- D'Cruz AM, Ragozzino ME, Mosconi MW, Pavuluri MN, Sweeney JA. Human reversal learning under conditions of certain versus uncertain outcomes. Neuroimage. 2011;56:315–322. doi: 10.1016/j.neuroimage.2011.01.068. [DOI] [PMC free article] [PubMed] [Google Scholar]
- Dosenbach NU, Visscher KM, Palmer ED, Miezin FM, Wenger KK, Kang HC, Burgund ED, Grimes AL, Schlaggar BL, Petersen SE. A core system for the implementation of task sets. Neuron. 2006;50:799–812. doi: 10.1016/j.neuron.2006.04.031. [DOI] [PMC free article] [PubMed] [Google Scholar]
- Duncan J. An adaptive coding model of neural function in prefrontal cortex. Nature Reviews Neuroscience. 2001;2:820–829. doi: 10.1038/35097575. [DOI] [PubMed] [Google Scholar]
- Freyer T, Valerius G, Kuelz AK, Speck O, Glauche V, Hull M, Voderholzer U. Test-retest reliability of event-related functional MRI in a probabilistic reversal learning task. Psychiatry Res. 2009;174:40–46. doi: 10.1016/j.pscychresns.2009.03.003. [DOI] [PubMed] [Google Scholar]
- Garrison J, Erdeniz B, Done J. Prediction error in reinforcement learning: A meta-analysis of neuroimaging studies. Neurosci Biobehav Rev. 2013;37:1297–1310. doi: 10.1016/j.neubiorev.2013.03.023. [DOI] [PubMed] [Google Scholar]
- Goebel R, Esposito F, Formisano E. Analysis of functional image analysis contest (FIAC) data with brainvoyager QX: From single-subject to cortically aligned group general linear model analysis and self-organizing group independent component analysis. Hum Brain Mapp. 2006;27:392–401. doi: 10.1002/hbm.20249. [DOI] [PMC free article] [PubMed] [Google Scholar]
- Gordon EM, Stollstorff M, Vaidya CJ. Using spatial multiple regression to identify intrinsic connectivity networks involved in working memory performance. Hum Brain Mapp. 2012;33:1536–1552. doi: 10.1002/hbm.21306. [DOI] [PMC free article] [PubMed] [Google Scholar]
- Greening SG, Finger EC, Mitchell DGV. Parsing decision making processes in prefrontal cortex: response inhibition, overcoming learned avoidance, and reversal learning. Neuroimage. 2011;54:1432–1441. doi: 10.1016/j.neuroimage.2010.09.017. [DOI] [PubMed] [Google Scholar]
- Haber SN. The primate basal ganglia: parallel and integrative networks. J Chem Neuroanat. 2003;26:317–330. doi: 10.1016/j.jchemneu.2003.10.003. [DOI] [PubMed] [Google Scholar]
- Hartstra E, Oldenburg JFE, Van Leijenhorst L, Rombouts SARB, Crone EA. Brain regions involved in the learning and application of reward rules in a two-deck gambling task. Neuropsychologia. 2010 doi: 10.1016/j.neuropsychologia.2010.01.012. [DOI] [PubMed] [Google Scholar]
- Hellyer PJ, Shanahan M, Scott G, Wise RJS, Sharp DJ, Leech R. The Control of Global Brain Dynamics: Opposing Actions of Frontoparietal Control and Default Mode Networks on Attention. J Neurosci. 2014;34:451–461. doi: 10.1523/JNEUROSCI.1853-13.2014. [DOI] [PMC free article] [PubMed] [Google Scholar]
- Jung YC, Schulte T, Müller-Oehring EM, Hawkes W, Namkoong K, Pfefferbaum A, Sullivan EV. Synchrony of anterior cingulate cortex and insular-striatal activation predicts ambiguity aversion in individuals with low impulsivity. Cereb Cortex. 2014;24:1397–1408. doi: 10.1093/cercor/bht008. [DOI] [PMC free article] [PubMed] [Google Scholar]
- Kayser AS, D'Esposito M. Abstract rule learning: the differential effects of lesions in frontal cortex. Cereb Cortex. 2013;23:230–240. doi: 10.1093/cercor/bhs013. [DOI] [PMC free article] [PubMed] [Google Scholar]
- Konishi S, Kawazu M, Uchida I, Kikyo H, Asakura I, Miyashita Y. Contribution of working memory to transient activation in human inferior prefrontal cortex during performance of the Wisconsin Card Sorting Test. Cereb Cortex. 1999;9:745–753. doi: 10.1093/cercor/9.7.745. [DOI] [PubMed] [Google Scholar]
- Krienen FM, Yeo BT, Buckner RL. Reconfigurable task-dependent functional coupling modes cluster around a core functional architecture. Philos Trans R Soc Lond B Biol Sci. 2014;369 doi: 10.1098/rstb.2013.0526. [DOI] [PMC free article] [PubMed] [Google Scholar]
- Landmann C, Dehaene S, Pappata S, Jobert A, Bottlaender M, Roumenov D, Le Bihan D. Dynamics of prefrontal and cingulate activity during a reward-based logical deduction task. Cereb Cortex. 2007;17:749–759. doi: 10.1093/cercor/bhk028. [DOI] [PubMed] [Google Scholar]
- Lavigne KM, Rapin LA, Metzak PD, Whitman JC, Jung K, Dohen M, Loevenbruck H, Woodward TS. Left-dominant temporal-frontal hypercoupling in schizophrenia patients with hallucinations during speech perception. Schizophrenia Bulletin. 2015;41(1):259–267. doi: 10.1093/schbul/sbu004. [DOI] [PMC free article] [PubMed] [Google Scholar]
- Levine MA. Cognitive theory of learning. Hillsdale, NJ: Lawrence Erlbaum; 1975. [Google Scholar]
- Lie CH, Specht K, Marshall JC, Fink GR. Using fMRI to decompose the neural processes underlying the Wisconsin Card Sorting Test. Neuroimage. 2006;30:1038–1049. doi: 10.1016/j.neuroimage.2005.10.031. [DOI] [PubMed] [Google Scholar]
- Marvel CL, Desmond JE. From storage to manipulation: How the neural correlates of verbal working memory reflect varying demands on inner speech. Brain Lang. 2012;120:42–51. doi: 10.1016/j.bandl.2011.08.005. [DOI] [PMC free article] [PubMed] [Google Scholar]
- Menon V. Large-scale brain networks and psychopathology: a unifying triple network model. Trends Cogn Sci. 2011;15:483–506. doi: 10.1016/j.tics.2011.08.003. [DOI] [PubMed] [Google Scholar]
- Metzak P, Feredoes E, Takane Y, Wang L, Weinstein S, Cairo T, Ngan ETC, Woodward TS. Constrained principal component analysis reveals functionally connected load-dependent networks involved in multiple stages of working memory. Hum Brain Mapp. 2011;32:856–871. doi: 10.1002/hbm.21072. [DOI] [PMC free article] [PubMed] [Google Scholar]
- Metzak PD, Riley J, Wang L, Whitman JC, Ngan ETC, Woodward TS. Decreased efficiency of task-positive and task-negative networks during working memory in schizophrenia. Schizophr Bull. 2012;38:803–813. doi: 10.1093/schbul/sbq154. [DOI] [PMC free article] [PubMed] [Google Scholar]
- Monchi O, Petrides M, Petre V, Worsley K, Dagher A. Wisconsin Card Sorting revisited: distinct neural circuits participating in different stages of the task identified by event-related functional magnetic resonance imaging. J Neurosci. 2001;21:7733–7741. doi: 10.1523/JNEUROSCI.21-19-07733.2001. [DOI] [PMC free article] [PubMed] [Google Scholar]
- Nomura EM, Gratton C, Visser RM, Kayser A, Perez F, D'Esposito M. Double dissociation of two cognitive control networks in patients with focal brain lesions. Proc Natl Acad Sci U S A. 2010;107:12017–12022. doi: 10.1073/pnas.1002431107. [DOI] [PMC free article] [PubMed] [Google Scholar]
- Olsen A, Ferenc Brunner J, Evensen KAI, Garzon B, Landrø NI, Håberg AK. The functional topography and temporal dynamics of overlapping and distinct brain activations for adaptive task control and stable task-set maintenance during performance of an fMRI-adapted clinical continuous performance test. J Cogn Neurosci. 2013;25:903–919. doi: 10.1162/jocn_a_00358. [DOI] [PubMed] [Google Scholar]
- Pasupathy A, Miller EK. Different time courses of learning-related activity in the prefrontal cortex and striatum. Nature. 2005;433:873–876. doi: 10.1038/nature03287. [DOI] [PubMed] [Google Scholar]
- Power JD, Cohen AL, Nelson SM, Wig GS, Barnes KA, Church JA, Vogel AC, Laumann TO, Miezin FM, Schlaggar BL, Petersen SE. Functional network organization of the human brain. Neuron. 2011;72:665–678. doi: 10.1016/j.neuron.2011.09.006. [DOI] [PMC free article] [PubMed] [Google Scholar]
- Power JD, Petersen SE. Control-related systems in the human brain. Curr Opin Neurobiol. 2013;23:223–228. doi: 10.1016/j.conb.2012.12.009. [DOI] [PMC free article] [PubMed] [Google Scholar]
- Redgrave P, Gurney K, Stafford T, Thirkettle M, Lewis J. Intrinsically Motivated Learning in Natural and Artificial Systems. Springer; 2013. The role of the basal ganglia in discovering novel actions; pp. 129–150. [Google Scholar]
- Robbins TW, Roberts AC. Differential regulation of fronto-executive function by the monoamines and acetylcholine. Cereb Cortex. 2007;17(Suppl 1):i151–i160. doi: 10.1093/cercor/bhm066. [DOI] [PubMed] [Google Scholar]
- Rogers RD, Andrews TC, Grasby PM, Brooks DJ, Robbins TW. Contrasting cortical and subcortical activations produced by attentional-set shifting and reversal learning in humans. J Cogn Neurosci. 2000;12:142–162. doi: 10.1162/089892900561931. [DOI] [PubMed] [Google Scholar]
- Schiffer AM, Ahlheim C, Wurm MF, Schubotz RI. Surprised at all the entropy: hippocampal, caudate and midbrain contributions to learning from prediction errors. PLoS One. 2012;7:e36445. doi: 10.1371/journal.pone.0036445. [DOI] [PMC free article] [PubMed] [Google Scholar]
- Seeley WW, Menon V, Schatzberg AF, Keller J, Glover GH, Kenna H, Reiss AL, Greicius MD. Dissociable intrinsic connectivity networks for salience processing and executive control. J Neurosci. 2007;27:2349–2356. doi: 10.1523/JNEUROSCI.5587-06.2007. [DOI] [PMC free article] [PubMed] [Google Scholar]
- Seger CA, Cincotta CM. Dynamics of frontal, striatal, and hippocampal systems during rule learning. Cereb Cortex. 2006;16:1546–1555. doi: 10.1093/cercor/bhj092. [DOI] [PubMed] [Google Scholar]
- Seger CA, Peterson EJ, Cincotta CM, Lopez-Paniagua D, Anderson CW. Dissociating the contributions of independent corticostriatal systems to visual categorization learning through the use of reinforcement learning modeling and Granger causality modeling. Neuroimage. 2010;50:644–656. doi: 10.1016/j.neuroimage.2009.11.083. [DOI] [PMC free article] [PubMed] [Google Scholar]
- Sestieri C, Corbetta M, Spadone S, Romani GL, Shulman GL. Domain-general Signals in the Cingulo-opercular Network for Visuospatial Attention and Episodic Memory. J Cogn Neurosci. 2014;26:551–568. doi: 10.1162/jocn_a_00504. [DOI] [PMC free article] [PubMed] [Google Scholar]
- Shirer WR, Ryali S, Rykhlevskaia E, Menon V, Greicius MD. Decoding subject-driven cognitive states with whole-brain connectivity patterns. Cereb Cortex. 2012;22:158–165. doi: 10.1093/cercor/bhr099. [DOI] [PMC free article] [PubMed] [Google Scholar]
- Simard F, Joanette Y, Petrides M, Jubault T, Madjar C, Monchi O. Fronto-striatal contribution to lexical set-shifting. Cereb Cortex. 2011;21:1084–1093. doi: 10.1093/cercor/bhq182. [DOI] [PubMed] [Google Scholar]
- Spreng RN, Sepulcre J, Turner GR, Stevens WD, Schacter DL. Intrinsic architecture underlying the relations among the default, dorsal attention, and frontoparietal control networks of the human brain. J Cogn Neurosci. 2013;25:74–86. doi: 10.1162/jocn_a_00281. [DOI] [PMC free article] [PubMed] [Google Scholar]
- Sridharan D, Levitin DJ, Menon V. A critical role for the right fronto-insular cortex in switching between central-executive and default-mode networks. Proc Natl Acad Sci U S A. 2008;105:12569–12574. doi: 10.1073/pnas.0800005105. [DOI] [PMC free article] [PubMed] [Google Scholar]
- Szczepanski SM, Pinsk MA, Douglas MM, Kastner S, Saalmann YB. Functional and structural architecture of the human dorsal frontoparietal attention network. Proc Natl Acad Sci U S A. 2013;110:15806–15811. doi: 10.1073/pnas.1313903110. [DOI] [PMC free article] [PubMed] [Google Scholar]
- Uddin LQ. Salience processing and insular cortical function and dysfunction. Nat Rev Neurosci. 2015;16:55–61. doi: 10.1038/nrn3857. [DOI] [PubMed] [Google Scholar]
- Verstynen TD, Badre D, Jarbo K, Schneider W. Microstructural organizational patterns in the human corticostriatal system. J Neurophysiol. 2012;107:2984–2995. doi: 10.1152/jn.00995.2011. [DOI] [PMC free article] [PubMed] [Google Scholar]
- Whitman JC, Metzak PD, Lavigne KM, Woodward TS. Functional connectivity in a frontoparietal network involving the dorsal anterior cingulate cortex underlies decisions to accept a hypothesis. Neuropsychologia. 2013;51:1132–1141. doi: 10.1016/j.neuropsychologia.2013.02.016. [DOI] [PubMed] [Google Scholar]
- Woodward TS, Feredoes E, Metzak PD, Takane Y, Manoach DS. Epoch-specific functional networks involved in working memory. Neuroimage. 2013;65:529–539. doi: 10.1016/j.neuroimage.2012.09.070. [DOI] [PubMed] [Google Scholar]
- Xue G, Ghahremani DG, Poldrack RA. Neural substrates for reversing stimulus-outcome and stimulus-response associations. J Neurosci. 2008;28:11196–11204. doi: 10.1523/JNEUROSCI.4001-08.2008. [DOI] [PMC free article] [PubMed] [Google Scholar]
- Yeo BTT, Krienen FM, Sepulcre J, Sabuncu MR, Lashkari D, Hollinshead M, Roffman JL, Smoller JW, Zöllei L, Polimeni JR, Fischl B, Liu H, Buckner RL. The organization of the human cerebral cortex estimated by intrinsic functional connectivity. J Neurophysiol. 2011;106:1125–1165. doi: 10.1152/jn.00338.2011. [DOI] [PMC free article] [PubMed] [Google Scholar]