

Abstract
HIV-1 RNA monitoring, both before and during antiretroviral therapy, is an integral part of HIV management worldwide. Measurements of HIV-1 viral loads are expected to assess the copy numbers of all common HIV-1 subtypes accurately and to be equally sensitive at different viral loads. In this study, we compared for the first time the performance of the NucliSens v2.0, RealTime HIV-1, Aptima HIV-1 Quant Dx, and Xpert HIV-1 viral load assays. Plasma samples (n = 404) were selected on the basis of their NucliSens v2.0 viral load results and HIV-1 subtypes. Concordance, linear regression, and Bland-Altman plots were assessed, and mixed-model analysis was utilized to compare the analytical performance of the assays for different HIV-1 subtypes and for low and high HIV-1 copy numbers. Overall, high concordance (>83.89%), high correlation values (Pearson r values of >0.89), and good agreement were observed among all assays, although the Xpert and Aptima assays, which provided the most similar outputs (estimated mean viral loads of 2.67 log copies/ml [95% confidence interval [CI], 2.50 to 2.84 log copies/ml] and 2.68 log copies/ml [95% CI, 2.49 to 2.86 log copies/ml], respectively), correlated best with the RealTime assay (89.8% concordance, with Pearson r values of 0.97 to 0.98). These three assays exhibited greater precision than the NucliSens v2.0 assay. All assays were equally sensitive for subtype B and AG/G samples and for samples with viral loads of 1.60 to 3.00 log copies/ml. The NucliSens v2.0 assay underestimated A1 samples and those with viral loads of >3.00 log copies/ml. The RealTime assay tended to underquantify subtype C (compared to the Xpert and Aptima assays) and subtype A1 samples. The Xpert and Aptima assays were equally efficient for detection of all subtypes and viral loads, which renders these new assays most suitable for clinical HIV laboratories.
INTRODUCTION
HIV-1 viral load testing is an integral part of HIV-1 management worldwide, both before and during antiretroviral therapy (1). Plasma HIV-1 RNA measurements are expected to assess viral copy numbers accurately, to be sensitive and linear with both low and high HIV-1 viral loads, to be applicable to all common HIV-1 subtypes, and to be reproducible and comparable across different platforms. The amount of virus present in the plasma affects clinical decisions; therefore, accurate sensitive viral load assays are particularly important. The current guidelines, which are based on data from assays with limits of quantification ranging between 10 and 40 copies/ml (1 to 1.6 log copies/ml), regard levels of <50 HIV-1 copies/ml (<1.7 log copies/ml) in plasma to be the optimal outcomes of highly active antiretroviral therapy. Viral loads exceeding 50 copies/ml trigger further investigation, and >1,000 copies/ml (>3 log copies/ml) is considered to be the threshold for resistance testing (2, 3). Decreases or increases in HIV-1 RNA concentrations of 0.5 log copies/ml are considered significant changes that cannot be attributed to testing or normal biological variations and may reflect treatment success or failure (4). In Israel, HIV-1 patients are primarily infected with group M viruses, mainly subtype A1/CRF01_AE (referred to here as subtype A1), subtype B, subtype C, subtypes CRF02_AG and G (collectively referred to here as subtype CRF02_AG/G), and rarer subtypes (5, 6). This pluralism is advantageous for studying the efficiency of different assays to detect various HIV-1 subtypes.
Several commercial RNA viral load assays are available, and new assays are being introduced. The assays differ not only in their sample preparation procedures, target regions, and enrichment protocols but also in their dynamic ranges, throughputs, time-to-result characteristics, degrees of automation, efficiencies, and costs. To evaluate viral load assays, several parameters must be addressed. Interassay reproducibility is important to ensure effective treatment of HIV-1-infected persons, especially when switching from one assay to another (4). The accuracies of such assays are expected to remain identical in different ranges of HIV-1 viral loads. In addition, the abilities of the assays to identify and to quantify different HIV-1 subtypes efficiently are important. In this study, we compared the bioMérieux SA NucliSens v2.0 EasyQ/easyMAG assay (bioMérieux SA, Marcy l'Etoile, France), which has been on the market for several years and is routinely used in our laboratory for viral load monitoring, with the Abbott RealTime HIV-1 assay (Abbott Molecular, Inc., Des Plaines, IL) and two new assays, i.e., the Aptima HIV-1 Quant Dx assay on the Panther system (Hologic, Inc., San Diego, CA) and the Xpert HIV-1 viral load assay on the GeneXpert platform (Cepheid, Inc., Sunnyvale, CA), using samples representative of a range of viral loads and group M subtypes.
MATERIALS AND METHODS
Sample collection.
The study included samples collected between 2013 and 2014 from patients (confirmed HIV-1 carriers) attending the AIDS clinic of the Sheba Medical Center. Plasma from whole-blood samples collected in EDTA-containing tubes was separated by centrifugation (1,100 × g for 5 min). An aliquot (0.5 ml) was initially tested with the NucliSens v2.0 assay as part of the regular monitoring of HIV-1 copy numbers. Separate aliquots of the plasma samples were stored frozen at −20°C in volumes required for the different assays, with a single freeze-thaw cycle prior to analysis on the different platforms. On the day of analysis, the aliquots were thawed, vortex-mixed, and analyzed for viral loads. Plasma samples (n = 404) spanning the full range of HIV-1 viral loads were selected based on the NucliSens v2.0 results and, if applicable, the HIV-1 subtype, which was determined using the Stanford HIV drug resistance database (7) following sequencing of the pol gene. The sample group included 73 subtype A1, 178 subtype B, 71 subtype C, and 20 subtype CRF02_AG/G samples.
Ethics statement.
The study was approved by the local institutional review board of the Sheba Medical Center (approval number SMC-1251-14). Written informed consent for retention and testing of residual plasma samples was provided by the patients.
Viral load measurements.
All assays were performed according to the manufacturers' instructions. The NucliSens v2.0 assay (8) is based on nucleic acid sequence-based amplification (NASBA) of HIV-1 gag and utilizes molecular beacon probes for detection of the amplified products. Extraction of total nucleic acids from 0.5 ml of plasma was performed with the semiautomated easyMAG extractor, and isothermic cDNA production and detection were performed with the EasyQ instrument (linear range of 20 to 10,000,000 copies/ml). The Abbott RealTime HIV-1 assay combines automated plasma RNA extraction on the m2000sp system and real-time PCR amplification of the integrase gene fragment, with noncompetitive fluorescence detection, on the fully automated m2000rt PCR system (9). It requires 0.6 ml of plasma and has a linear detection range of 40 to 10,000,000 copies/ml. The Aptima assay is based on Hologic real-time transcription-mediated amplification (TMA) technology. It amplifies both the long terminal repeat (LTR) and integrase of HIV-1 and is used on the fully automated Panther system. The test requires 0.5 ml of plasma and has a linear detection range of 30 to 10,000,000 copies/ml. The Xpert assay is fully automated and combines RNA extraction and purification, reverse transcription, and real-time cDNA quantification, based on the 5′-LTR regions of HIV-1, in one integrated cartridge. It runs on the GeneXpert system, requires 1 ml of plasma, and has a linear detection range of 40 to 10,000,000 copies/ml.
Assay precision.
Assay precision and reproducibility were investigated using both commercial and clinical samples. Control samples included HIV-1 subtype B samples with low (2.2 log IU/ml) and high (6.2 log IU/ml) viral loads (AcroMetrix; Life Technologies, Carlsbad, CA) and were tested in all four assays, with five replicates per platform. In addition, samples representative of subtypes A1, B, and C were diluted with HIV-1-negative plasma to obtain viral loads of 40 to 500 copies/ml (1.60 to 2.70 log copies/ml). One replicate was initially tested with the RealTime, Aptima, and Xpert assays to ensure that the desired viral load had been reached. Subsequently, 7 to 9 replicates of these diluted samples were analyzed with the RealTime, Aptima, and Xpert assays, on 3 different days for each platform.
Statistical analyses.
All results were expressed as HIV-1 RNA copies per milliliter and were transformed to log copies per milliliter for further statistical analysis. A cutoff value of 1.6 log copies/ml (40 copies/ml), which is the threshold above which the RealTime and Xpert assays quantify HIV-1 viral loads, was used to separate the samples that were quantified by all four assays. Concordance between any two assays was determined by counting the number of samples with viral loads below and above 1.6 log copies/ml with both assays. The number of samples with interassay differences in viral loads exceeding the clinical cutoff value of 0.5 log copies/ml (4) was also recorded. To determine the linear relationship between two assays, the Pearson correlation coefficient (r) was calculated. Bland-Altman analysis was used to assess the agreement between any two assays. The difference between the results of two assays was plotted against the average of the results. The means of all differences and the standard deviations (SDs) were calculated. The 95% limits of agreement between assays were determined as the mean ± 1.96 SD (10).
Results were then analyzed with a mixed model for repeated measurements (11). The model was used to compare the overall similarity between the four assays. Mean viral load estimates and SDs (both with 95% confidence intervals [CIs]) for all of the samples tested in up to four assays were calculated and compared between the assays. The hypothesis of the two estimated means being equal (H0) versus the two estimated means not being equal (H1) was assessed. P values for pairwise comparisons were calculated using the Mixed procedure in SAS (version 9.1.3; SAS Institute, Inc., Cary, NC) and were adjusted for multiple comparisons using the Tukey-Kramer method. P values of <0.05 were considered to be significant. Similar analyses were performed to assess the influence of HIV-1 subtypes (subtypes A1, B, C, and CRF02_AG/G) and different ranges of viral loads (group 1, ≤1.59 log copies/ml; group 2, 1.60 to 2.30 log copies/ml; group 3, 2.31 to 3.00 log copies/ml; group 4, >3.00 log copies/ml) on assay performance.
RESULTS
Samples.
A total of 404 samples tested by the NucliSens v2.0 assay were selected for evaluation with the different platforms. Due to limited sample volumes, some of the samples were tested in only one or two of the three platforms being evaluated. Overall, 273 of the 404 samples were tested by the RealTime assay, 298 by the Aptima assay, and 266 by the Xpert assay. Figure 1 shows the allocation of the 404 samples to the different assays.
FIG 1.
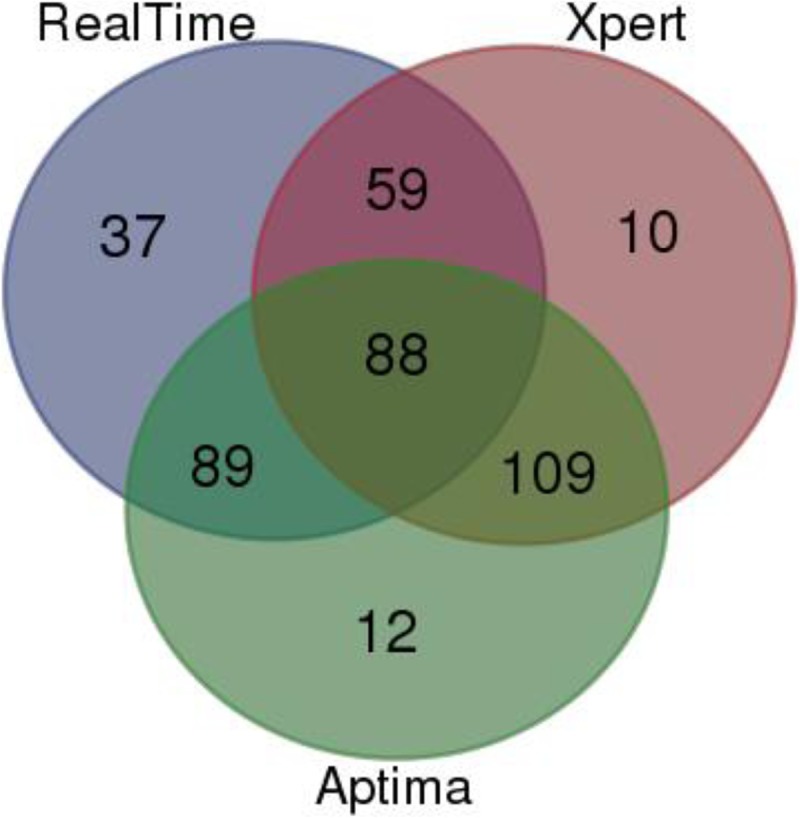
Venn diagram classifying the 404 samples tested by the NucliSens v2.0 versus RealTime, Xpert, and Aptima assays. A total of 273 of these 404 samples were tested by the RealTime assay, 298 by the Aptima assay, and 266 by the Xpert assay.
Concordance between assays.
The concordance between any two assays was determined by measuring the percentages of samples that contained ≤1.59 or >1.60 log copies/ml of HIV-1 in the two assays. The percentages of concordant samples in the NucliSens v2.0 versus RealTime, Xpert, and Aptima assays were 89.74%, 84.96%, and 83.89%, respectively (Table 1). The concordances of Xpert and Aptima with RealTime outputs were 89.80% and 89.78%, respectively, and the concordance was highest between Xpert and Aptima results (91.37%).
TABLE 1.
Concordance, Pearson correlation coefficients, and numbers of samples with viral load differences of >0.5 log copies/ml between assays
| Assays compared and test 1 viral loads | No. of samples with test 2 viral loads of: |
Total no. | Concordant samples (%) | No. of quantified samples | Pearson r | % (no.) of samples with differences of: |
||
|---|---|---|---|---|---|---|---|---|
| ≤1.59 log copies/ml | >1.60 log copies/ml | >0.5 log copies/ml | <0.5 log copies/ml | |||||
| NucliSens vs RealTime | 89.74 | 162 | 0.91 | 10.49 (17) | 20.99 (34) | |||
| ≤1.59 log copies/ml | 83 | 16 | 99 | |||||
| >1.60 log copies/ml | 12 | 162 | 174 | |||||
| NucliSens vs Xpert | 84.96 | 146 | 0.90 | 4.79 (7) | 26.71 (39) | |||
| ≤1.59 log copies/ml | 80 | 18 | 98 | |||||
| >1.60 log copies/ml | 22 | 146 | 168 | |||||
| NucliSens vs Aptima | 83.89 | 163 | 0.89 | 5.52 (9) | 38.65 (63) | |||
| ≤1.59 log copies/ml | 87 | 34 | 121 | |||||
| >1.60 log copies/ml | 14 | 163 | 177 | |||||
| RealTime vs Xpert | 89.80 | 82 | 0.98 | 0 (0) | 10.98 (9) | |||
| ≤1.59 log copies/ml | 50 | 3 | 53 | |||||
| >1.60 log copies/ml | 12 | 82 | 94 | |||||
| RealTime vs Aptima | 89.78 | 82 | 0.98 | 3.66 (3) | 20.73 (17) | |||
| ≤1.59 log copies/ml | 41 | 11 | 52 | |||||
| >1.60 log copies/ml | 3 | 82 | 85 | |||||
| Xpert vs Aptima | 91.37 | 116 | 0.97 | 3.45 (4) | 6.90 (8) | |||
| ≤1.59 log copies/ml | 64 | 4 | 68 | |||||
| >1.60 log copies/ml | 13 | 116 | 129 | |||||
An interassay difference of >0.5 log copies/ml was observed for 31.5% of the samples tested by the NucliSens v2.0 and RealTime or Xpert assays and 44.2% of those tested by the NucliSens v2.0 and Aptima assays. In more than 70% of the cases, lower quantification was obtained with the NucliSens v2.0 assay versus the other assays. Such deviations were observed for 11% and 24.4% of the samples tested by the RealTime versus Xpert and Aptima assays, respectively. The lowest percentage of samples with viral load differences of >0.5 log copies/ml (10.35%) was observed in a comparison of Xpert versus Aptima results (Table 1).
Linear correlations and Bland-Altman analyses.
Compared to NucliSens v2.0 results, the correlation coefficients (Pearson's r values) for RealTime, Xpert, and Aptima results were 0.91, 0.90, and 0.89, respectively, for 162 (RealTime), 146 (Xpert), and 163 (Aptima) quantified samples (Table 1). Higher correlations were found between Xpert and RealTime or Aptima results (r = 0.98 for 82 quantified samples) and between Xpert and Aptima results (r = 0.97 for 116 quantified samples).
The level of agreement between any two assays across the different viral loads and the different HIV-1 subtypes (subtypes A1, B, C, and CRF02_AG/G) was further assessed by Bland-Altman analysis (Fig. 2A to F). Bland-Altman analyses showed significant correlations between the different assays. The means of the differences in viral loads and the SDs of the differences measured by the different assays were as follows: NucliSens v2.0 versus RealTime, mean, 0.11 log copies/ml (95% CI, 0.03 to 0.19 log copies/ml; SD, 0.51 log copies/ml); NucliSens v2.0 versus Xpert, mean, 0.24 log copies/ml (95% CI, 0.15 to 0.33 log copies/ml; SD, 0.57 log copies/ml); NucliSens v2.0 versus Aptima, mean, 0.36 log copies/ml (95% CI, 0.27 to 0.47 log copies/ml; SD, 0.63 log copies/ml). In all of these comparisons, the mean viral loads quantified by the NucliSens v2.0 assay were lower than those from the other assays. Subtype A1 samples most frequently yielded lower viral load readings in the NucliSens v2.0 assay than in the Xpert or Aptima assay (Fig. 2B and C).
FIG 2.

Bland-Altman plots of data analyzed by the NucliSens v2.0 and RealTime (A), NucliSens v2.0 and Xpert (B), NucliSens v2.0 and Aptima (C), RealTime and Aptima (D), RealTime and Xpert (E), and Xpert and Aptima (F) assays. The x axes show the averages of any two measurements, and the y axes show the percent difference between those two measurements. Horizontal solid lines, mean differences; dashed lines, 95% limits of agreement. Yellow symbols, subtype A1; red symbols, subtype B; green symbols, subtype C; light orange symbols, subtype CRF02_AG/G; blue symbols, subtype not defined.
Bland-Altman plots of RealTime and Aptima or RealTime and Xpert results showed that the means of the differences in HIV-1 viral loads were 0.23 log copies/ml (95% CI, 0.18 to 0.30 log copies/ml; SD, 0.32 log copies/ml) and 0.13 log copies/ml (95% CI, 0.07 to 0.19 log copies/ml; SD, 0.26 log copies/ml), respectively (Fig. 2D and E). Bland-Altman analysis of Xpert and Aptima results (Fig. 2F) revealed that the mean of the differences in viral loads was very low (0.05 log copies/ml [95% CI, −0.02 to 0.12 log copies/ml]; SD, 0.37 log copies/ml). Taken together, these results indicate slightly higher measurements for the Aptima assay versus the RealTime assay and very similar measurements for the Xpert and Aptima assays. The few samples with highly deviant interassay viral load measurements in these three plots (differences of 0.75 to 1.87 log copies/ml) were mainly subtype C.
Precision.
Five replicates each of AcroMetrix controls with low and high viral loads were tested by each assay (Table 2). For the high-viral-load AcroMetrix control (6.2 log IU/ml), the viral load measured with the Aptima assay, i.e., mean ± SD of 6.62 ± 0.03 log copies/ml, was significantly (P < 0.05) higher than values from the other three assays. No significant differences were found between the four assays in the mean viral load measurements for the low-viral-load AcroMetrix control (2.2 log IU/ml). Higher coefficients of variation (CVs) were observed for the NucliSens v2.0 assay (2.79% to 18.34%) versus the other assays (0.91% to 8.63% for the RealTime assay, 0.74% to 3.75% for the Xpert assay, and 0.41% to 4.98% for the Aptima assay) across the AcroMetrix controls with low and high viral loads.
TABLE 2.
Precision based on low (2.2 log IU/ml) and high (6.2 log IU/ml) AcroMetrix controls
| Assay parameter | Low AcroMetrix control |
High AcroMetrix control |
||||||
|---|---|---|---|---|---|---|---|---|
| NucliSens | RealTime | Xpert | Aptima | NucliSens | RealTime | Xpert | Aptima | |
| Precision (log copies/ml) | ||||||||
| Replicate 1 | 5.92 | 6.00 | 5.93 | 6.61 | 2.30 | 2.00 | 2.23 | 2.02 |
| Replicate 2 | 5.76 | 5.96 | 5.94 | 6.61 | 1.57 | 2.18 | 2.42 | 2.21 |
| Replicate 3 | 5.85 | 5.92 | 5.91 | 6.61 | 2.51 | 1.81 | 2.32 | 2.2 |
| Replicate 4 | 6.11 | 5.88 | 5.98 | 6.61 | 2.59 | 2.00 | 2.29 | 2.28 |
| Replicate 5 | 6.15 | 6.00 | 6.02 | 6.67 | 2.52 | 2.26 | 2.20 | 2.07 |
| Mean | 5.96 | 5.95 | 5.96 | 6.62 | 2.30 | 2.05 | 2.29 | 2.16 |
| SD | 0.17 | 0.05 | 0.04 | 0.03 | 0.42 | 0.18 | 0.09 | 0.11 |
| CV (%) | 2.79 | 0.91 | 0.74 | 0.41 | 18.34 | 8.63 | 3.75 | 4.98 |
To assess the precision of the RealTime, Xpert, and Aptima assays for different HIV-1 subtypes in the low-viral-load range, high-viral-load subtype A1, B, and C samples diluted with normal plasma (5 to 9 replicates each) were tested with these three platforms. The goal of this analysis was to compare the SDs between the systems for low-viral-load samples. The viral loads (mean ± SD) for subtype A1 replicates were 2.25 ± 0.20 log copies/ml, 2.66 ± 0.10 log copies/ml, and 2.15 ± 0.25 log copies/ml by the RealTime, Xpert, and Aptima assays, respectively, and the viral loads for subtype B replicates were 2.22 ± 0.14 log copies/ml, 2.12 ± 0.10 log copies/ml, and 2.11 ± 0.14 log copies/ml. For subtype C, the viral loads (mean ± SD) were 2.11 ± 0.15 log copies/ml for the RealTime assay, 1.78 ± 0.12 log copies/ml for the Xpert assay, and 1.53 ± 0.15 log copies/ml for the Aptima assay. The coefficients of variation were 6% to 7% for the RealTime assay, 4% to 7% for the Xpert assay, and 7% to 12% for the Aptima assay, for the three samples. These results show high levels of precision for the different runs for each diluted sample in all three assays.
Mixed model for repeated measurements.
The estimated mean log viral load values for all samples with the four assays were similar, i.e., 2.46 copies/ml (95% CI, 2.31 to 2.61 copies/ml), 2.42 copies/ml (95% CI, 2.25 to 2.60 copies/ml), 2.67 copies/ml (95% CI, 2.50 to 2.84 copies/ml), and 2.68 copies/ml (95% CI, 2.49 to 2.86 copies/ml) for the NucliSens v2.0, RealTime, Xpert, and Aptima assays, respectively. Although statistically significant differences were found between the estimated mean viral load values for the NucliSens v2.0 versus Xpert or Aptima assays (P < 0.01) and the RealTime versus Xpert or Aptima assays (P < 0.01), they were clinically irrelevant, as the differences between the means (which were higher with the Xpert and Aptima assays than the NucliSens v2.0 and RealTime assays) were less than 0.25 log copies/ml. No statistically significant difference was found between the estimated mean viral load values for the Xpert and Aptima assays or between those for the NucliSens v2.0 and RealTime assays.
The possible influence of HIV-1 subtypes A1, B, C, and CRF02_AG/G on HIV-1 RNA quantification was also assessed. The differences between the estimates of the means in the different assays according to HIV-1 subtype are presented in Table 3. For subtype A1, the estimated mean viral load measured with the NucliSens v2.0 assay was significantly lower (difference in the estimated means, >0.5 log copies/ml; P < 0.01) than the estimated means from the Xpert or Aptima assays. The same statistically significant trend was observed for subtype A1 with the RealTime versus Xpert or Aptima assays, although the difference between the means was <0.5 log copies/ml. The estimated mean viral loads measured with the NucliSens v2.0 and RealTime assays were similar for this subtype. For subtype C, the differences between the means measured with the RealTime versus Aptima or Xpert assays (−0.46 log copies/ml) were also significant (P < 0.02). No other significant differences were identified between the estimated means from the various assays for these subtypes, and no significant differences between any of these four assays for subtypes B and CRF02_AG/G were observed.
TABLE 3.
Differences between estimated mean viral loads from NucliSens, RealTime, Xpert, and Aptima assays according to HIV-1 subtype
| HIV-1 subtype and assays compared | Difference between estimated mean viral loads (log copies/ml) | Standard error of difference (log copies/ml) | Pa |
|---|---|---|---|
| Subtype A1 | |||
| NucliSens vs RealTime | −0.24 | 0.09 | 0.33 |
| NucliSens vs Xpert | −0.64 | 0.09 | <0.01 |
| NucliSens vs Aptima | −0.68 | 0.09 | <0.01 |
| RealTime vs Xpert | −0.40 | 0.11 | 0.02 |
| RealTime vs Aptima | −0.44 | 0.10 | <0.01 |
| Xpert vs Aptima | −0.04 | 0.11 | 1.00 |
| Subtype B | |||
| NucliSens vs RealTime | 0.18 | 0.06 | 0.13 |
| NucliSens vs Xpert | 0.06 | 0.06 | 1.00 |
| NucliSens vs Aptima | 0.05 | 0.06 | 1.00 |
| RealTime vs Xpert | 0.12 | 0.07 | 0.93 |
| RealTime vs Aptima | −0.13 | 0.06 | 0.82 |
| Xpert vs Aptima | −0.01 | 0.06 | 1.00 |
| Subtype C | |||
| NucliSens vs RealTime | 0.26 | 0.10 | 0.37 |
| NucliSens vs Xpert | −0.21 | 0.09 | 0.56 |
| NucliSens vs Aptima | −0.19 | 0.09 | 0.37 |
| RealTime vs Xpert | −0.46 | 0.11 | 0.01 |
| RealTime vs Aptima | −0.46 | 0.11 | 0.02 |
| Xpert vs Aptima | 0.01 | 0.09 | 1.00 |
| Subtype CRF02_AG/G | |||
| NucliSens vs RealTime | −0.44 | 0.19 | 0.63 |
| NucliSens vs Xpert | −0.41 | 0.17 | 0.58 |
| NucliSens vs Aptima | −0.58 | 0.18 | 0.09 |
| RealTime vs Xpert | 0.03 | 0.22 | 1.00 |
| RealTime vs Aptima | −0.14 | 0.23 | 1.00 |
| Xpert vs Aptima | −0.17 | 0.19 | 1.00 |
Adjusted for multiple comparisons by the Tukey-Kramer method.
Viral load assays have been shown to underquantify or overquantify actual values across the range of viral loads (12). Here the samples were divided into four ranges of viral loads, and the estimated means for each range of viral loads were compared between the assays (Table 4). While no statistically significant differences were observed for samples with viral loads ranging between 1.60 and 3.00 log copies/ml (groups 2 and 3), significantly lower viral load readings were obtained with the RealTime assay, compared to the other three assays, for samples with mean viral loads of ≤1.59 log copies/ml (group 1). Statistically significant differences were also found when the high-viral-load group (group 4) was tested with the NucliSens v2.0 assay, which underquantified these samples in comparison with all other assays, a trend that was most prominent in comparisons with the Aptima assay (mean difference between the Aptima and NucliSens assays of 0.57 log copies/ml). Compared to the Aptima assay, the RealTime assay also slightly underestimated this group of high-viral-load samples (mean difference of 0.33 log copies/ml; P < 0.01).
TABLE 4.
Differences between estimated mean viral loads from NucliSens, RealTime, Xpert, and Aptima assays for groups of samples with different mean viral loads
| HIV-1 viral load groupa and assays compared | Difference between estimated mean viral loads (log copies/ml) | Standard error of difference (log copies/ml) | Pb |
|---|---|---|---|
| Group 1 | |||
| NucliSens vs RealTime | 0.27 | 0.07 | <0.01 |
| NucliSens vs Xpert | −0.08 | 0.06 | 1.00 |
| NucliSens vs Aptima | −0.08 | 0.07 | 1.00 |
| RealTime vs Xpert | −0.36 | 0.07 | <0.01 |
| RealTime vs Aptima | −0.35 | 0.07 | <0.01 |
| Xpert vs Aptima | 0.004 | 0.07 | 1.00 |
| Group 2 | |||
| NucliSens vs RealTime | 0.08 | 0.11 | 1.00 |
| NucliSens vs Xpert | −0.02 | 0.10 | 1.00 |
| NucliSens vs Aptima | 0.17 | 0.09 | 0.91 |
| RealTime vs Xpert | −0.11 | 0.12 | 1.00 |
| RealTime vs Aptima | 0.08 | 0.11 | 1.00 |
| Xpert vs Aptima | 0.19 | 0.10 | 0.89 |
| Group 3 | |||
| NucliSens vs RealTime | 0.08 | 0.13 | 1.00 |
| NucliSens vs Xpert | −0.18 | 0.13 | 0.99 |
| NucliSens vs Aptima | 0.003 | 0.14 | 1.00 |
| RealTime vs Xpert | −0.27 | 0.15 | 0.94 |
| RealTime vs Aptima | −0.08 | 0.15 | 1.00 |
| Xpert vs Aptima | 0.19 | 0.15 | 1.00 |
| Group 4 | |||
| NucliSens vs RealTime | −0.24 | 0.06 | 0.02 |
| NucliSens vs Xpert | −0.42 | 0.07 | <0.01 |
| NucliSens vs Aptima | −0.57 | 0.06 | <0.01 |
| RealTime vs Xpert | −0.18 | 0.08 | 0.58 |
| RealTime vs Aptima | −0.33 | 0.07 | <0.01 |
| Xpert vs Aptima | −0.15 | 0.07 | 0.81 |
Group 1, viral loads of ≤1.59 log copies/ml; group 2, viral loads of 1.60 to 2.30 log copies/ml; group 3, viral loads of 2.31 to 3.00 log copies/ml; group 4, viral loads of >3.00 log copies/ml.
Adjusted for multiple comparisons by the Tukey-Kramer method.
DISCUSSION
HIV-1 viral loads in the blood determine the risk of disease progression and guide antiretroviral treatment decisions (13). For clinical HIV laboratories, accurate sensitive viral load assays with low risk of contamination, combining easy-to-use workflow, automation, and speed, less stringent demands for technical skills, reduced possibilities of human error, high throughput capacities, open access for new samples after initiation of an assay, compactness, and low costs, are most desirable. Comparisons of different HIV-1 viral load assays and determination of their analytical performance with different HIV-1 levels and subtypes, their precision, and their concordance with each other are of great importance for the management of HIV-1 infections, especially when switching from one viral load assay to another.
To the best of our knowledge, this is the first study that compares the new Xpert and Aptima assays with the NucliSens v2.0 and RealTime assays. A total of 404 plasma samples from patients infected with HIV-1 A1, B, C, and CRF02_AG/G subtypes were included, enabling comparison of samples with subtype B, as well as the most common non-B subtypes. The data indicated that, regardless of the comparison performed, the assays with the most similar performance were the Xpert and Aptima assays and both assays correlated better with the RealTime assay than with the NucliSens v2.0 assay. The high percentages of concordant samples (89.78% to 91.37%), the highest Pearson correlation r values (r = 0.97 to 0.98), and the smallest differences in the mean viral loads of quantitative samples (differences of 0.05 to 0.13 log copies/ml, as measured by Bland-Altman analysis) were observed between the Xpert, Aptima, and RealTime assays. The NucliSens v2.0 assay was less precise, in both low and high viral load ranges. However, the assay that best correlated overall with the NucliSens assay was the RealTime assay, as determined by the percentage of concordant samples (89.74%), the Pearson r value (r = 0.91), the small difference in the mean viral load values determined by Bland-Altman analysis (0.11 log copies/ml), and the overall similarity in the estimated mean viral load values (2.46 log copies/ml [95% CI, 2.31 to 2.61 log copies/ml] and 2.42 log copies/ml [95% CI, 2.25 to 2.60 log copies/ml], respectively) for the two assays.
Differences in assay performance mainly in the low ranges but also in the high ranges of viral loads have been reported (12, 14). The NucliSens v2.0 assay has been shown to be less precise than the Roche Cobas AmpliPrep/Cobas TaqMan v2.0 (15) and Versant bDNA (8) assays. The RealTime assay was reported to have excellent intra-assay and interassay reproducibility (10% variability) at low viral loads (12) and to be more accurate than Roche assays (16, 17), although greater variability (30%) at a high viral load (6 log copies/ml) (12) and a tendency to underquantify low-viremic samples have been reported (18–20). In a recent large international collaborative study using 4,221 paired samples, the overall correlation and concordance between several viral load assays (including the RealTime assay) were found to be lower at low viral loads than at higher loads (21). Studies presenting head-to-head comparisons of the NucliSens v2.0 and RealTime assays varied in their conclusions. While Xu et al. demonstrated a low interassay correlation (Pearson r, 0.769) and higher mean viral load values for the RealTime assay (difference of 0.418 log copies/ml) when testing 174 samples from treatment-naive individuals, Gomes et al. reported close agreement (95.43% concordance with 175 samples) and high correlation values, with overall minimal mean viral load differences between the two assays (0.04 log copies/ml) (8, 22). In the current study, samples in the low viral load range (groups 2 and 3; mean estimated viral loads of 1.60 to 3.00 log copies/ml) displayed similar values across all assays. Since groups 2 and 3 include patients at high risk of treatment failure and resistance (2), the comparable accuracies and reliabilities of all assays in these viral load ranges are reassuring. The RealTime assay tended to underestimate viral load values for group 1 (samples with ≤1.59 log copies/ml), although the differences were clinically meaningless (4). Moreover, group 1 is prone to inherent precision issues, especially since the limits of quantification for the four assays are different. In the group of samples with viral loads of >3.00 log copies/ml (group 4), which includes either virological failures or untreated cases, the NucliSens v2.0 assay was less sensitive and tended to underestimate viral loads, as reported by others (23). Taken together, the data suggest that the NucliSens v2.0 assay has lower viral load readings and inferior precision and accuracy.
One of the main challenges for viral load assays is to quantify different HIV-1 subtypes correctly. Our data indicate that the four assays could successfully quantify the main subtypes, albeit with different degrees of efficiency. Discrepancies between different testing platforms (including the NucliSens v2.0 assay) have been predominantly reported for HIV-1 clade C samples, especially in the low-viremic range (23). In a different study that compared the NucliSens v2.0 assay and six other assays, including the RealTime assay, large quantitative differences, which exceeded 0.5 log IU/ml for approximately 50% of the tested samples, were identified for subtype AE and BC samples, although very similar mean viral load values were observed across the assays for subtype B samples (8). Recently, Ndiaye et al. reported underquantification of subtype CRF02_AG samples by the NucliSens v2.0 assay (24). In the current study, no significant interassay differences were observed for subtypes B and CRF02_AG/G, while underquantification of subtype A1 by both NucliSens v2.0 and RealTime assays and of subtype C samples by RealTime versus Xpert and Aptima assays was found. No differences between the Xpert and Aptima assays in the detection efficiencies for any of the subtypes were found. It is evident that the four assays compared herein assess different regions of the HIV-1 RNA and use different methodologies for target detection and enrichment, possibly resulting in differences in their sensitivities for subtype detection. Since the sequences of the primers and probes used have not been published, it is impossible to assess mismatches for specific subtypes that may affect final viral load determinations.
The main strengths of this study lie in the number and uniqueness of the different systems that were compared, the range of viral loads, and the large number of samples representative of various group M HIV-1 subtypes in Israel. However, there are some limitations that should be mentioned. Selection bias (all samples were selected based only on NucliSens v2.0 viral loads) may have influenced the results. The handling procedures, which were different for the NucliSens v2.0 assay (fresh samples) versus all other systems (which used frozen samples), also might have affected the results. However, no influence of the freeze-thaw cycle was observed with 100 samples that were tested by all systems after freezing (data not shown). In this study, 0.5 ml plasma was used for the NucliSens v2.0 assay, while larger plasma volumes (e.g., 1 ml for the Xpert assay) were required for the other assays. Smaller sample volumes may be advantageous in certain settings, especially when the initial blood volume is small. However, small volumes can reduce assay sensitivity (23). On the other hand, the ability to utilize the remains of the separate nucleic acids extracted with the easyMAG extractor in the first step of the NucliSens assay may be particularly beneficial for resistance testing. Finally, the numbers of samples in the four viral load ranges were limited. It will be interesting to repeat this study with a larger number of samples, particularly in the low viral load range.
In conclusion, although there was overall agreement between the four viral load assessment assays, the Xpert and Aptima assays correlated best with each other and with the RealTime assay. These assays exhibited excellent precision, were equally sensitive in the clinically relevant viral load range, and effectively detected all of the major HIV-1 group M subtypes, although the RealTime assay tended to underestimate clade A1 and C samples. The NucliSens v2.0 assay correlated best with the RealTime assay but was less precise and accurate and significantly underestimated A1 samples. In addition, its quantitative viral load measurements tended to be slightly lower than those of all other assays. Being fully automated, the Xpert and Aptima assays are easy to use. The main advantages of the Xpert HIV-1 viral load assay are its unprecedented simplicity, rapid turnaround time (1.5 h), flexibility to adapt to low or high throughput, and instrument size and the large portfolio of different assays available for the GeneXpert platform. The Aptima HIV-1 assay runs on the fully automated and well-characterized Panther system (with random access testing), returns results in approximately 2.5 h, and enables processing of 320 plasma samples in an 8-h shift. Since the performance characteristics of the Xpert and Aptima assays are very similar, the decision to use one assay or the other could depend on assay-independent parameters such as laboratory space, number of samples, workflow, and costs.
ACKNOWLEDGMENTS
We thank Regina Selezniev and Ofra Mishkal from the Infectious Diseases Unit at Sheba Medical Center, Yoav Eshsel from Abbott Molecular Israel, and Boaz Rosenfeld for their excellent technical assistance. We also thank Ilex Medical (and Hologic), Abbott Molecular Israel, and Medison Pharma (and Cepheid) for providing all of the equipment and reagents for this study, free of charge.
B.N. is an employee of Ilex Medical, an official representative of Hologic in Israel.
REFERENCES
- 1.Thompson MA, Aberg JA, Hoy JF, Telenti A, Benson C, Cahn P, Eron JJ, Gunthard HF, Hammer SM, Reiss P, Richman DD, Rizzardini G, Thomas DL, Jacobsen DM, Volberding PA. 2012. Antiretroviral treatment of adult HIV infection: 2012 recommendations of the International Antiviral Society-USA panel. JAMA 308:387–402. [DOI] [PubMed] [Google Scholar]
- 2.World Health Organization. 2013. Consolidated guidelines on the use of antiretroviral drugs for treating and preventing HIV infection. World Health Organization, Geneva, Switzerland: http://www.who.int/hiv/pub/guidelines/arv2013. [PubMed] [Google Scholar]
- 3.Doyle T, Smith C, Vitiello P, Cambiano V, Johnson M, Owen A, Phillips AN, Geretti AM. 2012. Plasma HIV-1 RNA detection below 50 copies/ml and risk of virologic rebound in patients receiving highly active antiretroviral therapy. Clin Infect Dis 54:724–732. doi: 10.1093/cid/cir936. [DOI] [PubMed] [Google Scholar]
- 4.Senechal B, James VL. 2012. Ten years of external quality assessment of human immunodeficiency virus type 1 RNA quantification. J Clin Microbiol 50:3614–3619. doi: 10.1128/JCM.01221-12. [DOI] [PMC free article] [PubMed] [Google Scholar]
- 5.Wainberg MA. 2004. HIV-1 subtype distribution and the problem of drug resistance. AIDS 18(Suppl 3):S63–S68. [DOI] [PubMed] [Google Scholar]
- 6.Abecasis AB, Wensing AM, Paraskevis D, Vercauteren J, Theys K, Van de Vijver DA, Albert J, Asjo B, Balotta C, Beshkov D, Camacho RJ, Clotet B, De Gascun C, Griskevicius A, Grossman Z, Hamouda O, Horban A, Kolupajeva T, Korn K, Kostrikis LG, Kucherer C, Liitsola K, Linka M, Nielsen C, Otelea D, Paredes R, Poljak M, Puchhammer-Stockl E, Schmit JC, Sonnerborg A, Stanekova D, Stanojevic M, Struck D, Boucher CA, Vandamme AM. 2013. HIV-1 subtype distribution and its demographic determinants in newly diagnosed patients in Europe suggest highly compartmentalized epidemics. Retrovirology 10:7. doi: 10.1186/1742-4690-10-7. [DOI] [PMC free article] [PubMed] [Google Scholar]
- 7.Liu TF, Shafer RW. 2006. Web resources for HIV type 1 genotypic-resistance test interpretation. Clin Infect Dis 42:1608–1618. doi: 10.1086/503914. [DOI] [PMC free article] [PubMed] [Google Scholar]
- 8.Xu S, Song A, Nie J, Li X, Wang Y. 2010. Performance of NucliSens HIV-1 EasyQ Version 2.0 compared with six commercially available quantitative nucleic acid assays for detection of HIV-1 in China. Mol Diagn Ther 14:305–316. doi: 10.1007/BF03256386. [DOI] [PubMed] [Google Scholar]
- 9.Garcia-Diaz A, Clewley GS, Booth CL, Labett W, McAllister N, Geretti AM. 2006. Comparative evaluation of the performance of the Abbott real-time human immunodeficiency virus type 1 (HIV-1) assay for measurement of HIV-1 plasma viral load following automated specimen preparation. J Clin Microbiol 44:1788–1791. doi: 10.1128/JCM.44.5.1788-1791.2006. [DOI] [PMC free article] [PubMed] [Google Scholar]
- 10.Bland JM, Altman DG. 1986. Statistical methods for assessing agreement between two methods of clinical measurement. Lancet i:307–310. [PubMed] [Google Scholar]
- 11.Verbeke G, Molenberghs G. 2000. Linear mixed models for longitudinal data. Springer-Verlag, New York, NY. [Google Scholar]
- 12.Sollis KA, Smit PW, Fiscus S, Ford N, Vitoria M, Essajee S, Barnett D, Cheng B, Crowe SM, Denny T, Landay A, Stevens W, Habiyambere V, Perrins J, Peeling RW. 2014. Systematic review of the performance of HIV viral load technologies on plasma samples. PLoS One 9:e85869. doi: 10.1371/journal.pone.0085869. [DOI] [PMC free article] [PubMed] [Google Scholar]
- 13.Panel on Antiretroviral Guidelines for Adults and Adolescents. 2015. Guidelines for the use of antiretroviral agents in HIV-1-infected adults and adolescents. Department of Health and Human Services, Washington, DC: http://www.aidsinfo.nih.gov/ContentFiles/AdultandAdolescentGL.pdf. [Google Scholar]
- 14.Yan CS, Hanafi I, Kelleher AD, Carr AD, Amin J, McNally LP, Cunningham PH. 2010. Lack of correlation between three commercial platforms for the evaluation of human immunodeficiency virus type 1 (HIV-1) viral load at the clinically critical lower limit of quantification. J Clin Virol 49:249–253. doi: 10.1016/j.jcv.2010.08.016. [DOI] [PubMed] [Google Scholar]
- 15.Xu S, Song A, Nie J, Li X, Meng S, Zhang C, Wang Y. 2012. Comparison between the automated Roche Cobas AmpliPrep/Cobas TaqMan HIV-1 test version 2.0 assay and its version 1 and Nuclisens HIV-1 EasyQ version 2.0 assays when measuring diverse HIV-1 genotypes in China. J Clin Virol 53:33–37. doi: 10.1016/j.jcv.2011.10.001. [DOI] [PubMed] [Google Scholar]
- 16.Amendola A, Marsella P, Bloisi M, Forbici F, Angeletti C, Capobianchi MR. 2014. Ability of two commercially available assays (Abbott RealTime HIV-1 and Roche Cobas AmpliPrep/Cobas TaqMan HIV-1 Version 2.0) to quantify low HIV-1 RNA levels (<1,000 copies/milliliter): comparison with clinical samples and NIBSC working reagent for nucleic acid testing assays. J Clin Microbiol 52:2019–2026. doi: 10.1128/JCM.00288-14. [DOI] [PMC free article] [PubMed] [Google Scholar]
- 17.Naeth G, Ehret R, Wiesmann F, Braun P, Knechten H, Berger A. 2013. Comparison of HIV-1 viral load assay performance in immunological stable patients with low or undetectable viremia. Med Microbiol Immunol 202:67–75. doi: 10.1007/s00430-012-0249-y. [DOI] [PubMed] [Google Scholar]
- 18.Bourlet T, Signori-Schmuck A, Roche L, Icard V, Saoudin H, Trabaud MA, Tardy JC, Morand P, Pozzetto B, Ecochard R, Andre P. 2011. HIV-1 load comparison using four commercial real-time assays. J Clin Microbiol 49:292–297. doi: 10.1128/JCM.01688-10. [DOI] [PMC free article] [PubMed] [Google Scholar]
- 19.Katsoulidou A, Rokka C, Issaris C, Haida C, Tzannis K, Sypsa V, Detsika M, Paraskevis D, Hatzakis A. 2011. Comparative evaluation of the performance of the Abbott RealTime HIV-1 assay for measurement of HIV-1 plasma viral load on genetically diverse samples from Greece. Virol J 8:10. doi: 10.1186/1743-422X-8-10. [DOI] [PMC free article] [PubMed] [Google Scholar]
- 20.Scott LE, Noble LD, Moloi J, Erasmus L, Venter WD, Stevens W. 2009. Evaluation of the Abbott m2000 RealTime human immunodeficiency virus type 1 (HIV-1) assay for HIV load monitoring in South Africa compared to the Roche Cobas AmpliPrep-Cobas Amplicor, Roche Cobas AmpliPrep-Cobas TaqMan HIV-1, and BioMerieux NucliSENS EasyQ HIV-1 assays. J Clin Microbiol 47:2209–2217. doi: 10.1128/JCM.01761-08. [DOI] [PMC free article] [PubMed] [Google Scholar]
- 21.Swenson LC, Cobb B, Geretti AM, Harrigan PR, Poljak M, Seguin-Devaux C, Verhofstede C, Wirden M, Amendola A, Boni J, Bourlet T, Huder JB, Karasi JC, Zidovec Lepej S, Lunar MM, Mukabayire O, Schuurman R, Tomazic J, Van Laethem K, Vandekerckhove L, Wensing AM. 2014. Comparative performances of HIV-1 RNA load assays at low viral load levels: results of an international collaboration. J Clin Microbiol 52:517–523. doi: 10.1128/JCM.02461-13. [DOI] [PMC free article] [PubMed] [Google Scholar]
- 22.Gomes P, Carvalho AP, Diogo I, Goncalves F, Costa I, Cabanas J, Camacho RJ. 2013. Comparison of the NucliSENS EasyQ HIV-1 v2.0 with Abbott m2000rt RealTime HIV-1 assay for plasma RNA quantitation in different HIV-1 subtypes. J Virol Methods 193:18–22. doi: 10.1016/j.jviromet.2013.05.001. [DOI] [PubMed] [Google Scholar]
- 23.Muenchhoff M, Madurai S, Hempenstall AJ, Adland E, Carlqvist A, Moonsamy A, Jaggernath M, Mlotshwa B, Siboto E, Ndung'u T, Goulder PJ. 2014. Evaluation of the NucliSens EasyQ v2.0 assay in comparison with the Roche Amplicor v1.5 and the Roche CAP/CTM HIV-1 Test v2.0 in quantification of C-clade HIV-1 in plasma. PLoS One 9:e103983. doi: 10.1371/journal.pone.0103983. [DOI] [PMC free article] [PubMed] [Google Scholar]
- 24.Ndiaye O, Diop-Ndiaye H, Ouedraogo AS, Fall ZM, Sall-Sow A, Thiam M, Diouara AA, Ndour CT, Gaye-Diallo A, Mboup S, Toure-Kane C. 2015. Comparison of four commercial viral load techniques in an area of non-B HIV-1 subtypes circulation. J Virol Methods 222:122–131. doi: 10.1016/j.jviromet.2015.06.002. [DOI] [PubMed] [Google Scholar]