Abstract
Heterocyclic amines (HCAs) and acrylamide are unintended hazardous substances generated by heating or processing of foods and are known as carcinogenic and mutagenic agents by the animal experiments. A simple method was established for a rapid and accurate determination of 12 types of HCAs (IQ, MeIQ, Glu-P-1, Glu-P-2, MeIQx, Trp-P-1, Trp-P-2, PhIP, AαC, MeAαC, Harman and Norharman) and acrylamide in three food matrices (non-fat liquid, non-fat solid and fat solid) by isotope dilution liquid chromatography-tandem mass spectrometry (LC-MS/MS). In every sample, a mixture of internal standards including IQ-d3, MeIQx-d3, PhIP-d3, Trp-P-2-13C2-15N and MeAαC-d3 was spiked for quantification of HCAs and 13C3-acrylamide was also spiked for the analysis of acrylamide. HCAs and acrylamide in sample were extracted with acetonitrile and water, respectively, and then two solid-phase extraction cartridges, ChemElut: HLB for HCAs and Accucat: HLB for acrylamide, were used for efficiently removing interferences such as pigment, lipid, polar, nonpolar and ionic compounds. Established method was validated in terms of recovery, accuracy, precision, limit of detection, limit of quantitation, and linearity. This method showed good precision (RSD < 20%), accuracy (71.8~119.1%) and recovery (66.0~118.9%). The detection limits were < 3.1 ng/g for all analytes. The correlation coefficients for all the HCAs and acrylamide were > 0.995, showing excellent linearity. These methods for the detection of HCAs and acrylamide by LC-MS/MS were applied to real samples and were successfully used for quantitative monitoring in the total diet study and this can be applied to risk assessment in various food matrices.
Keywords: Heterocyclic amines, Acrylamide, Isotope dilution, Validation, LC-MS/MS, Agricultural products
INTRODUCTION
As the amount of unintended hazardous substances is increased during food production, processing, and cooking, consumer’s interest towards these substances is increasing. Heterocyclic amines (HCAs) and acrylamide could be presented as the unintended harmful substances in cooked foodstuffs (1) by the Maillard reaction.HCAs are known as a mutant substance, which emerges when heating (fried, broiled, or barbecued) foodstuffs rich in amino acids or creatine and are categorized into the amino carboline group or amino-imidazo-azaarene (AIA) group according to their chemical structures (2). The amino carboline group is generally known as pyrolytic HCAs because it is formed during the pyrolysis reaction with amino acids or proteins at > 300℃ (2). Possible amino acids are tryptophan, glutamic acid, and phenylalanine, and possible proteins are globulin, casein, or creatine. AIAs are called thermic HCAs, with an imidazo functional group attached to quinolone, quinoxaline, or pyridine. The main precursors of AIAs are free amino acid, creatine, creatinine, sugar, pyrrole, and pyridine derivatives produced by the dehydration and cyclization reactions (2). Heterocyclic pyridine and pyrazine (IQ- and IQx-type) are produced by the Maillard reaction of hexose and free amino acid (2), Strecker degradation of free amino acid and additional transformation occurs by aldehyde and creatine, forming imidazoquinoline and imidazoquinoxaline. The factors affecting the HCA production in the food are their precursors (amino acids, sugars, creatine, and creatinine), temperature, moisture, cooking conditions, and antioxidant. Chemical structures and precursors of HCAs including full name and abbreviations are listed in Table 1. Acrylamide is a low-molecular-weight vinyl compound and is a colorless and odorless crystalline substance. It is easily soluble in water and rapidly polymerized by reacting with air (3) and is used to make polyacrylamide and its copolymers are used for the treatment of wastewater and purifying water in industries (4). According to the research of the Swedish National Food Administration, acrylamide was detected in the heat-treated potato products and other baked goods (5). Actually, potato products showed the highest amounts of acrylamide (6). When starchy foods are fried, roasted, or baked at temperatures > 120℃, the Maillard reaction between asparagines and reducing sugars in the food results in the formation of acrylamide (3).
Table 1. Chemical structure and precursor of HCAs (2) and acrylamide (21).
| Amino carboline | |||
|---|---|---|---|
|
| |||
| Abbreviation | Full name | Molecular structure | Precursor |
|
| |||
| Glu-P-1 | 2-Amino-6-methyldipyrido[1,2-A:3',2'-D]imidazole Hydrochloride Hydrate | 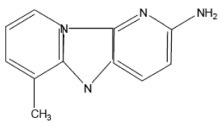 |
Glutamic acid |
| Glu-P-2 | 2-Aminodipyrido[1,2-A:3',2'-D]imidazole Hydrochloride |  |
Glutamic acid, casein |
| Trp-P-1 | 3-Amino-1,4-dimethyl-5H-pyrido[4,3-b]indole | 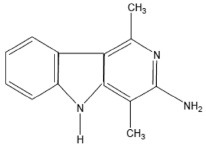 |
Tryptophan |
| Trp-P-2 | 3-Amino-1-methyl-5H-pyrido[4,3-b]indole | 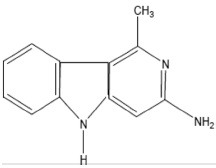 |
Tryptophan |
| AαC | 2-Amino-9H-pyrido[2,3-b]indole | 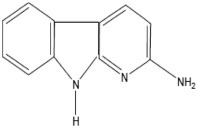 |
Soybean globulin |
| MeAαC | 2-Amino-3-methyl-9H-pyrido[2,3-b]indole | 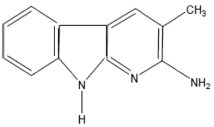 |
- |
| Harman | 1-Methyl-9H-pyrido[3,4-b]indole | 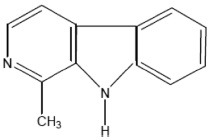 |
Tryptophan |
| Norharman | 9H-pyrido[3,4-b]indole | 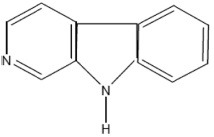 |
Tryptophan |
| Amino imidazoazaarene | |||
| IQ | 2-Amino-3-methyl-3H-imidazo[4,5-f]quinoline | 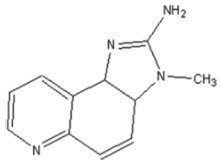 |
Creatine, Gly, Phc, Ser, Glucose |
| MeIQ | 2-Amino-3,4-dimethyl-3H-imidazo[4,5-f]quinoline | 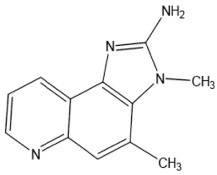 |
Creatine, Ala, fructose |
| MeIQx | 2-Amino-3,8-dimethylimidazo[4,5-f]quinoxaline |  |
Creatine, Gly, Ala, Thr, Lys, Glucose |
| PhIP | 2-Amino-1-methyl-6-phenylimidazo[4,5-b]pyridine | 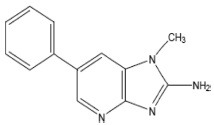 |
Creatine, Glucose, Tyr |
| Acrylamide | |||
| AA | Acrylamide |  |
Asparagine, Sugars |
| (2-Propenamide) | |||
The carcinogenicity of HCAs was tested by many animal experiments. These results confirm that some HCAs cause colon, breast, and prostate cancer. Moreover, monkeys got liver cancer when IQ was dosed to them, which imply some HCAs are carcinogenic not only to the rodent, but also to the mammals (7). Currently, HCAs do not have international standard regulations; however, the International Agency for Research on Cancer (IARC) in the World Health Organization (WHO) distinguished seven kinds of HCAs (i) MeIQ, MeIQx, Glu-P-1, Glu-P-2, PhIP, AαC, and MeAαC as possible carcinogens to humans (Group 2B) and (ii) IQ as a probable carcinogen to humans (Group 2A) (8). In 1994, acrylamide has been classified as a probable carcinogen to human (Group 2A) by the IARC (9). The potential risk of acrylamide in food to the public health has been considered by many government agencies and national authorities (10) and they performed risk assessments of acrylamide in food and concluded that efforts should be made to reduce the acrylamide levels to as low as possible. A long-term exposure to acrylamide may damage the nervous system in both humans and animals to a certain extent (11).
In the previous literatures, the extraction and clean-up procedures of HCAs were performed mostly based on the method of Gross (12) and Grüter (13) by using three cartridges: Extrelut, propylsulfonic acid (PRS) and C18. After a certain amount of sodium hydroxide is added to meat and seafood, extraction is performed, followed by the adsorption to ChemElut and the eluate flows out to PRS and C18 in a series to clean up interferences. In other literatures, HCAs are extracted with MCX (14)(Mixed-mode: Cation exchange), SCX (15) (Strong cation exchange)-C18, and LiChrolut EN (16). For the detection of HCAs, LC-MS (17), LC-MS/MS (18) or DAD (19,20) are used. In the pretreatment of acrylamide, sample extraction was mostly performed by the liquid-liquid extraction method and several studies also used matrix solid-phase dispersion (21). Mainly, solid-phase extraction (SPE) was used for the elimination of matrices by additional step. Accucat, Oasis HLB, and multi mode (9) were commonly used in acrylamide analysis. The analytical instruments such as GC-MS (21), GC-MS/MS (5) and LC-MS/MS (22) were used for qualification and quantitation.
Isotope dilution can be used efficiently for analyzing organic compounds in various food matrices. It can increase accuracy and precision in the real sample analysis. Calibration curve and concentration calculations are obtained with the ratio between sample and internal standard responses. In the previous analytical methods for HCAs, internal standards have been used such as caffeine, 1-naphthylamine, and L-norleucine (14). 2-Amino-3,4,7,8-tetramethyl-3Himidazo[4,5-f] quinoxaline (4,7,8-TriMeIQx) (19) has also been used as the internal standard for 10 species of HCAs. Isotopically labelled materials such as PhIP-d3 (18), MeIQx-d3 (23) and 14C-IQ (17) have been used as a single internal standard for several analytes. However, this cannot solve the problems such as the matrix effect, low recovery, and errors from calibration because one internal standard cannot represent many different kinds of analytes. Therefore, several isotope-labelled standards are needed to analyse different types of analytes.
As previous analytical methods have been studied mainly for fat foods for HCAs (20) and potatoes for acrylamide (6), they cannot be applied to various food matrices, therefore, it needs a fast and simple extracting and clean-up procedure appropriate for the characteristics and properties of each matrix. In this study, for the analysis of acrylamide and 12 species of HCAs (IQ, MeIQ, Glu-P-1, Glu-P-2, MeIQx, PhIP, Trp-P-1, Trp-P-2, AαC, MeAαC, Harman, and Norharman) using LC-MS/MS in the various agricultural matirces, foodstuffs are divided into three groups: non-fat solid, non-fat liquid, and fat solid. This study aimed to achieve significant accuracy, precision, and recovery by applying different internal standards to each analyte. Moreover, the performance of the established analytical method was evaluated in terms of linearity, accuracy, precision, limit of detection (LOD), and limit of quantitation (LOQ), and its applicability to real samples was investigated to confirm it as the analytical method of monitoring HCAs and acrylamide for the risk assessment in the total diet study.
MATERIALS AND METHODS
Reagents and instruments. All chemicals and solvents were of HPLC or analytical grade. HCA standards (IQ, MeIQ, MeIQx, Glu-P-1, Glu-P-2, Norharman, Harman, PhIP, Trp-P-1, Trp-P-2, AαC, and MeAαC) and isotopically labeled internal standards (IQ-d3, MeIQx-d3, Harman-d3, PhIP-d3, Trp-P-2-13C2, 15N, and MeAαC-d3) were purchased from Toronto Research Chemicals Inc. (Toronto, Canada). Every standard solution (1 mg/mL) was dissolved in methanol, and the mixture solution was prepared by the dilution, and all the standard solutions were stored in a refrigerator (−4℃) until analysis. Caffeic acid, ammonium formate, and formic acid were purchased from SigmaAldrich (St. Louis, MO, USA). All the HPLC grade solvents for the pretreatment and mobile phase were purchased from J. T. Baker (Phillipsburg, NJ). ChemElut (20 mL, unbuffered) was obtained from Agilent Technology (Santa Clara, CA, USA). Oasis HLB cartridge (60 mg, 3 mL) was purchased from Waters Corporation (Dublin, Ireland). Power Sonic 420 sonicator purchased from Hawshin Technology (Gwangju, Korea) and C-SK shaker purchased from Changshin Scientific (Pocheon, Korea) were used for the pretreatment. For concentrating the extracts, a GMG-2000 evaporator from EYELA (Tokyo, Japan) was used. Nalgene Teflon tube and Pyrex glass tubes were purchased from Thermo Science (NY, USA).
Acrylamide standards and isotopically labeled internal standard were purchased from Accu Standard Inc. (St Market, CT, USA) and Cambridge Isotope Laboratories, Inc. (Tewksbury, MA, USA). Every standard solution was dissolved in water, and the mixture solution was prepared by the dilution. All the standard solutions were stored in a refrigerator (−4℃) until the analysis. All the HPLC grade solvents for the pretreatment and mobile phase were purchased from Sigma-Aldrich (St. Louis, MO, USA). Bond Elut Accucat cartridge (600 mg, 3 mL) was obtained from Agilent Technology (Santa Clara, CA, USA). Oasis HLB cartridge (200 mg, 6 mL) was purchased from Waters Corporation (Dublin, Ireland). A centrifuge machine was purchased from Hanil Science Industrial (Incheon, Korea).
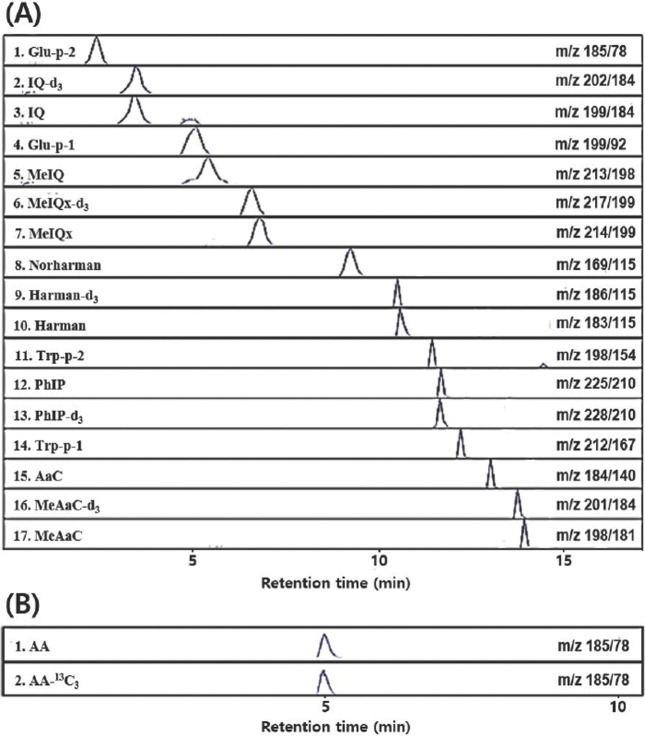
LC-MS/MS analysis. The HCA analysis was performed using an Agilent 1260 series HPLC system (Agilent Technologies, Palo Alto, CA, USA) coupled to API 3200 triple quadrupole mass spectrometer (MDS Sciex, Concord, ON, Canada) equipped with electrospray ionization (ESI). All the analytes were separated by an Atlantis T3 column (2.1 × 100 mm, i. d., 3 μm; Waters Corporation, Dublin, Ireland), maintained at 35℃. The mobile phase was 30 mM ammonium formate (pH 3.7) with water (A) and 100% acetonitrile (B), and gradient condition was as follows: 90% mobile phase A for 2 min; 2~2.5 min held at 87% A; 2.5~4 min, 87~86% A; 4~7.5 min, 86~66% A; 7.5~8.5 min, 66~50% A; 8.5~11 held at 50% A; 11~13 min, 50~0% A; and then returned to the initial condition for 13~20 min. The flow rate was 0.25 mL/min and 5 μL aliquot of the extracts was injected into the LC-MS/MS. A triple quadrupole mass spectrometer was used to detect the analytes by ESI in the positive mode. For selective and sensitive analysis, multiple reaction monitoring (MRM) mode was used to detect the product ions. The optimized parameters for MS were as follows: ionspray voltage, 5,500 V at 550℃; curtain gas, 25 psi; nebulizing gas, 50 psi; and heating gas, 50 psi. The mass conditions are listed in detail in Table 2, and the chromatograms are shown in Fig. 1.
Table 2. Optimized MS conditions.
| Compound | MRM transition | DPa (volts) | EPb (volts) | CEc (volts) | CEPd (volts) | CXPe (volts) |
|---|---|---|---|---|---|---|
|
| ||||||
| Glu-P-2 | 185.1→78.0 | 61 | 9.5 | 47 | 12 | 4 |
| IQ | 199.1→184.1 | 56 | 5 | 33 | 12 | 4 |
| Glu-P-1 | 199.1→92.0 | 96 | 5 | 47 | 14 | 4 |
| MeIQ | 213.1→198.1 | 61 | 10.5 | 33 | 14 | 4 |
| MeIQx | 214.1→199.2 | 86 | 4.5 | 33 | 12 | 4 |
| Norharman | 169.1→115.1 | 66 | 9.5 | 45 | 10 | 4 |
| Harman | 183.1→115.1 | 66 | 11 | 45 | 14 | 4 |
| Trp-p-2 | 198.1→154.2 | 61 | 10.5 | 39 | 16 | 4 |
| PhIP | 225.1→210.2 | 86 | 4.5 | 35 | 12 | 4 |
| Trp-p-1 | 212.1→167.1 | 61 | 4.5 | 47 | 12 | 4 |
| AaC | 184.1→140.1 | 56 | 10.5 | 41 | 14 | 4 |
| MeAaC | 198.1→181.2 | 131 | 5 | 29 | 16 | 4 |
| Acrylamide | 72.0→55.0 | 31 | 4.5 | 17 | 18 | 4 |
| AA-13C3 | 75.0→58.0 | 31 | 4 | 15 | 18 | 4 |
| IQ-d3 | 202.1→184.2 | 86 | 10.5 | 33 | 12 | 4 |
| MeIQx-d3 | 217.1→199.1 | 86 | 10 | 33 | 14 | 4 |
| Harman-d3 | 186.0→115. | 81 | 10.5 | 45 | 12 | 4 |
| PhIP-d3 | 228.1→210.1 | 71 | 4.5 | 39 | 14 | 4 |
| Trp-p-2-13C2,15N | 200.9→155.1 | 86 | 3.5 | 41 | 16 | 4 |
| MeAaC-d3 | 201.1→184.2 | 81 | 10.5 | 31 | 12 | 4 |
a: Declustering Potential, b: Entrance Potential, c: Collision Energy, d: Collision Cell Entrance Potential, e: Collision Cell Exit Potential.
Fig. 1. MRM chromatograms for (A) HCAs and (B) acrylamide (AA).
The acrylamide analysis was performed by using a Shimadzu 20AD HPLC system (Kyoto, Japan) coupled to API 3200 triple quadrupole mass spectrometer (MDS Sciex, Concord, ON, Canada) equipped with electrospray ionization (ESI). Analytes were separated with matrices using an Aqua C18 column (2 × 250 mm, i. d., 5 μm; Torrance, CA, USA), maintained at 40℃. The mobile phase was eluted by 0.2% acetic acid and 0.5% methanol in water by the isocratic mode. The flow rate was 0.2 mL/min and 25 μL was injected into the LC-MS/MS. A triple quadrupole mass spectrometer was used to detect the analytes by ESI in the positive mode. For selective and sensitive analysis, MRM mode was used to detect the product ions. The optimized parameters for the MS were as follows: ionspray voltage, 5,000 V at 550℃; curtain gas, 25 psi; nebulizing gas, 50 psi; and heating gas, 50 psi.
Extraction and clean-up procedures. For sample pretreatment, samples were classified into non-fat solid, non-fat liquid, and fat solid, according to the contents of fat, which with fat content > 20% were classified as fatty. Three types of samples, rice porridge, apple juice, and peanut butter, were used in the method validation as the matrix.
Heterocyclic amines: The method for twelve HCAs was modified to simplify the procedure described by Gross and Grüter (13).
Non-fat solid (Rice porridge): Rice porridge (5 g) was spiked with 100 ng of the internal standard mixture, 12 mL of 1 M sodium hydroxide, 14 mL of acetonitrile, and 1 mL of methanol. The sample was shaken for 10 min in a mechanical shaker to homogenize it and then separated by centrifugation at 7,000 rpm for 10 min at 25℃. The supernatant was loaded onto 20 mL ChemElut for 10 min and then eluted with 80 mL of a mixture of methylene chloride:ethyl acetate (3 : 1, v/v). The eluate was evaporated and redissolved in 2 mL water-methanol (9 : 1, v/v), and 0.5 mL of 1 M sodium hydroxide. This reconstituted solution was loaded onto HLB cartridge preconditioned with 1 mL of methanol and distilled water. The HLB cartridge was washed with 2 mL of 2% ammonia solution and eluted by using 3 mL of 2% acetic acid containing 90% methanol. Aliquot (5 μL) of the eluate was injected into LC-MS/MS.
Non-fat liquid (Apple juice): Apple juice (15 g) was spiked with 100 ng of the internal standards, followed by the addition of 0.5 mL of 1 M NaOH. The mixture was shaken for 10 min to homogenize it, and the resulting solution was adsorbed for 10 min after loading onto ChemElut and eluted with 80 mL of dichloromethane and ethyl acetate mixture at a v : v ratio of 3 : 1. This eluate was evaporated in a rotary evaporator, and then 2 mL of distilled water : MeOH (9 : 1, v/v) and 0.5 mL of 1 M NaOH were added to the effluent. This reconstituted solution was loaded onto an HLB cartridge, preconditioned with 1 mL of methanol and 1 mL of distilled water. The HLB cartridge was washed with 2 mL of 2% ammonia solution and eluted by 3 mL of 2% acetic acid containing 90% methanol and eluted with 3 mL of 2% acetic acid (90% MeOH) and were transferred into vials for the analysis by LC-MS/MS.
Fat solid (Peanut butter): Peanut butter (4 g) was spiked with 100 ng of the internal standards, followed by the addition of 15 mL of 1 M NaOH and 15 mL of acetonitrile. After, shaking for 10 min, the mixture was centrifuged for 10 min at 7,000 rpm to homogenize the mixture and separate the layers. This procedure was repeated twice, and then the supernatants were evaporated using a rotary evaporator. The residue was adsorbed for 10 min after loading onto ChemElut and eluted with 80 mL of dichloromethane and ethyl acetate (3 : 1 v : v). The eluate was evaporated using a rotary evaporator. Distilled water (2 mL) and MeOH at a ratio 9 : 1 and 0.5 mL of 1 M NaOH were added to the eluate and loaded onto the HLB cartridges conditioned with 1 mL of distilled water and 1 mL of MeOH, washed with 2 mL of 2% ammonia solution, eluted with 3 mL of 2% acetic acid (90% MeOH), and finally transferred to vials for the analysis by LC-MS/MS.
Acrylamide: The pretreatment of acrylamide was performed by the FDA method (24) for the three matrices (rice porridge, apple juice and peanut butter).
(a) Crushed sample (1 g) was weighed in a 50 mL polypropylene tube. (b) Internal standard solution (13C3-labeled acrylamide, 200 ng/mL, 1 mL) was added to the tube, followed by adding 9 mL of water to the test portion. The tube was shaken by hand or vortexed briefly to disperse test portion in water prior to the mixing. (c) Mixing was performed for 20 min in a rotating shaker. (d) The sample was centrifuged at 3,500 rpm for 20 min. Aliquot (5 mL) was filtered using a 0.45 μm PTFE syringe filter (Millipore, Bedford, MA, USA). (e) OASIS HLB cartridge was conditioned with 3.5 mL methanol, followed by 3.5 mL of water. Methanol and water effluent were discarded. (f) OASIS HLB cartridge was loaded with 1.5 mL extract. The extract was allowed to pass completely through the sorbent material. The column was eluted with 0.5 mL water and discarded. Elution was performed with additional 1.5 mL water and collected for following Accucat cartridge cleanup. (g) The outside of the Accucat SPE cartridge was marked at a height of 1 mL volume above the sorbent bed. Accycat SPE cartridge was conditioned with 2.5 mL methanol, followed by 2.5 mL of water. Methanol and water effluent were discarded. Extract (1.5 mL) collected in step (f) was loaded and eluted to 1 mL mark before collecting the remainder of the eluate, and 2 mL of sample was transferred to an amber auto-sampler vial for LC/MS/MS analysis.
Sample preparation. Eight types of agricultural products (apple juice, vinegar, flour, cereal, jam, chocolates, cookies, and potato chip) were analysed in this study. Representative foods were collected from 18 mega-markets in nine metropolitan cities (Seoul, Pusan, Incheon, Daegu, Daejeon, Kwangju, Ulsan, Suwon and Changwon) nationwide and made into composites by pooling them for total diet study. Matrix samples for validation were apple juice, peanut butter and rice porridge purchased from the retail markets. All samples were analysed according to the optimized procedure.
RESULTS AND DISCUSSION
Sample pretreatment. Pretreatment method of twelve HCAs was modified to simplify the procedure described by Gross and Grüter (13) and method for acrylamide was followed FDA method (24) for the three matrices (rice porridge, apple juice and peanut butter). In the analysis of HCAs, 1M NaOH was added to adjust pH to alkaline (pH 13.5) and acetonitrile was selected as the extraction solvent, which effectively eliminate lipid. Volume of the NaOH and acetonitrile was different depending on the matrix. For example, in non-fat liquid (apple juice) only 1mL of 1M NaOH was added and there was no need for acetonitrile extraction. In the preliminary study, we performed optimization of appropriate cartridges, elution solvents, and solvent composiotions, which are not shown. Cartridges of HLB, QuEChERS (PSA 400 mg, MgSO4 1200 mg), QuEChERS (PSA 400 mg, MgSO4 1200 mg, GCB 400 mg), and Chem Elut were examined and combination of Chem Elut and HLB was used as it gave best result. As the eluent for Chem Elut, methylene chloride:ethylacetate (3 : 1) was selected from the comparison of the several solvent compositions (methylene chloride:ethylacetate, 1 : 0, 3 : 1, 4 : 1, 1 : 1, 1 : 4, 0 : 1). In addition, methanol contents as the eluent of HLB was compared with the 30, 50, 70, 90% methanol containing 2% acetic acid and 90% methanol was selected because it showed best recovery for all analytes In the preliminary study of acrylamide, we firstly examined FDA method which represents for all foods and found that this method can be applied to three matrices (non-fat solid, non-fat liquid and fat solid) without any modifications. HLB clean-up after water extraction was used and followed by Accucat clean-up according to the FDA method through all samples in this study.
Method validation. To evaluate the effectiveness of the newly developed analytical method fitted to the three matrices, validation was performed using the parameters such as selectivity, recovery, accuracy, precision, linearity, LOD, and LOQ and verified with the criteria assigned in the CODEX guideline CAC/GL 71-2009. Samples fortified with all the analytes at their target concentrations (low, medium and high) were extracted and analyzed for the method verification.
Selectivity was validated by comparing the chromatogram to ensure that no interfering peaks were present at the retention times of 12 HCAs and acrylamide. The representative chromatograms with that standards and internal standards are shown in Fig. 1, indicating good peak separation with no interfering peaks.
Calibration curves for the matrix sample spiked with the standards were obtained by plotting the peak area ratio (y) versus the concentration (x) and verified by the correlation coefficient (R2) calculated by the weighted least-square linear regression method. The range of calibration curve was 10~200 ng and 1~400 ng/mL for the HCAs and acrylamide. The calibration curves (not shown) exhibited good linearity with R2 > 0.995.
Five replicates of the fortified samples (10, 50 and 100 ng for HCAs and 10, 100 and 500 ng/g for acrylamide) were determined for recovery, accuracy, and intra-day precision. Inter-day precision was analysed on the five different days in the same way. The precision was expressed as the relative standard deviation (RSD, %) and the accuracy was expressed as the recovery (%) of the mean observed concentration to the nominal concentration. Both the precision and accuracy data are summarized in Table 3. Intra-day precisions were in the range 1.6~13.3% RSD for nonfatty matrices and 2.0~19.9% for fatty matrix and these results are well within the acceptance range (RSD < 20%). Interday precisions (not shown in Table) were in the ranges 0.9~ 12.5% and 2.5~14.8% for nonfat matrices and fat solid, respectively, and are in the acceptable range.
Table 3. Precision, accuracy, LOD, and LOQ.
| Matrix | HCAs | AA | |||||||||||||
|---|---|---|---|---|---|---|---|---|---|---|---|---|---|---|---|
|
| |||||||||||||||
| Conc. AA (ng/g) | MeIQ | IQ | Glu-P-1 | Glu-P-2 | MeIQx | Norhrman | Harman | Trp-P-2 | PhIP | Trp-P-1 | AaC | MeAaC | |||
|
| |||||||||||||||
| Non-fat liquid | Intra-day precision (%) | 0.67 | 3.7 | 0.9 | 8.8 | 11.2 | 7.2 | 6.0 | 2.8 | 5.9 | 13.3 | 8.3 | 10.8 | - | 2.9 |
| 3.33 | 4.8 | 2.4 | 8.5 | 5.9 | 4.0 | 2.3 | 1.8 | 10.9 | 10.8 | 9.5 | 10.5 | 9.6 | 2.9 | ||
| 6.67 | 1.6 | 1.7 | 4.9 | 5.1 | 3.4 | 3.0 | 1.8 | 5.8 | 8.9 | 7.6 | 7.5 | 2.0 | 2.4 | ||
| Accuracy (%) | 0.67 | 107.1 | 109.4 | 95.9 | 106.5 | 114.7 | 72.7 | 73.7 | 104.4 | 110.1 | 99.8 | 117.4 | - | 105.3 | |
| 3.33 | 97.0 | 108.9 | 106.8 | 109.9 | 103.2 | 104.6 | 98.1 | 114.5 | 108.2 | 104.8 | 92.6 | 95.5 | 100.1 | ||
| 6.67 | 103.6 | 108.9 | 84.9 | 93.7 | 100.9 | 101.9 | 100.9 | 112.1 | 106.7 | 117.8 | 78.3 | 101.4 | 96.2 | ||
| LOD LOQ (ng/g) | LOD | 0.09 | 0.023 | 0.19 | 0.26 | 0.18 | 0.088 | 0.045 | 0.15 | 0.34 | 0.19 | 0.28 | - | 2.69 | |
| LOQ | 0.27 | 0.072 | 0.56 | 0.79 | 0.56 | 0.27 | 0.14 | 0.45 | 1.033 | 0.58 | 0.85 | 4.68 | 8.89 | ||
| Non-fat solid | Intra-day precision (%) | 2 | 4.4 | 3.0 | 3.8 | 3.7 | 2.0 | 4.0 | 4.8 | 5.0 | 3.2 | 3.9 | 4.6 | - | 2.5 |
| 10 | 3.2 | 3.7 | 4.4 | 4.5 | 2.0 | 2.6 | 4.2 | 10.0 | 4.8 | 2.6 | 4.4 | 4.5 | 2.4 | ||
| 20 | 1.9 | 2.2 | 2.3 | 4.1 | 2.7 | 4.8 | 4.8 | 4.8 | 2.8 | 1.6 | 4.9 | 2.0 | 2.4 | ||
| Accuracy (%) | 2 | 95.9 | 107.7 | 113.5 | 108.5 | 114.9 | 105.3 | 108.1 | 98.2 | 101.2 | 108.3 | 83.3 | - | 103.9 | |
| 10 | 95.4 | 107.7 | 80.5 | 81.5 | 98.1 | 100.7 | 99.6 | 71.8 | 84.7 | 103.1 | 94.7 | 119.1 | 97.6 | ||
| 20 | 97.2 | 98.1 | 102.0 | 97.8 | 98.6 | 96.9 | 83.9 | 99.1 | 99.8 | 108.4 | 90.1 | 106.4 | 95.2 | ||
| LOD LOQ (ng/g) | LOD | 0.28 | 0.21 | 0.29 | 0.26 | 0.15 | 0.28 | 0.34 | 0.28 | 0.21 | 0.28 | 0.5 | 2.32 | 3.07 | |
| LOD | 0.85 | 0.65 | 0.87 | 0.80 | 0.46 | 0.84 | 1.04 | 0.86 | 0.65 | 0.85 | 1.5 | 7.03 | 10.13 | ||
| Fat solid | Intra-day precision (%) | 2.5 | 10.3 | 8.2 | 9.6 | 4.0 | 8.4 | 19.9 | 19.7 | 5.9 | 14.2 | 12.4 | 11.5 | - | 2.2 |
| 12.5 | 7.2 | 10.3 | 6.3 | 5.3 | 14.8 | 5.2 | 11.6 | 3.2 | 2.2 | 4.1 | 12.8 | 13.4 | 2.0 | ||
| 25 | 6.3 | 6.5 | 6.0 | 4.4 | 6.5 | 8.1 | 5.0 | 7.2 | 9.7 | 13.0 | 9.6 | 5.5 | 2.1 | ||
| Accuracy (%) | 2.5 | 94.8 | 107.5 | 89.8 | 90.8 | 115.0 | 103.9 | 94.4 | 93.1 | 108.5 | 105.8 | 113.0 | - | 85.8 | |
| 12.5 | 98.4 | 102.0 | 85.4 | 90.2 | 100.3 | 116.5 | 95.1 | 102.6 | 109.7 | 99.5 | 99.5 | 106.3 | 100.6 | ||
| 25 | 97.4 | 93.0 | 77.9 | 75.9 | 90.8 | 85.5 | 97.0 | 89.6 | 98.3 | 97.0 | 84.5 | 75.1 | 102.9 | ||
| LOD LOQ (ng/g) | LOQ | 0.64 | 0.68 | 0.57 | 0.23 | 0.64 | 1.36 | 1.23 | 0.39 | 1.01 | 0.87 | 0.86 | 2.59 | 3.00 | |
| LOQ | 1.95 | 2.05 | 1.73 | 0.71 | 1.94 | 4.13 | 3.72 | 1.17 | 3.08 | 2.63 | 2.6 | 7.86 | 9.91 | ||
The accuracies were in the ranges 71.8~119.1% and 75.9~115.0% for nonfatty matrices and fatty solid, respectively, and are well within CODEX criteria (70~120%), for which the acceptable range is different depending on the concentrations. Highly reproducible accurate results demonstrate the reliability of this method for residue analyses. Analyte-free matrices were used to evaluate the extraction recovery. Using the peak areas of analytes obtained by diluted standard solutions spiked into extracts after the extraction as A, and the peak areas of the diluted standard solutions spiked before extraction as B, the extraction recoveries were calculated as extraction recovery (%) = B/A × 100. The extraction recoveries (not shown in Table) were in the range 70.9~118.9% and 72.8~102.6% for nonfatty matrices and for fatty solid, respectively, except for Trp-P-2 (66.0%). The extraction recovery of Trp-P-2 was poor (< 70%); however calibration curves were derived from the spiked matrix and accuracy (93.1%) was within the criteria (70~120%). Therefore, this method can be applicable to real sample analysis.
To determine the LOD and LOQ, 10 ng of HCA and acrylamide standards were spiked into each matrix, and five replicates were analysed. The LOD was calculated as 3.3 times of the standard deviation and 10 times of standard deviation for LOQ. LOD and LOQ values are shown in Table 3. LOD of HCAs was in the range 0.02~1.55 ng/mL, 0.15~2.32 ng/g and 0.23~2.59 ng/g for non-fat liquid, nonfat solid and fat solid, respectively. Even though these matrices are different with those of the literature, LODs are similar level with previous LODs ranged in 0.05~4 ng/g (25), which are appropriate for the HCAs analysis in the total diet study. For acrylamide, LOD was 2.69 ng/mL, 3.07 ng/g and 3.00 ng/g for non-fat liquid, non-fat solid and fat solid, respectively, which are also adequate level compared with the literature data, 0.1~10 ng/g (26,27).
Considering all these validation results, these methods for three kinds of matrices are reliable and accurate at a low concentration level (μg/kg) for the quantitation of HCAs and acrylamide in agricultural products.
Application to real samples. To evaluate the applicability of the proposed method, eight types of agricultural products (apple juice, vinegar, flour, cereal, jam, chocolates, cookie and potato chip) purchased from 18 retail markets from nine cities (South Korea) were analysed by the optimized analytical procedures.
In the previous study, HCAs in different foodstuffs after heating or cooking were as follows: in egg, MeIQx, Trp-P-1 and PhIP in the ranges of 0.32~4.08, 0.14~3.24 and 0.33~5.42 ng/g, respectively (19); in soybean product, IQ, MeIQx, PhIP, and AαC in the ranges of 0.13~1.96, 0.52~6.74, 0.03~6.45 and 0.23~1.85 ng/g, respectively (19); in wine, IQ, Glu-P-2, PhIP and MeAαC in the ranges of 10, 8, 12.3~83 and 15~107 ng/L (18); in beer, PhIP in the range of 8.0~25.1 ng/L (28); and in the processed spices, IQ and MeIQx in the ranges of 2.1~9.6 and 8.9~12.3, respectively (23). Acrylamide was 11~1,057 ng/g in cereals, not detected (ND)-909 ng/g in chocolates, 36~432 ng/g in cookies, 117~ 2,762 ng/g in potato chips (26), and ND-889 ng/g in tea products (27).
In this study, among the 12 HCAs and acrylamide, only harman, norharman and acrylamide were detected from eight samples. Harman and norharman were detected in the range of ND-8.50 ng/g, and concentrations of acrylamide were in the range of ND-369.4 ng/g. These results are similar to or below the reported data (Harman: ND-91.7, norharman: ND-187.4, acrylamide: ND-2,762 ng/g) as shown in Table 4.
Table 4. Comparison of the results of this study with literature.
| Matrix | Sample | Literature data (ng/g) | This study (ng/g) | ||||
|---|---|---|---|---|---|---|---|
|
| |||||||
| Harman* | Norharman* | AA** | Harman | Norharman | AA | ||
|
| |||||||
| Non-fat liquid | Fruit juice (apple juice) | ND-1.8 | ND-5.5 | - | ND | 0.10 ± 0.00 | ND |
| Vinegar | ND-14.3 | ND -3.5 | - | 2.04 ± 0.20 | 1.91 ± 0.15 | ND | |
| Non-fat solid | Flour | ND-0.8 | ND | - | ND | 0.53 ± 0.06 | ND |
| Cereal | ND-91.7 | ND -187.4 | 11-1,057 | 1.40 ± 0.10 | 6.80 ± 0.56 | 57.28 ± 6.56 (almond) | |
| 47.38 ± 1.64 (normal) | |||||||
| 162.18 ± 20.22 (chocolate) | |||||||
| Jam | ND-0.41 | ND -1.07 | - | 2.20 ± 0.30 | ND | ND | |
| Fat solid | Chocolates | 5.7-16.6 | 4.14-10.9 | ND-909 | 6.73 ± 0.63 (pie) | 4.60 ± 0.46 (pie) | 80.54 ± 10.65 (pie) |
| 8.50 ± 0.10 (chip) | 8.03 ± 0.25 (chip) | 112.16 ± 4.79 (chip) | |||||
| Cookies (butter) | ND-2.07 | ND-65.4 | 36-432 | 1.17 ± 0.06 | 7.97 ± 1.51 | 102.02 ± 8.87 | |
| Potato Chip | - | - | 117-2,762 | ND | ND | 369.40 ± 30.13 | |
ND: not detected
*: Reference 29
**: Reference 26
In conclusion, analytical methods using the LC-MS/MS MRM mode to detect 12 species of HCAs (IQ, MeIQ, GluP-1, Glu-P-2, MeIQx, Trp-P-1, Trp-P-2, PhIP, AaC, MeAaC, Harman, and Norharman) and acrylamide formed mainly by the Maillard reaction were established using six isotope labelled internal standards (IQ-d3, MeIQx-d3, PhIP-d3, Trp-P-2-13C2-15N, MeAaC-d3, and AA-13C3) in agricultural foods. The established method was successfully evaluated using the parameters according to the CODEX guideline CAC/GL 71-2009 and showed good precision, accuracy and recovery. Detection limits were in the adequate range for all analytes and this method was successfully applied to real samples. It could be used as a promising analytical method to monitor HCAs and acrylamide for the risk assessment in the total diet study and the results of real sample analysis may be used as a preliminary data for the strategy on the reduction of hazardous compounds in the food.
Acknowledgments
This study was supported by a grant (13162MFDS049) from Ministry of Food and Drug Safety in 2013-2014.
References
- 1.Felton J.S., Malfatti M.A., Knize M.G., Salmon C.P., Hopmans E.C., Wu R.W. Health risks of heterocyclic amines. Mutat. Res. (1997);376:37–41. doi: 10.1016/S0027-5107(97)00023-7. [DOI] [PubMed] [Google Scholar]
- 2.Skog K.I., Johansson M.A., Jagerstad M.I. Carcinogenic heterocyclic amines in model systems and cooked foods: a review on formation, occurrence and intake. Food Chem. Toxicol. (1998);36:879–896. doi: 10.1016/S0278-6915(98)00061-1. [DOI] [PubMed] [Google Scholar]
- 3.Tekkeli S.E.K., Önal C., Önal A. A review of current methods for the determination of acrylamide in food product. Food Anal. Methods. (2012);5:29–39. doi: 10.1007/s12161-011-9277-2. [DOI] [Google Scholar]
- 4.Lee M.R., Chang L.Y., Dou J. Determination of acrylamide in food by solid-phase microextraction coupled to gas chromatography-positive chemical ionization tandem mass spectrometry. Anal. Chim. Acta. (2007);582:19–23. doi: 10.1016/j.aca.2006.08.042. [DOI] [PubMed] [Google Scholar]
- 5.Hoenicke K., Gatermann R., Harder W., Hartig L. Analysis of acrylamide in different foodstuffs using liquid chromatography-tandem mass spectrometry and gas chromatography-tandem mass spectrometry. Anal. Chim. Acta. (2004);520:207–215. doi: 10.1016/j.aca.2004.03.086. [DOI] [Google Scholar]
- 6.Şenyuva H.Z., Gökmen V. Interference-free determination of acrylamide in potato and cereal-based foods by a laboratory validated liquid chromatography-mass spectrometry method. Food Chem. (2006);97:539–545. doi: 10.1016/j.foodchem.2005.06.005. [DOI] [Google Scholar]
- 7.Ohgaki H., Takayama S., Sugimura T. Carcinogenicities of heterocyclic amines in cooked food. Mutat. Res. (1991);259:399–410. doi: 10.1016/0165-1218(91)90130-E. [DOI] [PubMed] [Google Scholar]
- 8.International Agency for Research on Cancer (IARC) IARC Monographs on the evaluation of carcinogenic risk to humans (volume 56). Lyon, France: (1993). pp. 165–229. [PMC free article] [PubMed] [Google Scholar]
- 9.Rosén J., Hellenäs K.E. Analysis of acrylamide in cooked foods by liquid chromatography tandem mass spectrometry. Analyst. (2002);127:880–882. doi: 10.1039/b204938d. [DOI] [PubMed] [Google Scholar]
- 10.Chen Y.H., Xia E.Q., Xu X.R., Ling W.H., Li S., Wu S., Deng G.F., Zou Z.F., Zhou J., Li H.B. Evaluation of acrylamide in food from China by a LC/MS/MS method. Int. J. Environ. Res. Public Health. (2012);9:4150–4158. doi: 10.3390/ijerph9114150. [DOI] [PMC free article] [PubMed] [Google Scholar]
- 11.LoPachin R.M. The changing view of acrylamide neurotoxicity. Neurotoxicology. (2004);25:617–630. doi: 10.1016/j.neuro.2004.01.004. [DOI] [PubMed] [Google Scholar]
- 12.Gross G.A. Simple method for quantifying mutagenic heterocyclic aromatic amines in food products. Carcinogenesis. (1990);11:1597–1603. doi: 10.1093/carcin/11.9.1597. [DOI] [PubMed] [Google Scholar]
- 13.Gross G.A., Gruter A. Quantitation of mutagenic/carcinogenic heterocyclic aromatic amines in food products. J. Chromatogr. A. (1992);592:271–278. doi: 10.1016/0021-9673(92)85095-B. [DOI] [PubMed] [Google Scholar]
- 14.Polak T., Andrenšek S., Žlender B., Gašperlin L. Effects of ageing and low internal temperature of grilling on the formation of heterocyclic amines in beef Longissimusdorsi muscle. Food Sci. Technol. (2009);42:256–264. [Google Scholar]
- 15.Zhang Y., Lin C., Fang G., Mei J., Wang X., Wang S. Tandem solid phase extraction coupled to LC-ESI-MS/MS for the accurate simultaneous determination of five heterocyclic aromatic amines in processed meat products. Eur. Food Res. Technol. (2012);234:197–205. doi: 10.1007/s00217-011-1624-4. [DOI] [Google Scholar]
- 16.Sun L., Zhang F., Yong W., Chen S., Yang M.L., Ling Y., Chu X., Lin J.M. Potential sources of carcinogenic heterocyclic amines in Chinese mutton shashlik. Food Chem. (2010);123:647–652. doi: 10.1016/j.foodchem.2010.05.019. [DOI] [Google Scholar]
- 17.Stavric B., Lau B.P., Matula T.I., Klassen R., Lewis D., Downie R.H. Mutagenic heterocyclic aromatic amines (HAAs) in ‘processed food flavour’ samples. Food Chem. Toxicol. (1997);35:185–197. doi: 10.1016/S0278-6915(96)00119-6. [DOI] [PubMed] [Google Scholar]
- 18.Richling E., Decker C., Haring D., Herderich M., Schreier P. Analysis of heterocyclic aromatic amines in wine by high-performance liquid chromatography-electrospray tandem mass spectrometry. J. Chromatogr. A. (1997);791:71–77. doi: 10.1016/S0021-9673(97)00842-X. [DOI] [PubMed] [Google Scholar]
- 19.Lan C.M., Chen B.H. Effects of soy sauce and sugar on the formation of heterocyclic amines in marinated foods. Food Chem. Toxicol. (2002);40:989–1000. doi: 10.1016/S0278-6915(02)00013-3. [DOI] [PubMed] [Google Scholar]
- 20.Janoszka B., Blaszczyk U., Damasiewicz-Bodzek A., Sajewicz M. Analysis of heterocyclic amines (HAs) in pan-fried pork meat and its gravy by liquid chromatography with diode array detection. Food Chem. (2009);113:1188–1196. doi: 10.1016/j.foodchem.2008.08.005. [DOI] [Google Scholar]
- 21.Alves R.C., Soares C., Casal S., Fernandes J.O., Oliveira M.B.P.P. Acrylamide in espresso coffee: influence of species, roast degree and brew length. Food Chem. (2010);119:929–934. doi: 10.1016/j.foodchem.2009.07.051. [DOI] [Google Scholar]
- 22.Andrzejewski D., Roach J.A., Gay M.L., Musser S.M. Analysis of coffee for the presence of acrylamide by LC-MS/MS. J. Agric. Food Chem. (2004);52:1996–2002. doi: 10.1021/jf0349634. [DOI] [PubMed] [Google Scholar]
- 23.Richling E., Kleinschnitz M., Schreier P. Analysis of heterocyclic aromatic amines by high resolution gas chromatography-mass spectrometry: a suitable technique for the routine control of food and process flavours. Eur. Food Res. Technol. (1999);210:68–72. doi: 10.1007/s002170050535. [DOI] [Google Scholar]
- 24.US Food and Drug Administration (FDA) Draft: Detection and quantitation of acrylamide in foods. (2003) Available from: http://www.fda.gov/Food/FoodborneIllnessContaminants/Chemical Contaminants .
- 25.Pais P., Moyano E., Puignou L., Galceran M.T. Liquid chromatography-electrospray mass spectrometry with in-source fragmentation for the identification and quantification of fourteen mutagenic amines in beef extracts. J. Chromatogr. A. (1997);775:125–136. doi: 10.1016/S0021-9673(97)00274-4. [DOI] [PubMed] [Google Scholar]
- 26.Roach J.A., Andrzejewski D., Gay M.L., Nortrup D., Musser S.M. Rugged LC-MS/MS survey analysis for acrylamide in foods. J. Agric. Food Chem. (2003);51:7547–7554. doi: 10.1021/jf0346354. [DOI] [PubMed] [Google Scholar]
- 27.Lee S., Yoo M., Koo M., Kim H.J., Kim M., Park S.K., Shin D. In-house-validated liquid chromatography– tandem mass spectrometry (LC-MS/MS) method for survey of acrylamide in various processed foods from Korean market. Food Sci. Nutr. (2013);1:402–407. doi: 10.1002/fsn3.56. [DOI] [PMC free article] [PubMed] [Google Scholar]
- 28.Manabe S., Suzuki H., Wada O., Ueki A. Detection of the carcinogen 2-amino-1-methyl-6-phenyl-imidazo[4,5-b]pyridine (PhIP) in beer and wine. Carcinogenesis. (1993);14:899–901. doi: 10.1093/carcin/14.5.899. [DOI] [PubMed] [Google Scholar]
- 29.Herraiz T. Relative exposure to β-carbolinesnorharman and harman from foods and tobacco smoke. Food Addit. Contam. (2004);21:1041–1050. doi: 10.1080/02652030400019844. [DOI] [PubMed] [Google Scholar]


