Abstract
3-Monochloro-1,2-propanediol (3-MCPD) and 1,3-dichloro-2-propanol (1,3-DCP) are not only produced in the manufacturing process of foodstuffs such as hydrolyzed vegetable proteins and soy sauce but are also formed by heat processing in the presence of fat and low water activity. 3-MCPD exists both in free and ester forms, and the ester form has been also detected in various foods. Free 3-MCPD and 1,3-DCP are classified as Group 2B by the International Agency for Research on Cancer. Although there is no data confirming the toxicity of either compound in humans, their toxicity was evidenced in animal experimentation or in vitro. Although few studies have been conducted, free 3-MCPD has been shown to have neurotoxicity, reproductive toxicity, and carcinogenicity. In contrast, 1,3-DCP only has mutagenic activity. The purpose of this study was to analyze 3-MCPD and 1,3-DCP in various foods using gas chromatography -mass spectrometry. 3-MCPD and 1,3-DCP were analyzed using phenyl boronic acid derivatization and the liquid–liquid extraction method, respectively. The analytical method for 3-MCPD and 1,3-DCP was validated in terms of linearity, limit of detection (LOD), limit of quantitation, accuracy and precision. Consequently, the LODs of 3-MCPD and 1,3-DCP in various matrices were identified to be in the ranges of 4.18~10.56 ng/g and 1.06~3.15 ng/g, respectively.
Keywords: 3-Monochloro-1,2-propanediol; 1,3-Dichloro-2-propanol; Gas chromatography-mass spectrometry; Total diet study; Phenyl boronic acid; Derivatization; Liquid-liquid extraction
INTRODUCTION
3-Monochloro-1,2-propanediol (3-MCPD) and 1,3-dichloro-2-propanol (1,3-DCP) are found in acid-hydrolyzed vegetable proteins (HVPs). 3-MCPD, with a molecular formula of C3H7ClO2, is a colorless liquid that can change to a straw color. It has a pleasant odor and is soluble in water, alcohol, diethyl ether, and acetone. 3-MCPD exists both in free and ester forms. 3-MCPD esters (called bound 3-MCPD) comprise monoesters and diesters. 1,3-DCP, with a molecular formula of C3H6Cl2O, is a liquid with an ethereal odor and has a high solubility in water (1). These compounds are usually used as chemosterilants for rodents, as raw material for epichlorohydrin, and as fumigants against insects (2,3).
Previous studies indicate that free 3-MCPD is not a naturally occurring compound and has been detected in the environment and in food. Free 3-MCPD has been found in food put through the heat process in the presence of fat and had low water activity during studies on the potential utility of its the precursors such as glycerol, ally alcohol, lipids and hydrochloric acid as well as carbohydrates with aqueous hydrochloric acid (4-9). Moreover, free 3-MCPD in the environment can originate from wastewater and used epichlorohydrin–linked cationic polymer resins in water purification plants (10,11). In contrast, the formation mechanism for bound 3-MCPD is not exactly identified; however, it is generally found in thermally processed foods, refined oil, goat milk, and human milk (12,13). 1,3-DCP is known to occur not only in the products from food processing procedures such as baking, toasting or roasting, but also in drinking water processed in water purification plants using epichlorohydrin-linked cationic polymer resin (5,6,10). In general, the concentration of 1,3-DCP was determined to be lower than that of 3-MCPD in all foodstuffs except meat products.
Free 3-MCPD and 1,3-DCP were classified as Group 2B compound by the International Agency for Research on Cancer (IARC). Although data is lacking on their toxicity in humans, their toxicities were evidenced by animal experimentation or in vitro. A lot of studies indicate that free 3-MCPD has neurotoxicity, reproductive toxicity, and carcinogenicity (14-16). In contrast, 1,3-DCP only has mutagenic activity (17). Thus, many countries such as the USA, European Union, China, and Korea have regulated the maximum concentration limits, ranging from 0.02 to 1 mg/kg in acid HVP and soy sauce. However, there is no regulation on bound 3-MCPD because of insufficient evidence on its toxicity. 1,3-DCP also has no regulation in spite of its mutagenic activity. The average dietary exposure of the population to 3-MCPD and 1,3-DCP from consuming various foods is 0.02~0.7 and 0.051 μg/kgbody weight per day, respectively.
3-MCPD is analyzed by high-performance liquid chromatography equipped refractive index detector, because it has no chromophore. Therefore, analysis of 3-MCPD and 1,3-DCP has been mostly performed by gas chromatographyelectron capture detector (GC-ECD) or gas chromatography-mass spectrometry (GC-MS) for the determination of trace quantities. Using these techniques, direct analytical methods are required for different GC columns for simultaneous analysis as well as the quantitation of trace amounts. 1,3-DCP has been directly analyzed using steam distillation or headspace, which is quick, easy, and effective (18,19). However, fragments with low mass values can be less reliable.
Many studies tend to develop analytical methods for derivatization by reagents such as bis(trimethylsilyl)trifluoroacetamide, heptafluorobutyric anhydride (HFBA), heptafluorobutyrylimidazole (HFBI), ketones, and phenylboronic acid (PBA) (20-23). HFBA and HFBI are mostly used, because of the advantage of simultaneous analysis and high specificity associated with mass spectrometric detection at higher mass fragments. Ketones or PBA derivatization are commonly used when determining 3-MCPD because they react with diols. Moreover, the derivatization with PBA has the advantage of short analysis time compared to other derivatizations methods and can also be performed in the aqueous phase.
The aim of this study was to analyze free 3-MCPD and 1,3-DCP using PBA and liquid-liquid extraction (LLE) in foodstuffs for a total diet study (TDS).
MATERIALS AND METHODS
Reagents and materials. 1,3-DCP (Sigma-Aldrich, St. Louis, MO, USA), 3-MCPD (Sigma-Aldrich, St. Louis, MO, USA), 1,3-DCP-d5 (C/D/N isotope, Poin-Claire, Quebec, Canada) and 3-MCPD-d5 (C/D/N isotope, Poin-Claire, Quebec, Canada) were purchased and their calibration curves were generated by the isotope dilution method. Stock solutions of the standards and isotopes (1000 μg/mL) were prepared in ethyl acetate (J.T Baker, center valley, PA, USA). The working solutions were prepared by dilution of the standard solution using ethyl acetate. PBA (25% solution), prepared using 2.5 g PBA (Sigma-Aldrich, St. Louis, MO, USA), 9.5 mL acetone (J.T Baker, center valley, PA, USA), and 0.5 mL distilled water (Milli-Q purification system, Millipore, Billerica, MA, USA) was used for the derivatization of 3-MCPD. Methyl tert-butyl ether and hexane were obtained from J. T. Baker (center valley, PA, USA) and acetonitrile for deproteinization was purchased from Burdick & Jackson (Gangnam-gu, Seoul, Korea). Sodium chloride and sodium sulfate were obtained from Junsei (Chuo-ku, Tokyo, Japan).
Sample preparation.
1,3-DCP:
Nonfat liquid, lipoprotein liquid, alcoholic liquid, and nonfat solid samples: Samples (10 g) were weighted in a tube, followed by the addition of internal standard solution (1,3-DCP-d5, 10 μg/mL, 50 μL). The resulting mixtures were extracted using 15 mL methyl tert-butyl ether (MTBE). Then, the extracts were then dehydrated using 1g anhydrous sodium sulfate (Na2SO4), filtered, and evaporated to 1 mL under a gentle stream of nitrogen.
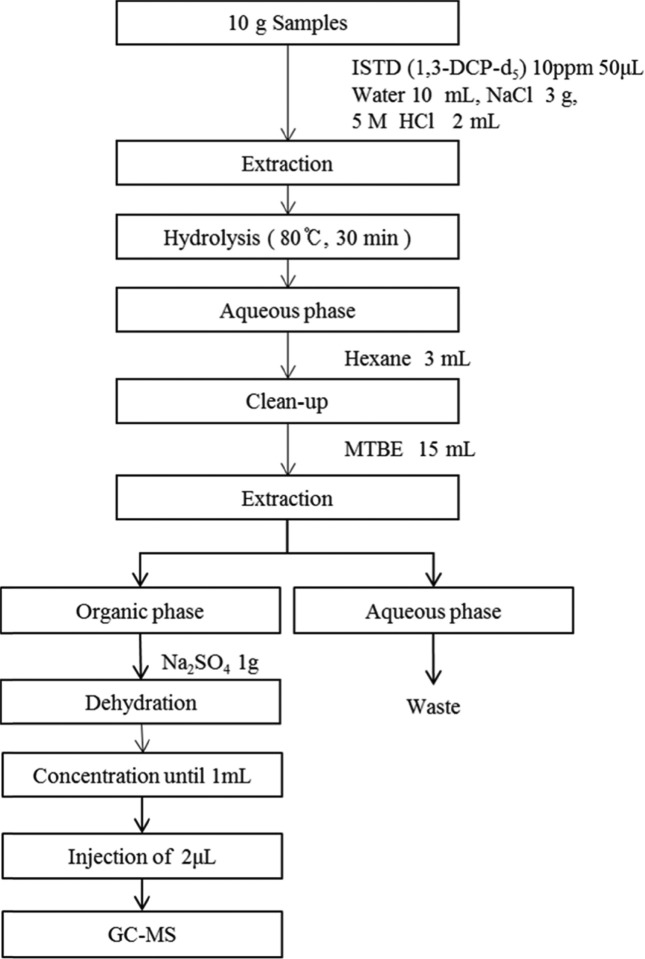
Fat liquid and fat solid samples: Samples (10 g) were weighted in a tube, followed by the addition of the internal standard solution (1,3- DCP-d5, 10 μg/mL, 50 μL). The samples were centrifuged at 1953 ×g for 5 min and extracted with 10 mL distilled water by shaking for 10 min by shaking. The separated samples were frozen at −20℃ for 30 min. The frozen aqueous solution eliminated from the oil was washed twice with 5mL hexane to remove any residual oil. Next, the melted aqueous solutions were cleaned with 3 mL hexane. In the case of fat solid samples, the clean-up was performed with 3 mL hexane. The preparation process for the fat solid samples is shown in Fig. 1. The rest of procedure after processing of the fat liquid and extraction of the fat solid sample was the same as described above.
Fig. 1. Scheme of analysis for 1,3-DCP in fat solid matrix.
Free 3-MCPD:
Nonfat liquid and alcoholic samples: PBA solution (25%, 100 μL) was added to the samples (10 g), which were spiked with the internal standard solution (3-MCPD-5, 100 μg/mL, 10 μL). The derivatization reaction was performed at room temperature for 10 min by shaking. After derivatization, the samples were extracted with 2 g NaCl and 2 mL hexane (twice). The extracts were dehydrated using 0.5 g anhydrous Na2SO4, filtered, and evaporated to 100 μL under a gentle stream of nitrogen.
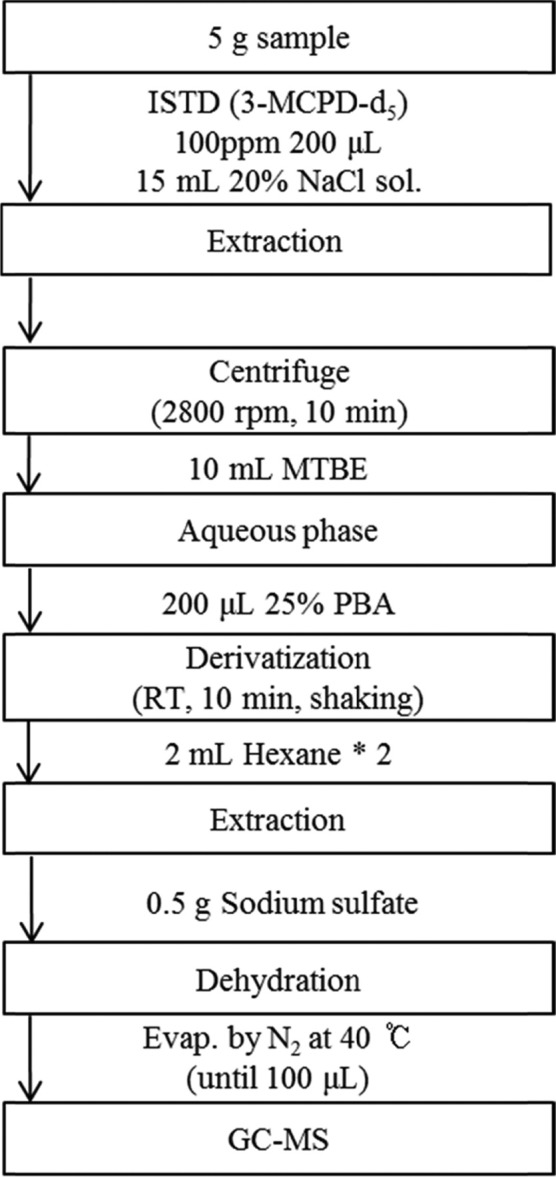
Fat liquid and fat solid samples: The scheme for preparation of the fat solid sample is briefly shown in Fig. 2. 10 μL of the 100 μg/mL internal standard solution (3-MCPD-5) was added to the samples (10 g) and the resulting solution was extracted with 10 mL distilled water for 10 min by shaking. To defat as well as clean-up the fat liquid and fat solid samples, they were subjected to a procedure similar to the 1,3-DCP preparation method for the samples. The defatted extracts were derivatized with 100 μL of 25% PBA solution. After the derivatization, the rest of the procedure was similar to those for the nonfat liquid and alcoholic samples.
Fig. 2. Scheme of analysis for 3-MCPD in fat solid matrix.
Lipoprotein liquid: For deproteinization, 15 mL acetonitrile was added to the samples (10 g) with the internal standard solution (3-MCPD-5, 100 μg/mL, 10 μL). The samples were deproteinized for 30 min by shaking and centrifuged at 1953 ×g for 5 min. The aqueous phase was transferred to another tube, followed by the addition of 2 g NaCl. Acetonitrile was removed using centrifugation, and the acetonitrile phase was homogenized to dissolve NaCl in the aqueous phase. To clean the lipophilic components, the aqueous phase was cleaned twice with 5 mL hexane. Then, the cleaned aqueous phase was processed in a manner similar to other samples.
GC-MS condition: 1,3-DCP was analyzed using Agilent 6890A-5975C GC-MS (Palo Alto, CA, USA) equipped with an electronic ion source (EI) and a 30 m DB-WAX (Palo Alto, CA, USA) column. In the case of 3-MCPD, Agilent 7890B-5977A GC-MS (Palo Alto, CA, USA) equipped with 17 m Ultra-2 (Palo Alto, CA, USA) column was used.
RESULTS AND DISCUSSION
Classification of samples for TDS. Prior to analysis, 841 samples were collected from commercial agricultural, animal, and aquatic products. The processed forms of these samples obtained from various markets at nine major cities were classified as nonfat liquid, nonfat solid, fat liquid, fat solid, lipoprotein liquid, and alcoholic liquid according to the food and nutrient data system from the Ministry of Food and Drug Safety in Korea. The Classification results are listed in Table 1.
Table 1. Classification results of TDS sample for the analysis of 3-MCPD and 1,3-DCP.
| Matrices | Representative sample | Sample (n) | |
|---|---|---|---|
|
| |||
| 3-MCPD | 1,3-DCP | ||
|
| |||
| Nonfat liquid | Water | 85 | 82 |
| Nonfat solid | Rice gruel | 497 | 489 |
| Fat liquid | Corn oil | 58 | 57 |
| Fat solid | Raw pork | 160 | 165 |
| Lipoprotein liquid | Milk | 30 | 32 |
| Alcoholic liquid | 5% ethanol | 21 | 21 |
Method validation. The analytical method for 3-MCPD and 1,3-DCP was validated using linearity, limit of detection (LOD) and limit of quantification (LOQ). The LOD and LOQ were determined by the equations LOD = 3.14 × σ and LOQ = 10 × σ, where σ is the standard deviation of the specific sample spiked standard solution. The accuracy and precision (inter- and intra-day) for the samples were also determined.
The validation results for the 3-MCPD analysis were evaluated as follows. The LODs of 3-MCPD in various matrices ranged from 4.18 to 10.56 ng/g. The accuracy and precision were found to be 90.38~122.46% and 1.89~25.22% relative standard deviation (RSD), respectively. In contrast, the LOD for 1,3-DCP following matrices was found to be in the range of 1.06~3.15 ng/g. The accuracy and precision were determined as 91.24~113.40%, 1.42~10.58% RSD, respectively. Moreover, all the 3-MCPD and 1,3-DCP calibration curves a variety of matrices showed a correlation coefficient value of ≥ 0.99.
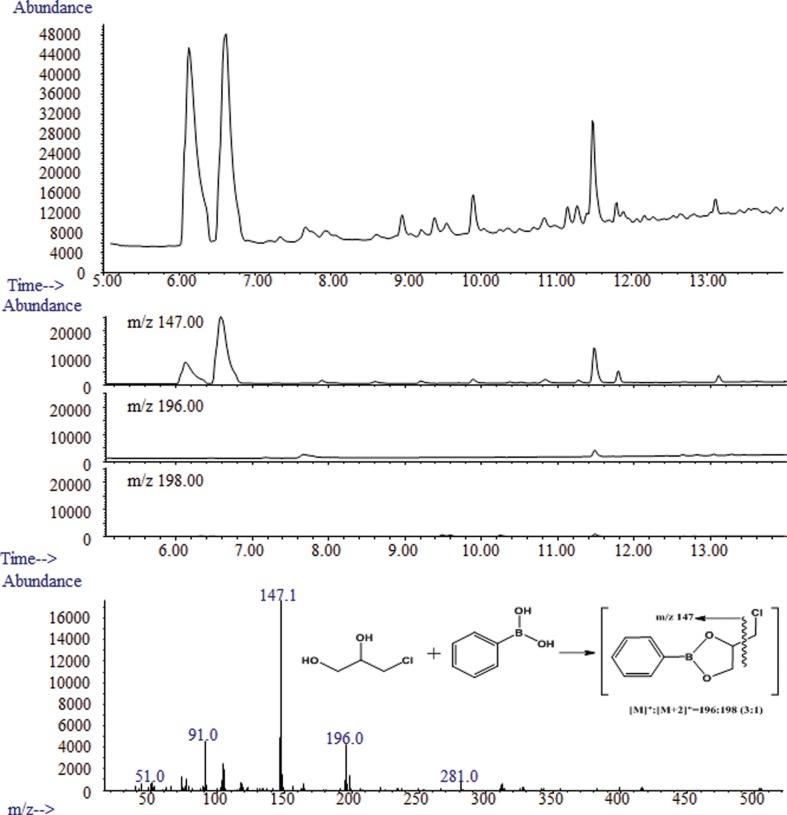
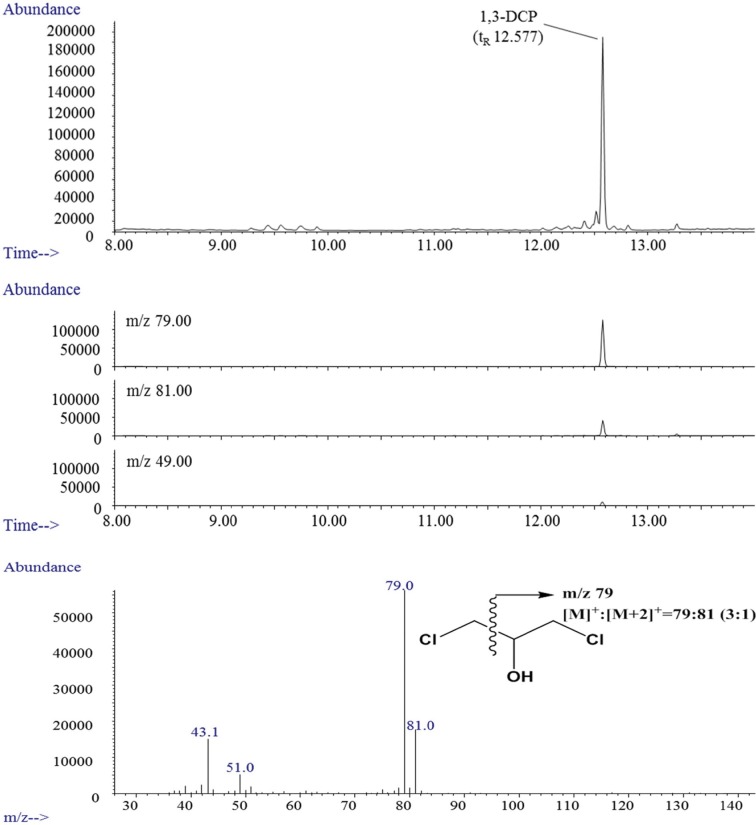
Determination of 3-MCPD and 1,3-DCP for TDS. To identify the characteristic ions in the PBA derivative of 3-MCPD and 1,3-DCP, the mass to charge ratio (m/z) was scanned in the range of 50~550. The characteristic ions were observed at m/z 147, 196, and 198 (derivative 3-MCPD), m/z 150, 201, and 203 (derivative 3-MCPD-d5), m/z 79, 81, and 49 (1,3-DCP) and m/z 82, 84, and 51 (1,3-DCP-d5). The ions with m/z 147, 150, 79, and 82 were used as the quantifier ions. The chromatograms for the 1,3-DCP and PBA derivative of 3-MCPD are displayed in Fig. 1 and 2, respectively. The qualification of PBA derivative 3-MCPD and 1,3-DCP was determined by the relative retention time of the sample and the standard solution, using the isotope ratio of ions such as m/z 196 and 198 for the PBA derivative of 3-MCPD and m/z 79 and 81 for 1,3-DCP.
Fig. 4. Total ion chromatogram of PBA derivatized 3-MCPD (upper), extracted ion chromatograms (middle), and GC-MS spectrum of PBA derivatized 3-MCPD (lower).
3-MCPD and 1,3-DCP were only detected in the fat solid matrix (raw material before cooking), and the results are listed in Table 2. Although the ball of meat had the highest concentration as among the 3-MCPD samples classified as fat solid matrix (raw material before cooking) with 1169.15 ng/g, 3-MCPD was not detected in the fried meat ball. The flounder had the highest 1,3-DCP value at 36.41 ng/g. The mean values of 3-MCPD and 1,3-DCP in the fat solid matrix samples were found to be 158.01 and 2.53 ng/g, respectively.
Table 2. Results of 3-MCPD and 1,3-DCP in the fat solid matrix (only raw material).
| Compounds | No. | Frequency | Detection rate (%) | Max. (ng g−1) |
|---|---|---|---|---|
|
| ||||
| 3-MCPD | 60 | 30 | 50.00 | 1169.15 |
| 1,3-DCP | 60 | 11 | 18.33 | 36.41 |
In this study, 3-MCPD and 1,3-DCP were identified in various foodstuffs for TDS. The analyses of 3-MCPD and 1,3-DCP were respectively performed by derivatization and the direct analytical method because the samples used in this study consisted of diverse matrices. Use of the PBA derivatization method for 3-MCPD and the direct analytical method for 1,3-DCP provide the advantage of short analysis time. However, the downside of using the direct analytical method for 1,3-DCP is that the technique not only yields higher LODs than the derivatization method, but cannot be used for simultaneous analysis of 3-MCPD like the PBA derivatization method. The lowest LOD for 1,3-DCP was found to be 1.06 ng/g (24,25) in this study, while other studies reported LOD values of ≥ 1 ng/g. Thus, improving the LOD for risk assessment and the development of reduction technology is necessary.
Fig. 5. Correlation with 3-MCPD and 1,3-DCP in the detected samples.
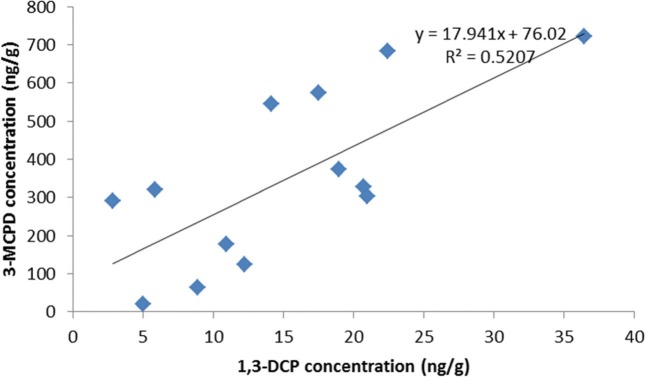
3-MCPD and 1,3-DCP were mainly detected in fat solid samples such as meat, seafood, and related products. These results corresponded with the results from Chung et al. (26) in which 3-MCPD and 1,3-DCP were detected in fat solid samples such as crab, pork, and sausage. This study demonstrates that 3-MCPD and/or 1,3-DCP can be generated in certain foods through cooking processes such as frying and steaming. The Joint FAO/WHO Expert Committee on Food Additives (JECFA) summarized the concentration of 3-MCPD and 1,3-DCP in food stuffs from various countries in 2001~2006. Fish and sea food were determined to have the highest detection rate for 1,3-DCP at 89.7%, while soy sauce-based products had the maximum value (9.84 mg/kg) and a higher mean value (0.11 mg/kg) than other products. 3-MCPD has a 100% detection rate in roasted coffee, with the highest maximum (1779 mg/kg) and mean (8.39 mg/kg) values in soy sauce and soy sauce-based products (27). Connat and Quayle et al. (5,6) reported that 3-MCPD and 1,3-DCP occur together in glycerol. Therefore, correlation analysis was performed for 3-MCPD and 1,3-DCP in samples in which they were both detected (n = 13), which were mostly aquatic products. The results appear to indicate a correlation between 3-MCPD and 1,3-DCP, with a correlation coefficient of 0.72. The correlation graphs for 3-MCPD and 1,3-DCP are shown in Fig. 3.
Fig. 3. 1,3-DCP chromatogram of total ion chromatogram (upper), extracted ion chromatogram (middle), and GC-MS spectrum of 1,3-DCP (lower).
Acknowledgments
This research was supported by a grant (13162MFDS049) from the Ministry of Food and Drug Safety in 2013-2015, the Eco Innovation Technology Development Program of the Ministry of Environment, and the industrial infrastructure program for fundamental technologies (N0000885), which is funded by the Ministry of Trade, Industry & Energy (MOTIE, Korea).
References
- 1.IARC (International Agency for Research on Cancer) Some chemicals present in industrial and consumer products, food and drinking water. IARC. (2013):349–387. [Google Scholar]
- 2.Buckle A. Ullmann’s encyclopedia of industrial chemistry (Buckle A.). Weinheim: (2005). pp. 569–578. [Google Scholar]
- 3.EPA (United States Environmental Protection Agency) Pesticide fact sheet. EPA; (2006). Available from: http://iaspub.epa.gov/apex/pesticides/f?p=CHEMICALSEARCH:3:0::NO:1,3,31,7,12,25:P3_XCHEMICAL_ID:4476 . [Google Scholar]
- 4.Breitling-Utzmann C.M., Hrenn H., Haase N.U., Unbehend G.M. Influence of dough ingredients on 3-chloropropane-1,2-diol (3-MCPD) formation in toast. Food Addit. Contam. (2005);22:97–103. doi: 10.1080/02652030500037936. [DOI] [PubMed] [Google Scholar]
- 5.Conant J. B., Quayle O.R. Glycerol α,γ-dichlorohydrin. Org. Synth. Collect. (1947);1:292–294. [Google Scholar]
- 6.Conant J. B., Quayle O.R. Glycerol α-monochlorohydrin. Org. Synth. Collect. (1947);1:294–296. [Google Scholar]
- 7.Doležal M., Calta P., Velíšek J. Formation and decomposition of 3-chloropropane-1,2-diol in model systems. Czech J. Food Sci. (2004);22:263–266. [Google Scholar]
- 8.Robert M.C., Oberson J.M., Stadler R.H. Model studies on the formation of monochloropropanediols in the presence of lipase. J. Agric. Food Chem. (2004);52:5102–5108. doi: 10.1021/jf049837u. [DOI] [PubMed] [Google Scholar]
- 9.Velíšek J., Calta P., Dolezal M., Crews C., Hasnip S. 3-Chloropropane-1,2-diol in models simulating processed foods: precursors and agents causing its decomposition. Czech J. Food Sci. (2003);21:153–161. [Google Scholar]
- 10.Bodén L., Lunddgren M., Stensio K.E., Gorzynski M. Determination of 1,3-dichloro-2-propanol in papers treated with polyamidoamine-epichlorohydrin wet-strength resins by gas chromatography-mass spectrometry using selective ion monitoring. J. Chromatogr. A. (1997);788:195–203. doi: 10.1016/S0021-9673(97)00711-5. [DOI] [Google Scholar]
- 11.Nienow A.M., Poyer I.C., Hua I., Jafvert C.T. Hydrolysis and H2O2-assisted UV photolysis of 3-chloro-1,2-propanediol. Chemosphere. (2009);75:1015–1020. doi: 10.1016/j.chemosphere.2009.01.053. [DOI] [PubMed] [Google Scholar]
- 12.Rahn A.K.K., Yaylayan V.A. What do we know about the molecular mechanism of 3-MCPD ester formation? Eur. J. Lipid Sci. Technol. (2011);113:323–329. doi: 10.1002/ejlt.201000310. [DOI] [Google Scholar]
- 13.Zelinková Z., Doležal M., Velíšek J. Occurrence of 3-chloropropane-1,2-diol fatty acid esters in infant and baby foods. Eur. Food Res. Technol. (2009);228:571–578. doi: 10.1007/s00217-008-0965-0. [DOI] [Google Scholar]
- 14.Cho W.S., Han B.S., Nam K.T., Park K., Choi M., Kim S.H., Jeong J., Jang D.D. Carcinogenicity study of 3-monochloropropane-1,2-diol in Sprague-Dawley rats. Food Chem. Toxicol. (2008);46:3172–3177. doi: 10.1016/j.fct.2008.07.003. [DOI] [PubMed] [Google Scholar]
- 15.Kim K. Differential expression of neuronal and inducible nitric oxide synthase in rat brain after subchronic administration of 3-monochloro-1,2-propanediol. Food Chem. Toxicol. (2008);46:955–960. doi: 10.1016/j.fct.2007.10.025. [DOI] [PubMed] [Google Scholar]
- 16.Paz G.F., Homonnai T.Z. A direct effect of a-chlorohydrin on rat epididymal spermatozoa. Int. J. Androl. (1982);5:308–316. doi: 10.1111/j.1365-2605.1982.tb00259.x. [DOI] [PubMed] [Google Scholar]
- 17.von der Hude W., Scheutwinkel M., Gramlich U., Fissler B., Basler A. Genotoxicity of threecarbon compounds evaluated in the SCE test in vitro. Environ. Mutagen. (1987);9:401–410. doi: 10.1002/em.2860090406. [DOI] [PubMed] [Google Scholar]
- 18.Crews C., LeBrun G., Brereton P.A. Determination of 1,3-dichloropropanol in soy sauces by automated headspace gas chromatography-mass spectrometry. Food Addit. Contam. (2002);19:343–349. doi: 10.1080/02652030110098580. [DOI] [PubMed] [Google Scholar]
- 19.Van Rillaer W., Beernaert H. Determination of residual 1,3-dichloro-2-propanol in protein hydrolysates by capillary gas chromatography. Z. Lebensm. Unters. Forsch. (1989);188:343–345. doi: 10.1007/BF01352394. [DOI] [PubMed] [Google Scholar]
- 20.Chung W.C., Hui K., Cheng S.C. Sensitive method for the determination of 1,3-dichloropropan-2-ol and 3-chloropropane-1,2-diol in soy sauce by capillary gas chromatography with mass spectrometric detection. J. Chromatogr. A. (2002);952:185–192. doi: 10.1016/S0021-9673(02)00062-6. [DOI] [PubMed] [Google Scholar]
- 21.Kissa E. Determination of 3-chloropropanediol and related dioxolanes by gas chromatography. J. Chromatogr. A. (1992);605:134–138. doi: 10.1016/0021-9673(92)85038-U. [DOI] [Google Scholar]
- 22.Pesselman R.L., Feit M.J. Determination of residual epichlorohydrin and 3-chloropropanediol in water by gas chromatography with electron-capture detection. J. Chromatogr. A. (1988);439:448–452. doi: 10.1016/S0021-9673(01)83859-0. [DOI] [PubMed] [Google Scholar]
- 23.Rétho C., Blanchard F. Determination of 3-chloropropane-1,2-diol as its 1,3-dioxolane derivative at the microg kg-1 level: application to a wide range of foods. Food Addit. Contam. (2005);22:1189–1197. doi: 10.1080/02652030500197680. [DOI] [PubMed] [Google Scholar]
- 24.Abu-El-Haj S., Bogusz M.J., Ibrahim Z., Hassan H., Tufail M.A. Rapid and simple determination of chloropropanols (3-MCPD and 1,3-DCP) in food products using isotope dilution GC-MS. Food Control. (2007);18:81–90. doi: 10.1016/j.foodcont.2005.08.014. [DOI] [Google Scholar]
- 25.Nyman P.J., Diachenko G.W., Perfetti G.A. Determination of 1,3-dichloropropanol in soy and related sauces by using gas chromatography/mass spectrometry. Food Addit. Contam. (2003);20:903–908. doi: 10.1080/02652030310001603783. [DOI] [PubMed] [Google Scholar]
- 26.Chung S.W.C., Kwong K.P., Yau J.C.W., Wong A.M.C., Xiao Y. Chloropropanols levels in foodstuffs marketed in Hong Kong. J. Food Compos. Anal. (2008);21:569–573. doi: 10.1016/j.jfca.2008.04.010. [DOI] [Google Scholar]
- 27.Williams G., Schnelder K., Leblanc J.C., Larsen J.C. Safety evaluation of certain food additives and contaminants. W.H.O. (2007);58:209–267. [Google Scholar]


