

Abstract
We report the effect on lipid bilayers of the Tat peptide Y47GRKKRRQRRR57 from the HIV-1 virus transactivator of transcription (Tat) protein. Synergistic use of low-angle X-ray scattering (LAXS) and atomistic molecular dynamics simulations (MD) indicate Tat peptide binding to neutral dioleoylphosphocholine (DOPC) lipid headgroups. This binding induced the local lipid phosphate groups to move 3 Å closer to the center of the bilayer. Many of the positively charged guanidinium components of the arginines were as close to the center of the bilayer as the locally thinned lipid phosphate groups. LAXS data for DOPC, DOPC/dioleoylphosphoethanolamine (DOPE), DOPC/dioleoylphosphoserine (DOPS), and a mimic of the nuclear membrane gave similar results. Generally, the Tat peptide decreased the bilayer bending modulus KC and increased the area/lipid. Further indications that Tat softens a membrane, thereby facilitating translocation, were provided by wide-angle X-ray scattering (WAXS) and neutron scattering. CD spectroscopy was also applied to further characterize Tat/membrane interactions. Although a mechanism for translocation remains obscure, this study suggests that the peptide/lipid interaction makes the Tat peptide poised to translocate from the headgroup region.
Keywords: Low-angle X-ray scattering (LAXS), wide-angle X-ray scattering (WAXS), molecular dynamics (MD) simulations, lipid bilayer structure cell-penetrating peptide, peptide translocation, membrane pore
Graphical Abstract
1. Introduction
The name cell-penetrating peptide (CPP) connotes a peptide that easily penetrates cell membranes (for Reviews see [1–3]). The present work focuses on the transactivator of transcription, Tat, from the HIV-1 virus, which plays a role in AIDS progression. Early work showed that the HIV-Tat transactivator protein (86 amino acids) was efficiently taken up by cells, and concentrations as low as 1 nM were sufficient to transactivate a reporter gene expressed from the HIV-1 promoter [4, 5]. It has been reported that Tat protein uptake does not require ATP [6]. Studies using inhibitors of different types of endocytosis, including clathrin- and caveolae-mediated, or receptor-independent macropinocytosis reached the same conclusion that ATP mediated endocytosis is not involved in Tat protein permeation [7–10]. However, this issue is controversial, as other studies found evidence for endocytosis in Tat protein import [11–19]. Still other studies have concluded that an ATP requirement for Tat protein entry depends on the size of the cargo attached to Tat protein, or on the specific cell type [20–22].
The part of the Tat protein responsible for cellular uptake was assigned to a short region Tat (48–60), G48RKKRRQRRRPPQ60, which is particularly rich in basic amino acids [6]. Deletion of three out of eight positive charges in this region caused loss of its ability to translocate [6]. In this manuscript short basic regions will be called Tat, while the entire 86-amino acid protein will be called Tat protein. Tat was shown to be responsible for the Tat protein’s permeation into the cell nucleus and the nucleoli [6], and this was confirmed using live cell fluorescence in SVGA cells [23]. Tat (48–60) was shown to have little toxicity on HeLa cells at 100 μM concentration [6], but the longer Tat protein (2–86) was toxic to rat brain glioma cells at 1–10 μM [24]. Interestingly, no hemolytic activity was found when human erythrocytes were incubated with a highly neurotoxic concentration (40 μM) of Tat (2–86) [24]. These results prompt the question, what is the mechanism of Tat’s translocation through membranes?
To address this question, many biophysical studies have used simple models of biological membranes composed of a small number of lipid types. These studies are valuable because there is no possibility for ATP-dependent translocation, thus ruling out endocytosis if translocation occurs. For example, Mishra et al. reported that the rate of entry into giant unilamellar vesicles (GUVs) composed of PS/PC (1:4 mole ratio) lipids of rhodamine-tagged Tat is immeasurably slow, but it crosses a GUV composed of PS/PC/PE (1:2:1) lipids within 30 seconds [25]. This study suggests that negative curvature induced by the inclusion of PE facilitates translocation. In a subsequent study using much smaller unilamellar vesicles (LUVs), Tat did not release an encapsulated fluorescent probe in LUVs composed of lipids modeling the outer plasma membrane, PC/PE/SM/Chol (1:1:1:1.5), but did release the probe in LUVs composed of BMP/PC/PE (77:19:4) [26]; BMP (bis(monoacylglycero)-phosphate) is an anionic lipid specific to late endosomes. In that study [26], the inclusion of PE did not suffice to cause leaky fusion in LUVs in the absence of a negatively charged lipid. The contrasting results in these two experiments may also be due to the use of LUVs instead of GUVs since it was reported that Tat does not translocate across LUVS of PC/PG (3:2) but does translocate across GUVs of the same lipid composition [27]. In a similar experiment, Tat did not translocate into egg PC LUVs [28]. In another experiment confirming these results, Tat did not translocate into GUVS containing only PC with 20 mol% cholesterol, but when PS or PE was included with PC, then rapid translocation of Tat was observed [29]. These experiments demonstrate that the choice of lipids and model systems influences Tat translocation.
Is a pore formed during Tat translocation? Although direct conductance measurements of Tat and lipid membranes have not been carried out, two studies measured conductance with the somewhat similar CPP oligoarginine R9C peptide. Using single-channel conductance of gramicidin A in planar lipid membranes consisting of anionic, neutral or positively charged lipids, R9C did not increase conductance, even in anionic lipid membranes [30]. By contrast, in a similar experiment using planar lipid membranes, a current was induced by R9C in PC/PG (3:1) membranes, with increasing destabilization over time [31]. Thus questions remain about pore formation of Tat in membranes. In the GUV experiment with Tat mentioned above [29], Ciobanasu et al., using size exclusion methods, suggested a pore in the nanometer range, which could only be passed by small dye tracer molecules. Thus, if a true pore forms, it is likely to be small and transitory.
What is the secondary structure of Tat in membranes? Circular dichroism (CD) spectroscopy was carried out on, where the penultimate proline on Tat (48–60) was replaced by a tryptophan [27]. That study found a random coil secondary structure in aqueous solution as well as when mixed with PC/PG/PE (65:35:5) LUVs. The same result was obtained using CD in PC/PG (3:1) vesicles by Ziegler et al.[10], indicating that an alpha helix is not required for Tat’s translocation ability. In addition, solid state NMR has identified a random coil structure of Tat in DMPC/DMPG (8:7 mole ratio) multibilayers [32]. In the larger Tat-(1–72)-protein NMR measurements at pH 4 have determined there is no secondary structure, with a dynamical basic region [33]. Similarly, NMR was used to study the full Tat protein and found a highly flexible basic region [34].
Regarding the mechanism of translocation of this randomly structured, short basic peptide, many models have been proposed based on the conflicting results listed above. Molecular dynamics simulations offer some insight into the molecular details of translocation. Herce and Garcia simulated the translocation of Tat (Y47GRKKRRQRRR57) across DOPC at various lipid:peptide molar ratios [35]. Their simulations indicated that Tat binds to the phosphate headgroups, with 1 Tat binding with 14 lipids, each positive charge on Tat associated with nearly 2 phosphate groups [35]. Translocation involved a localized thinning, and snorkeling of arginine side chains through the hydrophobic layer to interact with phosphates on the other side of the membrane. This allowed some water molecules to penetrate the membrane along with Tat, forming a pore [35]. In this simulation, performed without inclusion of counterions, pore formation was only observed at high ratios of peptide:lipid (1:18) or at elevated temperature. However, a subsequent Gromacs simulation with counterions found no thinning and no pore formation when Tat was added to DOPC membranes [36]. Instead it found a membrane invagination associated with a cluster of Tat peptides, suggesting that micropinocytosis could be the model for Tat translocation across membranes [36].
In this work we primarily combine experimental low-angle X-ray scattering (LAXS) data with MD simulations to obtain the structure of fully hydrated, oriented lipid bilayers with Tat (47–57) added at several mole ratios. The lipid systems were DOPC, DOPC/DOPE (3:1 mole ratio), DOPC/DOPS (3:1), DOPC/DOPE (1:1) and a mimic of the nuclear membrane (POPC/POPE/POPS/SoyPI/Chol, 69:15:2:4:11). Accessory techniques, densitometry, wide-angle X-ray scattering (WAXS), neutron scattering, CD spectroscopy were also applied to further characterize Tat/membrane interactions.
2. Materials and methods
2.1 Lipids and peptides
Synthesized lipids were purchased from Avanti Polar Lipids (Alabaster, AL) and used without further purification. Membrane mimics were prepared by first dissolving lyophilized lipids in chloroform and then mixing these stock solutions to create the lipid compositions DOPC, DOPC/DOPE (3:1), DOPC/DOPE (1:1), DOPC/DOPS (3:1) and nuclear membrane mimic (POPC/POPE/POPS/SoyPI/Cholesterol, 69:15:2:4:11) (based on Ref. [37]). Peptide (Y47GRKKRRQRRR57) was purchased in two separate lots from the Peptide Synthesis Facility (University of Pittsburgh, Pittsburgh, PA); mass spectroscopy revealed >95% purity. This Tat peptide corresponds to residues (47–57) of the 86 residues in the Tat protein [6]. Tat was dissolved in HPLC trifluoroethanol (TFE) and then mixed with lipid stock solutions in chloroform to form mole fractions between 0.0044 and 0.108. Weight of Tat in these mole fractions was corrected for protein content (the remainder being 8 trifluoroacetate counter-ions from the peptide synthesis). Solvents were removed by evaporation in the fume hood followed by 2 hours in a vacuum chamber at room temperature.
2.2 Samples for X-ray and neutron scattering
Four mg dried lipid/peptide mixture was re-dissolved in HPLC chloroform/TFE (2:1 v:v) for most of the lipid compositions. However, DOPC/DOPS (3:1) mixtures required chloroform/HFP (1:1 v:v) in order to solubilize the negatively charged DOPS. 200 μl of 4 mg mixtures in solvents were plated onto silicon wafers (15x30x1 mm) via the rock and roll method [38] to produce stacks of ~1800 well-aligned bilayers; solvents were removed by evaporation in the fume hood, followed by two hours under vacuum. 2H NMR revealed ~1% residual solvent after these procedures. Samples were prehydrated through the vapor in polypropylene hydration chambers at 37°C for 2–6 h directly before hydrating in the thick-walled X-ray hydration chamber [39] for 0.5–1 h. Pre-equilibration allowed sufficient time for equilibrium binding of peptides with membrane mimics.
2.3 Samples for densimetry
Multilamellar vesicles (MLVs) were prepared by mixing dried lipid mixtures with MilliQ water to a final concentration of 2–5 wt% in nalgene vials and cycling three times between −20°C and 60°C for ten minutes at each temperature with vortexing. Pure Tat was dissolved in water at 0.4 wt%.
2.4 Samples for circular dichroism (CD)
Thin films were prepared by spreading ~1 mg, x=0.11 (Peptide/(Lipid+Peptide)), in chloroform/TFE (1:1) onto one inside face of a quartz cuvette (Fisher Scientific, Pittsburgh, PA) and solvents were removed under vacuum. Our samples were purposely misoriented during spreading onto the cuvette side to minimize orientation effects on CD spectra [40, 41]. Hydration occurred through the vapor in sealed cuvettes at room temperature for 24 h. In addition, lyophilized Tat was also dissolved in 3 ml water (0.067 mg/ml) with no lipid.
2.5 X-ray scattering methods
LAXS
Low-angle X-ray scattering data from oriented fluid phase lipid mixtures at 37 °C were obtained at the Cornell High Energy Synchrotron Source (CHESS) using previously described methods [42, 43]. The analysis of diffuse LAXS from oriented stacks of fluctuating fluid bilayers has been previously described [39]. Absolute form factors |F(qz)| were obtained as previously described [42]. Modeling to estimate the locations of Tat and the lipid components was performed using the Scattering Density Profile (SDP) program [44].
WAXS
As described previously [45, 46], wide-angle X-ray scattering (WAXS) was obtained at a fixed angle of 0.5°, background collected at −0.5° was subtracted, and these data were analyzed to obtain the Sxray order parameter. Further details can be found in Supplementary data near Fig. S4.
2.6 Densimetry
Volumes of lipid mixtures with and without peptides in fully hydrated multilamellar vesicles (MLV) were determined at 37±0.01 °C using an Anton-Paar USA DMA5000M (Ashland, VA) vibrating tube densimeter [47].
2.7 CD spectroscopy
CD spectroscopy was carried out as described in Ref. [48]. Additional details and results can be found near Fig. S5.
2.8 Molecular dynamics simulations
Systems with different DOPC/Tat mole ratios (128:0, 128:2 and 128:4, corresponding to 0, 0.015 and 0.030 mole fractions) were simulated atomistically using the Gromacs 4.6.1 package [49]. DOPC was modeled by the Slipid force field [50, 51] and HIV Tat was modeled by Amber 99SB [52]. Tip3p water was used [53]. The number of Tats was divided equally on each side of the bilayer to mimic experimental conditions. All systems were simulated at 310 K with a constant area in the x-y plane for and 1 atm constant pressure in the Z direction. Each system was simulated for 100 ns and the last 50 ns was used as the production run. For each Tat molecule, 8 negative Chloride ions were added to the simulation.
At each DOPC/Tat mole ratio, we studied systems with three different area/lipid (AL). For the DOPC system, we fixed AL = 68, 70, 72 Å2; DOPC/Tat (128:2), we fixed the AL = 72, 74, 76 Å2; DOPC/Tat (128:4), we fixed the AL =72, 74, 76 Å. For each DOPC/Tat system at fixed AL, we then conducted seven independent simulations with the center of mass (COM) of each Tat constrained at different bilayer depths from the bilayer center (18, 16, 14, 12, 10, 8 and 5 Å). In total, 45 independent simulations were conducted. The goal of constrained simulations is to find the best match between experimental and MD simulation form factors. Comparison to the X-ray form factors was performed using the SIMtoEXP software [54]. Additional details concerning the MD simulation methods are in Supplementary Data Section 6.
2.9 Neutron scattering methods
Grazing angle of incidence neutron scattering data were obtained at the MAGIK beamline at the NIST Center for Neutron Research in Gaithersburg, Maryland using a hydration chamber designed by Drs. Tristram-Nagle and Frank Heinrich. The chamber is able to fully hydrate the horizontally-held oriented lipid bilayers, by heating a small well containing D2O or H2O, and by cooling the samples relative to the humid vapor using two Peltier coolers. More details concerning the sample chamber can be found at http://www.humidity.frank-heinrich.net/. Although the chamber can hold up to 10 silicon wafers, each containing ~2000 bilayers, most scans were collected with a 3 mm vertical slit on the samples, so that only three wafers contributed to the scattering. The data were collected both out-of-plane (qz) to observe the first order lamellar D-spacing, and in-plane (qr) using a Denex 2D detector.
3. Results
3.1 Low-angle X-ray scattering (LAXS)
Fig. 1 shows the scattering intensity pattern from DOPC/DOPE (1:1) with mole fraction x=0.034 Tat. The diffuse lobes are due to equilibrium fluctuations that occur in these fully hydrated, oriented lipid/peptide samples. The intensity I(q) in the diffuse patterns provide the absolute values of the form factors F(qz), which are the Fourier transforms of the electron density profile, through the relation I(q)=S(q)|F(qz)|2/qz, where q=(qr,qz), S(q) is the structure interference factor, and qz−1 is the usual LAXS approximation to the Lorentz factor [39, 55, 56]. The first step in the analysis takes advantage of the qr dependence of the scattering to obtain the bending modulus KC with results shown in Fig. 2. As positively charged Tat concentration was increased, the lamellar repeat spacing D generally increased in neutral lipid bilayers and decreased in negatively charged bilayers, consistent with changes in electrostatic repulsive interactions. With few exceptions, the water space between bilayers exceeded 20 Å.
Figure 1.

LAXS of DOPC/DOPE (1:1), x=0.034 Tat mole fraction (peptide/(lipid+peptide)) at 37 °C. White lobes of diffuse scattering intensity have large grey numbers, while lamellar orders and beam are shown to the left of the Molybdenum beam attenuator (short, dark rectangle). qz and qr are the projections of q along the direction normal and parallel to the membranes, respectively. The lamellar repeat spacing was D=66.2 Å.
Figure 2.

Bilayer bending modulus, KC, vs. P/(L+P) mole fraction. D-spacings for DOPC/Tat mixtures varied from 64 to 68 Å, for DOPC/DOPE/Tat mixtures from 64 to 69 Å, for DOPC/DOPS/Tat (3:1) mixtures from 57 Å to >100 Å (pure DOPS was unbound), and for nuclear mimic/Tat mixtures from unbound (nuclear mimic) to 64 Å. Estimated uncertainty in all values is ± 2.
The analysis that obtains KC also obtains the structure factor S(q) and then the unsigned form factors |F(qz)| are obtained from the intensity I(q) by division. Results for five different membrane mimics are shown in Fig. 3. Vertical lines indicate the “zero” position between the lobes of diffuse data where F(qz) change sign. In every sample, the zero positions shift to larger qz, indicating a thinning of the membranes.
Figure 3.

Form factors of lipid mixtures (arbitrarily scaled and vertically displaced) with increasing Tat mole fractions, P/(L+P), indicated on figure legends. Lipid mixtures: A. DOPC B. DOPC/DOPE (3:1) C. DOPC/DOPE (1:1) D. DOPC/DOPS (3:1) E. Nuclear mimic. The entire qz range is shown in C, while others show partial ranges. Solid vertical lines indicate the qz values where the form factors equal zero between the lobes of diffuse data.
3.2 MD simulations
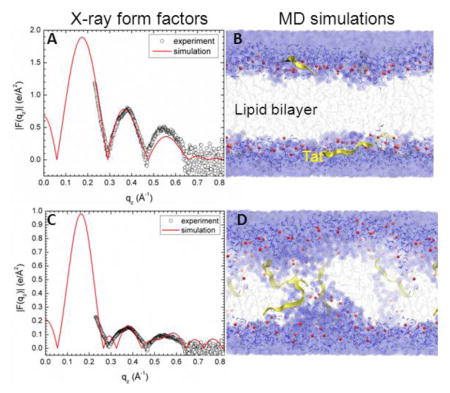
Due to the slow relaxation in lipid bilayers and limited accuracy of the force field, a good agreement between experimental and MD simulation calculated form factors may be difficult to reach. Consequently, we carried out several constrained simulations at AL and ZTat as described in Materials and Methods. We then compared the simulated form factor F(qz) with the experimental form factor. The best match for DOPC/Tat (128:4) was found when the Tats were constrained at 18 Å away from the bilayer center (Fig. 4A,B). The other best fit results were: DOPC AL = 70 Å2 and DOPC/Tat(128:2) AL = 72 Å2, ZTat = 18 Å. It clearly indicates that with increasing Tat concentration, AL increases. The agreement worsened as Tat was constrained to be closer to the center of the bilayer. When Tats were constrained at 5 Å away from the bilayer center, we observed a spontaneous formation of water pores in the MD simulation. However, as shown in Fig. 4.C the corresponding form factor calculated from MD simulations does not match well with the experimental form factor. Thus, by comparing the experimental and simulated form factors, Tat’s headgroup position is validated, while the hydrocarbon position is ruled out. A similar comparison of form factors from X-ray scattering and MD simulation previously allowed us to determine that the pore-forming alamethicin peptide locates in a transmembrane, not headgroup position [57].
Figure 4.

MD simulated form factors (red solid lines in A and C) of Tat/(DOPC+Tat), x=0.030, with Tat fixed at ZTat= 18 Å (panel A) and 5 Å (panel C) from the bilayer center compared to experimental form factors (open circles,) with data in C scaled vertically for ease of comparison with A. Corresponding snapshots are shown in Panels B and D in which the lipid chains are represented as grey sticks on a white background, Tats are yellow, phosphate groups are red and water is blue. Chi-square of the fit was 14.8 for A and 80.3 for C.
3.3 SDP Modeling
We also estimate structure by fitting the experimental form factors using the SDP method [44] with the component groups identified in Fig. 5. The positions of these groups were free parameters and the agreement with the experimental form factors was excellent. Absolute total electron density profiles and the Tat profiles are shown for many samples in Fig. 6(A–C). It must be emphasized, however, that, while the total EDP is well determined by this fitting procedure, the values of the parameters for the components are not as well determined as they would be if one had X-ray data to smaller and larger qz and neutron data. Indeed, there are local minima in the fitting landscape, including one with Tat closer to the center of the bilayer as shown in Fig. S5. The simulations help to discard that result. For the results shown in Fig. 6, a consistent trend is that Tat moves away from the bilayer center as concentration increases. Electron density profiles for DOPC/DOPS (3:1) and the nuclear membrane mimic were not successful, due to loss of diffuse scattering by Tat’s charge neutralization of these negatively charged membranes.
Figure 5.

Symmetrized total electron density profile (EDP) from the simulation with the form factor shown in Fig. 4A. Also shown are the component group contributions. Component groups are labeled: PC, phosphocholine; CG, carbonyl-glycerol; CH2+CH, methylene and methine hydrocarbon region; CH3, terminal methyl; Tat peptide distribution is shaded.
Figure 6.

SDP modeling results for absolute electron density profiles (EDPs) and for the Tat location as a function of distance Z along the bilayer normal. A. DOPC B. DOPC/DOPE (3:1) and C. DOPC/DOPE (1:1). Increasing mole fractions (P/(L+P)) are shown in the figure legends.
More structural detail from the modeling and from the simulations is shown in Fig. 7. The bilayer thickness can be described as DHH, which is the distance between the maxima in the electron density profile, or as DPP, which is the distance between the phosphocholines on the opposing monolayers (see Fig. 5). Figs. 7A and 7B show that both these quantities tend to decrease with increasing Tat mole fraction (P/(L+P)), showing that Tat thins membranes, increasingly so as its concentration is increased, even though both simulation and modeling suggest that Tat moves further from the membrane center with increasing concentration as shown in Fig. 7D. Fig. 7C shows that the area per lipid AL usually increases with increasing mole fraction of Tat, similar to the findings from MD simulations (Section 3.2), as would be expected. The results from the simulation data plotted in Fig. 7 were obtained by using a weighted average based on chi-square of the four best fits of the simulated form factors with the experimental form factors.
Figure 7.

A. Bilayer thickness, DPP; B. Bilayer thickness, DHH; C. Area/lipid, AL; D. Twice the Tat location, 2ZTat: all plotted vs. Tat mole fraction P/(L+P). Error bars are standard deviations from imposing Tat Gaussian widths, σ = 2.5, 3.0 or 3.5 A. Inverted blue triangles connected with dotted line are results from MD simulations, averaging the best fits to the X-ray data for each parameter, with standard deviations shown. Samples are listed in the legend in Fig. 7A.
3.4 Sxray order parameter from WAXS
Fig. 8 shows that the Sxray orientational order parameter generally decreases with increasing concentration of Tat for most of the membrane mimics studied. This indicates that the chains are more disordered as the Tat concentration in the membrane increases. These decreases in membrane chain order are compatible with the increase in softening of membranes by Tat observed by a decrease in KC in Fig. 2.
Figure 8.

Sxray, orientational order parameter, vs. x=P/(L+P) mole fraction. Error bars are standard deviations determined by analyzing WAXS data from several lateral positions on the same sample.
3.5 CD spectroscopy
Results of the secondary structure of Tat determined using CD spectroscopy are shown in Fig. S7 and details are given in the Supplementary data text. Basically, there was no effect of the DOPC/DOPE (3:1) membrane on the secondary structure of Tat (x=0.108) compared to Tat solubilized in water. The structure was primarily β and random coil, with <10% α-helix in both environments. The β structures include regular and distorted β-strands and β-turns. These results are summarized in Table 1.
Table 1.
CD results
| Sample | α-Helix | β-Structures | Random Coil |
|---|---|---|---|
| Tat in Water | 0.1 | 0.6 | 0.4 |
| Tat in Lipid Film | 0.1 | 0.6 | 0.4 |
3.6 Volume results
Experimental and simulated volumes are given in Table 2. The simulated volume was obtained using the volume app in the SIMtoEXP program. The experimental Tat volume was calculated from the measured density assuming that the lipid volume was the same as with no Tat. In general, there may be an interaction volume between the peptide and the lipid membrane as we found previously for bacteriorhodopsin [58]. As lipid was present in excess to Tat, the partial molecular volume of the lipid should be the same as with no Tat, so this way of calculating includes all the interaction volume in VTat. Comparison of VTat in water with the result for 5:1 Lipid:Tat suggests that the interaction volume may be negative, consistent with a net attractive interaction with lipid. Understandably, values of VTat were unreliable for small mole ratios of Tat:Lipid. Therefore we used simple additivity for those mimics not shown in Table 2 for the volumes used in the SDP program. All volumes obtained from the Gromacs MD simulations were somewhat smaller than the measured volumes, but it supports the Tat volume being closer to 1822 Å3 than the outlying values obtained experimentally at small Tat concentrations.
Table 2.
Volume results at 37 °C
| Tat in: | Vlipid (Å3) | Lipid:Tat | VTat (Å3) |
|---|---|---|---|
| Water | 1877 | ||
| DOPC/DOPE (3:1) | 1288 | 5:1 | 1822 |
| DOPC | 1314 | 39.6:1 | 676 |
| DOPC/DOPS (3:1) | 1298 | 39.6:1 | 2613 |
| Simulations | |||
| DOPC | 1283 | 128:2 | 1694 |
| DOPC | 1294 | 128:4 | 1699 |
3.7 Summary of Results
We summarize our results for how Tat affects the lipid bilayer in Fig. 9. The height of Tat, HTat = 8.7 Å, was the full width at half maximum of the Tat electron density profiles obtained from simulations and the cylindrical radius, RTat = 8.3 Å, was calculated to give the measured volume. The Z distances from the center of the bilayer were derived from weighted averages of four MD simulations of Tat:DOPC 2:128. The α2 obtained by comparison to experiment indicated that the best ZTat lay between the simulated values of 16 Å and 18 Å and the best area/lipid AL lay between the simulated values of 72 Å2 and 74 Å2, so averages were obtained from these four combinations of ZTat and AL, weighted inversely with their α2. The average positions, Z'Phos, of phosphates situated underneath the Tats were calculated by averaging over the phosphates whose in-plane distance, R, from the center of Tat is smaller than RTat. The simulation cell extended to 38Å, far enough to ensure that ZPhos for most of the lipids is the same as for DOPC. Assuming a simple linear ramp in ZPhos, Fig. 9 then indicates a ring of boundary lipids that extends twice as far in R as Tat itself. Although the guanidinium electron density profile was broad (Fig. S8), indicating that some were pointing away from the bilayer relative to the center of Tat, more were pointing towards the bilayer center as indicated in Fig. 9. Numerical values are given in Table S1.
Figure 9.
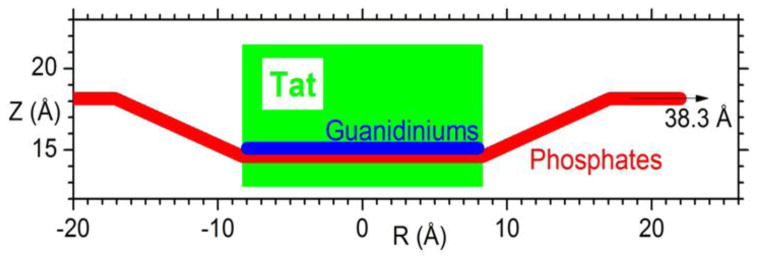
Location of Tat in DOPC bilayer. Tat is represented as a cylinder, Z is the distance from the bilayer center, and R is the in-plane distance from the center of Tat. The average Z of the lipid phosphates as a function of R and the arginine guanidiniums are shown in red and blue, respectively.
4. Discussion
Given that 8 of the 11 amino acids in Tat (47–57) are arginines and lysines, one would have suggested 20 years ago that highly charged Tat would partition strongly into solution rather than being associated with lipid bilayers. By contrast, but in agreement with more recent perspectives on arginine partitioning into the interfacial region [59], we find that Tat interacts with lipid bilayers, even with neutral DOPC and DOPC/DOPE mixtures, as well as with negatively charged DOPC/DOPS and nuclear membrane mimic lipid mixtures. This paper presents multiple lines of evidence for a Tat/membrane interaction. Fig. 2 shows that Tat decreases the bending modulus. Although one could argue that such a decrease is only apparent and could instead be due to local changes in membrane spontaneous curvature [60], either interpretation supports a Tat-bilayer interaction. The changes with increasing Tat concentration in the X-ray membrane form factors in Fig. 3 prove that Tat affects membrane structure, and the shift of the zero positions to higher qz suggests thinning. Thinning is substantiated by quantitative analysis of the X-ray data and by MD simulations. Fig. 7A shows that the average membrane thickness, as measured by the distance DPP between phosphocholines on opposite surfaces, decreases with increasing Tat concentration. Similar thinning is shown in Fig. 7B for the distance DHH between the maxima in the electron density profiles of opposite surfaces. Compared to DPP, DHH is pulled towards both the carbonyl/glycerol groups and Tat because both have electron densities (~0.4 e/Å3) greater than water (~0.33 e/Å3) or hydrocarbon (~0.3 e/Å3). Although the thinning shown in Figs. 7A and 7B is not large, it obviously requires interaction of Tat with the bilayers. Fig. 7C shows that AL increases with increasing Tat concentration, by both model fitting and MD simulations. In a recent experimental and simulation study of the decapeptide of arginine, a similar thinning of 10% and 12% was observed for neutral and negatively charged bilayers, respectively [61].
It is of considerable interest to learn where Tat resides, on average, in the membrane, as this would establish a base position from which translocation would be initiated. We have combined our two main methods, MD simulations and X-ray scattering, to address this question. In general, Tats locate at the bilayer/water interface as indicated in Section 3.2, and they are close to the phosphocholine headgroup region by comparing the simulated 2ZTat in Fig. 7D with 7A. Although the SDP modeling of the X-ray data obtains excellent fits to the experimental form factors for a model with Tat deep in the hydrocarbon interior (see Fig. S5), the corresponding MD simulation (shown in Fig. 4C) eliminates this spurious result. Fig. 7D also shows that modeling gives smaller values for ZTat than the simulation. The modeling result is supportive of the original simulation result of Herce and Garcia that Tat resides closer to the bilayer center than do the phosphocholine groups [62]. That is a base position that would be a possibly important precursor to translocation, as would the larger AL. In a recent multi-scale simulation, it was found that arginines bind deeply to the glycerol-carbonyl groups as well as to the phosphate, while lysines bind only to the level of the phosphates [63]. This is in good agreement with our results, shown in Fig. S8.
Several groups have carried out calculations and MD simulations showing that the cost of moving an arginine group from water to the bilayer center is ~12–26 kcal/mol [59, 64–66] or 6–7 kcal/mol if side-chain snorkeling to the surface is taken into account [67]. This is not inconsistent with our result that Tat interacts with the membrane because, as is well known, the bilayer is not just a hydrocarbon slab, but has interfacial headgroup regions where Tat can reside. It has been suggested that the free energy cost for charged amino acids entering the headgroup region is similar to that for partitioning into octanol, about an order of magnitude smaller free energy cost than partitioning into cyclohexane [68–70]. Simulations suggest that the free energy is smaller for an arginine residing in the interfacial region than in water, roughly by 3 kcal/mole, depending upon the lipid [59, 70]. Our results therefore appear energetically reasonable.
One concern with diffraction experiments on samples consisting of adjacent bilayers in a stack or in a multilamellar vesicle is that the samples have to be partially dried to obtain conventional diffraction data. But then there is no pure water layer between adjacent bilayers, so a hydrophilic peptide is forced into the interfacial, partially hydrophilic region of the lipid bilayer. In contrast, by using diffuse scattering, we obtained structure from experimental samples that had a range of lamellar D spacings (see Fig. 2 caption) that were considerably larger than the thickness of the bilayer in Fig. 7A, thereby providing an ample pure water space, typically greater than 20Å. The result that 2ZTat shown in Fig. 7D is so much smaller than our repeat spacings shows that Tat preferentially associates with the membrane rather than dissociating into water.
Consistent with Tat softening the bilayers (Fig. 2), it also disorders them as indicated by Sxray decreasing with Tat concentration shown in Fig. 8. Tat also increases the mosaic spread observed by X-ray and neutron scattering as shown in Figs. S1–3; this is a much larger scale disordering of the stack of bilayers. As shown in Table 1 and in Fig. S7, Tat assumed slightly >50% β structures, both when dissolved in water and in contact with a hydrated thin film membrane. Our results were determined using the DichroWEB program, which compares the mean residue ellipticity with that from standard globular proteins, with details given in Supplementary data near Fig. S7. These structures include approximately equal amounts of regular β strands and turns, with ~half that amount of distorted β strands. The next most prevalent structure was random coil (~37%). Measurements in the literature (see Section 1. Introduction) report a primarily random structure, determined using either CD or NMR. This difference could be due to different sample preparations, or due to a different interpretation of the CD spectra. Ref. [71] reported that CD spectra of unordered polypeptides are similar to that of the poly(Pro)II helix, and a significant fraction of the unordered conformation in globular proteins consists of poly(Pro)II helix plus distorted β strands.
In an effort to better determine the secondary structure of Tat, our collaborator, Dr. Rieko Ishima, performed 1D and 2D-NMR of Tat in solution at 10, 20 and 30°C . Her showed no evidence for backbone hydrogen bond formation, indicating that the peptide does not have a stable β conformation, at least on the time scale of the NMR measurement. Additionally, we analyzed the secondary structures of Tats from MD simulations using the Define Secondary Structure of Proteins (DSSP) program [72]. Data from the MD simulation which has the best fit to experimental X-ray form factors show that Tat contains neither β nor α-helix structures. Therefore, both our solution NMR and MD simulation results find primarily random coil, with no significant β structure, which contrasts with our CD findings of >50% β conformation. While the interpretation of CD spectra as β, P2 helix or coil is controversial, what is clear is that the membrane does not influence the conformation of solubilized Tat. In addition, no studies including our own, have implicated Tat forming an α-helix, either in solution or in the membrane.
Given our structural and elastic moduli results, we now compare to other experiments in the literature. In 2008, the Wong group implicated Tat’s ability to induce saddle-splay curvature with a potential role of bidentate hydrogen bonding as key [73]. Rhodamine-tagged Tat only entered GUVs when the PE headgroup was included with PS and PC lipids (PS/PC/PE, 20:40:40), indicating that hydrogen-bonding, and/or curvature-promoting lipids are required for Tat translocation. In PS/PE (20:80) lipids, they found Tat caused a highly curved cubic phase using X-ray diffraction [73]. In our experiments, there was little effect of adding DOPE to DOPC at either a 3:1 or 1:1 mole ratio on decrease in the bending modulus, bilayer thinning, Tat’s outward movement with increasing concentration or disordering of chains (Sxray). Our two results are not inconsistent, however, since curvature-promotion appears not to be required for Tat’s ability to lower the energy required to bend, nor to locate Tat in the bilayer, nor to disorder chains, all of which may be important for Tat translocation. Yet Tat does translocate across membranes in their experiments only with PE in the membrane, so the ability to induce saddle-splay curvature may also be required for Tat’s translocation. Another study by Melikov et al. [26] found that Tat’s main mechanism of action is to induce lipid mixing and membrane leakage with lipids of late endosomes. This result is consistent with our results that Tat induced a reversible, hydration-induced increase in mosaic spread (Figs. S1-3) and a disordering of chains (Fig. 8). Both of these could induce lipid mixing and perhaps, membrane leakage. An X-ray, neutron and AFM study reported thickening upon initial Tat binding, in contradiction to our result in Fig. 7B that shows thinning [74]. We suggest that this difference was caused by their using stiff gel phase DPPC lipid that did not allow bound Tat to perturb the bilayer. Using a variety of techniques, including high sensitivity isothermal titration calorimetry and 2H- and 31P-NMR, Seelig et al. [75] presented evidence that the lipid bilayer remains intact upon Tat binding and our results confirm this. Finally, we compare our structural results to those obtained by solid state NMR, although at a lower hydration level than in our sample. Hong et al. [32] found that Tat lies parallel to the bilayer surface in the headgroup region of DMPC/DMPG (8:7) bilayers, similar to our cartoon in Fig. 9.
Although a recent MD simulation using umbrella sampling [76] found that the free energy required for cR9 to traverse a membrane was smaller if a water pore was present, we cannot directly test the existence of a transient water pore from our X-ray or neutron scattering experiments. This is because, even with a water pore, the translocation process still requires crossing a free energy barrier which is a non-equilibrium process. X-ray form factors measure an equilibrium state. If the form factors obtained from water pore structures agreed well with experiments, it would indicate that the pore structure was thermodynamically stable. This may be the case for some antimicrobial peptides, but certainly not for cell-penetrating peptides.
Finding a kinetically competent pathway for the interesting phenomenon of translocation of highly charged Tat through hydrophobic membranes is difficult. An energetically passive translocation likely occurs very seldom on an MD simulation time scale, and it probably happens quickly, so it would not significantly change the average structure of the membrane in which it occurs. Although our results in this paper do not reveal a kinetically competent pathway, they do show that Tat is drawn to the surface of the membrane, and is therefore ready for translocation at a region of local thinning. And they show that these interactions tend to soften (Fig. 2) and disorder (Fig. 8) the membrane and increase the AL, thereby likely reducing the energy barrier for passive translocation.
5. Conclusions
In this work we have used X-ray scattering to show that Tat thins membranes: 1–2 Å globally for three neutral membrane mimics (DOPC, DOPC:DOPE (3:1) and DOPC:DOPE (1:1). In addition, the X-ray form factors from DOPC:DOPS (3:1) and nuclear membrane mimics suggest a similar global thinning. MD simulations showed that Tat causes a 3 Å local thinning in DOPC membranes, with the lipid phosphate groups closer to the bilayer center than most of the guanidinium groups. By comparing the form factors generated from X-ray experiment and MD simulations, we can rule out a pore with Tat and water spanning the membrane. Our X-ray results also provide material constants; Tat caused softening and chain disordering. CD spectroscopy revealed either a β- or random coil structure that did not change upon membrane binding. Therefore, the mechanism of Tat translocation must involve a lipid perturbation and local membrane thinning. From its headgroup position, Tat must translocate quickly across the membrane, without the formation of a permanent water pore.
Supplementary Material
Highlights.
Tat causes ~1–2 Å average thinning of three membrane mimics
Local thinning near Tat is ~3 Å determined by MD simulations of DOPC/Tat
Tat increases area/lipid by ~3–5 Å2 and softens membranes
Tat decreases chain order and increases mosaic spread
A permanent water-filled pore formed by Tat is not supported by this study
Acknowledgments
Research reported in this publication was supported by the National Institute of General Medical Sciences of the National Institutes of Health under award GM44976 (PIs JFN, STN). and GM86801 (PI AG). The content is solely the responsibility of the authors and does not necessarily represent the official views of the National Institutes of Health. We acknowledge the Cornell High Energy Synchrotron Source (CHESS) which is supported by the National Science Foundation and the NIH/NIGMS under NSF award DMR-0936384. We acknowledge the Center for Molecular Analysis at Carnegie Mellon University for use of the Jasco 715 and for mass spectrometry analysis and the Protein Synthesis Core of the University of Pittsburgh for peptide production. The MD simulations in this work used the Extreme Science and Engineering Discovery Environment (XSEDE # MCB130178), which is supported by NSF # ACI-1053575. The authors also acknowledge Dr. Rieko Ishima for carrying out NMR measurements, Leah Langer for help using Matlab with the neutron scattering data and Laura Carroll for carrying out CD measurements. We would also like to acknowledge Dr. Jeffery Krzywon at NIST for technical help with our hydration chamber.
Abbreviations
- DOPC
dioleoylphosphocholine
- DOPE
dioleoylphosphoethanolamine
- DOPS
dioleoylphosphoserine
- POPC
palmitoyloleoylphosphocholine
- POPE
palmitoyloleoylphosphoethanolamine
- POPS
palmitoyloleoylphosphoserine
- Soy PI
Soy phosphoinositol
- SM
sphingomyelin
- Chol
cholesterol
- BMP
bis(monoacylglycerol)-phosphate)
- PG
phosphoglycerol
- CPP
cell-penetrating peptide
- GUVs
giant unilamellar vesicles
- LUVs
large unilamellar vesicles
- LAXS
low-angle X-ray scattering
- WAXS
wide-angle X-ray scattering
- HFP
hexafluoroisopropanol
- TFE
trifluoroethanol
- SDP
Scattering Density Profile
- DSSP
modeling program Define Secondary Structure of Proteins
- P
peptide
- L
lipid
Footnotes
Publisher's Disclaimer: This is a PDF file of an unedited manuscript that has been accepted for publication. As a service to our customers we are providing this early version of the manuscript. The manuscript will undergo copyediting, typesetting, and review of the resulting proof before it is published in its final citable form. Please note that during the production process errors may be discovered which could affect the content, and all legal disclaimers that apply to the journal pertain.
References
- 1.Fischer R, Fotin-Mleczek M, Hufnagel H, Brock R. Break on through to the other side-biophysics and cell biology shed light on cell-penetrating peptides. Chembiochem. 2005;6:2126–2142. doi: 10.1002/cbic.200500044. [DOI] [PubMed] [Google Scholar]
- 2.Joliot A, Prochiantz A. Transduction peptides: from technology to physiology. Nat Cell Biol. 2004;6:189–196. doi: 10.1038/ncb0304-189. [DOI] [PubMed] [Google Scholar]
- 3.Lindgren M, Hallbrink M, Prochiantz A, Langel U. Cell-penetrating peptides. Trends Pharmacol Sci. 2000;21:99–103. doi: 10.1016/s0165-6147(00)01447-4. [DOI] [PubMed] [Google Scholar]
- 4.Frankel AD, Pabo CO. Cellular uptake of the tat protein from human immunodeficiency virus. Cell. 1988;55:1189–1193. doi: 10.1016/0092-8674(88)90263-2. [DOI] [PubMed] [Google Scholar]
- 5.Green M, Loewenstein PM. Autonomous functional domains of chemically synthesized human immunodeficiency virus tat trans-activator protein. Cell. 1988;55:1179–1188. doi: 10.1016/0092-8674(88)90262-0. [DOI] [PubMed] [Google Scholar]
- 6.Vives E, Brodin P, Lebleu B. A truncated HIV-1 Tat protein basic domain rapidly translocates through the plasma membrane and accumulates in the cell nucleus. J Biol Chem. 1997;272:16010–16017. doi: 10.1074/jbc.272.25.16010. [DOI] [PubMed] [Google Scholar]
- 7.Ter-Avetisyan G, Tunnemann G, Nowak D, Nitschke M, Herrmann A, Drab M, Cardoso MC. Cell entry of arginine-rich peptides is independent of endocytosis. J Biol Chem. 2009;284:3370–3378. doi: 10.1074/jbc.M805550200. [DOI] [PMC free article] [PubMed] [Google Scholar]
- 8.Duchardt F, Fotin-Mleczek M, Schwarz H, Fischer R, Brock R. A comprehensive model for the cellular uptake of cationic cell-penetrating peptides. Traffic. 2007;8:848–866. doi: 10.1111/j.1600-0854.2007.00572.x. [DOI] [PubMed] [Google Scholar]
- 9.Tunnemann G, Martin RM, Haupt S, Patsch C, Edenhofer F, Cardoso MC. Cargo-dependent mode of uptake and bioavailability of TAT-containing proteins and peptides in living cells. Faseb J. 2006;20:1775–1784. doi: 10.1096/fj.05-5523com. [DOI] [PubMed] [Google Scholar]
- 10.Ziegler A, Nervi P, Durrenberger M, Seelig J. The cationic cell-penetrating peptide Cpp(TAT) derived from the HIV-1 protein TAT is rapidly transported into living fibroblasts: Optical, biophysical, and metabolic evidence. Biochemistry. 2005;44:138–148. doi: 10.1021/bi0491604. [DOI] [PubMed] [Google Scholar]
- 11.Wadia JS, Stan RV, Dowdy SF. Transducible TAT-HA fusogenic peptide enhances escape of TAT-fusion proteins after lipid raft macropinocytosis. Nat Med. 2004;10:310–315. doi: 10.1038/nm996. [DOI] [PubMed] [Google Scholar]
- 12.Kaplan IM, Wadia JS, Dowdy SF. Cationic TAT peptide transduction domain enters cells by macropinocytosis. J Control Release. 2005;102:247–253. doi: 10.1016/j.jconrel.2004.10.018. [DOI] [PubMed] [Google Scholar]
- 13.Mann DA, Frankel AD. Endocytosis and targeting of exogenous HIV-1 Tat protein. Embo J. 1991;10:1733–1739. doi: 10.1002/j.1460-2075.1991.tb07697.x. [DOI] [PMC free article] [PubMed] [Google Scholar]
- 14.Richard JP, Melikov K, Brooks H, Prevot P, Lebleu B, Chernomordik LV. Cellular uptake of unconjugated TAT peptide involves clathrin-dependent endocytosis and heparan sulfate receptors. J Biol Chem. 2005;280:15300–15306. doi: 10.1074/jbc.M401604200. [DOI] [PubMed] [Google Scholar]
- 15.Jones SW, Christison R, Bundell K, Voyce CJ, Brockbank SM, Newham P, Lindsay MA. Characterisation of cell-penetrating peptide-mediated peptide delivery. Br J Pharmacol. 2005;145:1093–1102. doi: 10.1038/sj.bjp.0706279. [DOI] [PMC free article] [PubMed] [Google Scholar]
- 16.Vendeville A, Rayne F, Bonhoure A, Bettache N, Montcourrier P, Beaumelle B. HIV-1 Tat enters T cells using coated pits before translocating from acidified endosomes and eliciting biological responses. Mol Biol Cell. 2004;15:2347–2360. doi: 10.1091/mbc.E03-12-0921. [DOI] [PMC free article] [PubMed] [Google Scholar]
- 17.Foerg C, Ziegler U, Fernandez-Carneado J, Giralt E, Rennert R, Beck-Sickinger AG, Merkle HP. Decoding the entry of two novel cell-penetrating peptides in HeLa cells: lipid raft-mediated endocytosis and endosomal escape. Biochemistry-Us. 2005;44:72–81. doi: 10.1021/bi048330+. [DOI] [PubMed] [Google Scholar]
- 18.Fittipaldi A, Giacca M. Transcellular protein transduction using the Tat protein of HIV-1. Adv Drug Deliv Rev. 2005;57:597–608. doi: 10.1016/j.addr.2004.10.011. [DOI] [PubMed] [Google Scholar]
- 19.Liu Y, Jones M, Hingtgen CM, Bu GJ, Laribee N, Tanzi RE, Moir RD, Nath A, He JJ. Uptake of HIV-1 Tat protein mediated by low-density lipoprotein receptor-related protein disrupts the neuronal metabolic balance of the receptor ligands. Nature Medicine. 2000;6:1380–1387. doi: 10.1038/82199. [DOI] [PubMed] [Google Scholar]
- 20.Torchilin VP, Rammohan R, Weissig V, Levchenko TS. TAT peptide on the surface of liposomes affords their efficient intracellular delivery even at low temperature and in the presence of metabolic inhibitors. Proc Natl Acad Sci U S A. 2001;98:8786–8791. doi: 10.1073/pnas.151247498. [DOI] [PMC free article] [PubMed] [Google Scholar]
- 21.Torchilin VP, Levchenko TS, Rammohan R, Volodina N, Papahadjopoulos-Sternberg B, D'Souza GG. Cell transfection in vitro and in vivo with nontoxic TAT peptide-liposome-DNA complexes. Proc Natl Acad Sci U S A. 2003;100:1972–1977. doi: 10.1073/pnas.0435906100. [DOI] [PMC free article] [PubMed] [Google Scholar]
- 22.Rudolph C, Plank C, Lausier J, Schillinger U, Muller RH, Rosenecker J. Oligomers of the arginine-rich motif of the HIV-1 TAT protein are capable of transferring plasmid DNA into cells. J Biol Chem. 2003;278:11411–11418. doi: 10.1074/jbc.M211891200. [DOI] [PubMed] [Google Scholar]
- 23.Chauhan A, Tikoo A, Kapur AK, Singh M. The taming of the cell penetrating domain of the HIV Tat: myths and realities. J Control Release. 2007;117:148–162. doi: 10.1016/j.jconrel.2006.10.031. [DOI] [PMC free article] [PubMed] [Google Scholar]
- 24.Sabatier JM, Vives E, Mabrouk K, Benjouad A, Rochat H, Duval A, Hue B, Bahraoui E. Evidence for neurotoxic activity of tat from human immunodeficiency virus type 1. J Virol. 1991;65:961–967. doi: 10.1128/jvi.65.2.961-967.1991. [DOI] [PMC free article] [PubMed] [Google Scholar]
- 25.Mishra A, Gordon VD, Yang L, Coridan R, Wong GC. HIV TAT forms pores in membranes by inducing saddle-splay curvature: potential role of bidentate hydrogen bonding. Angew Chem Int Ed Engl. 2008;47:2986–2989. doi: 10.1002/anie.200704444. [DOI] [PubMed] [Google Scholar]
- 26.Yang ST, Zaitseva E, Chernomordik LV, Melikov K. Cell-penetrating peptide induces leaky fusion of liposomes containing late endosome-specific anionic lipid. Biophysical Journal. 2010;99:2525–2533. doi: 10.1016/j.bpj.2010.08.029. [DOI] [PMC free article] [PubMed] [Google Scholar]
- 27.Thoren PEG, Persson D, Esbjorner EK, Goksor M, Lincoln P, Norden B. Membrane binding and translocation of cell-penetrating peptides. Biochemistry. 2004;43:3471–3489. doi: 10.1021/bi0360049. [DOI] [PubMed] [Google Scholar]
- 28.Kramer SD, Wunderli-Allenspach H. No entry for TAT(44–57) into liposomes and intact MDCK cells: novel approach to study membrane permeation of cell-penetrating peptides. Biochimica Et Biophysica Acta-Biomembranes. 2003;1609:161–169. doi: 10.1016/s0005-2736(02)00683-1. [DOI] [PubMed] [Google Scholar]
- 29.Ciobanasu C, Siebrasse JP, Kubitscheck U. Cell-penetrating HIV1 TAT peptides can generate pores in model membranes. Biophysical Journal. 2010;99:153–162. doi: 10.1016/j.bpj.2010.03.065. [DOI] [PMC free article] [PubMed] [Google Scholar]
- 30.Gurnev PA, Yang ST, Melikov KC, Chernomordik LV, Bezrukov SM. Cationic cell-penetrating peptide binds to planar lipid bilayers containing negatively charged lipids but does not induce conductive pores. Biophys J. 2013;104:1933–1939. doi: 10.1016/j.bpj.2013.02.053. [DOI] [PMC free article] [PubMed] [Google Scholar]
- 31.Herce HD, Garcia AE, Litt J, Kane RS, Martin P, Enrique N, Rebolledo A, Milesi V. Arginine-Rich Peptides Destabilize the Plasma Membrane, Consistent with a Pore Formation Translocation Mechanism of Cell-Penetrating Peptides. Biophysical Journal. 2009;97:1917–1925. doi: 10.1016/j.bpj.2009.05.066. [DOI] [PMC free article] [PubMed] [Google Scholar]
- 32.Su YC, Waring AJ, Ruchala P, Hong M. Membrane-bound dynamic structure of an arginine-rich cell-penetrating peptide, the protein transduction domain of HIV Tat, from solid-state NMR. Biochemistry. 2010;49:6009–6020. doi: 10.1021/bi100642n. [DOI] [PMC free article] [PubMed] [Google Scholar]
- 33.Shojania S, O'Neil JD. HIV-1 Tat is a natively unfolded protein - The solution conformation and dynamics of reduced HIV-1 Tat-(1–72) by NMR spectroscopy. J Biol Chem. 2006;281:8347–8356. doi: 10.1074/jbc.M510748200. [DOI] [PubMed] [Google Scholar]
- 34.Bayer P, Kraft M, Ejchart A, Westendorp M, Frank R, Rosch P. Structural studies of Hiv-1 tat protein. J Mol Biol. 1995;247:529–535. doi: 10.1006/jmbi.1995.0158. [DOI] [PubMed] [Google Scholar]
- 35.Herce HD, Garcia AE. Molecular dynamics simulations suggest a mechanism for translocation of the HIV-1 TAT peptide across lipid membranes. Proc Natl Acad Sci U S A. 2007;104:20805–20810. doi: 10.1073/pnas.0706574105. [DOI] [PMC free article] [PubMed] [Google Scholar]
- 36.Yesylevskyy S, Marrink SJ, Mark AE. Alternative mechanisms for the interaction of the cell-penetrating peptides penetratin and the TAT peptide with lipid bilayers. Biophysical Journal. 2009;97:40–49. doi: 10.1016/j.bpj.2009.03.059. [DOI] [PMC free article] [PubMed] [Google Scholar]
- 37.Jarasch ED, Reilly CE, Comes P, Kartenbeck J, Franke WW. Isolation and characterization of nuclear membranes from calf and rat thymus. Hoppe Seylers Z Physiol Chem. 1973;354:974–986. doi: 10.1515/bchm2.1973.354.2.974. [DOI] [PubMed] [Google Scholar]
- 38.Tristram-Nagle SA. Preparation of oriented, fully hydrated lipid samples for structure determination using X-ray scattering. Methods Mol Biol. 2007;400:63–75. doi: 10.1007/978-1-59745-519-0_5. [DOI] [PMC free article] [PubMed] [Google Scholar]
- 39.Kčerka N, Liu YF, Chu NJ, Petrache HI, Tristram-Nagle S, Nagle JF. Structure of fully hydrated fluid phase DMPC and DLPC lipid bilayers using X-ray scattering from oriented multilamellar arrays and from unilamellar vesicles. Biophysical Journal. 2005;88:2626–2637. doi: 10.1529/biophysj.104.056606. [DOI] [PMC free article] [PubMed] [Google Scholar]
- 40.He K, Ludtke SJ, Heller WT, Huang HW. Mechanism of alamethicin insertion into lipid bilayers. Biophysical Journal. 1996;71:2669–2679. doi: 10.1016/S0006-3495(96)79458-4. [DOI] [PMC free article] [PubMed] [Google Scholar]
- 41.Schick S, Chen LR, Li E, Lin J, Koper I, Hristova K. Assembly of the M2 tetramer Is strongly modulated by lipid chain length. Biophysical Journal. 2010;99:1810–1817. doi: 10.1016/j.bpj.2010.07.026. [DOI] [PMC free article] [PubMed] [Google Scholar]
- 42.Liu YF, Nagle JF. Diffuse scattering provides material parameters and electron density profiles of biomembranes. Phys Rev E. 2004;69:040901–040904. doi: 10.1103/PhysRevE.69.040901. (R) [DOI] [PMC free article] [PubMed] [Google Scholar]
- 43.Lyatskaya Y, Liu YF, Tristram-Nagle S, Katsaras J, Nagle JF. Method for obtaining structure and interactions from oriented lipid bilayers. Phys Rev E. 2001;63:0119071–0119079. doi: 10.1103/PhysRevE.63.011907. [DOI] [PMC free article] [PubMed] [Google Scholar]
- 44.Kčerka N, Nagle JF, Sachs JN, Feller SE, Pencer J, Jackson A, Katsaras J. Lipid bilayer structure determined by the simultaneous analysis of neutron and x-ray scattering data. Biophys J. 2008;95:2356–2367. doi: 10.1529/biophysj.108.132662. [DOI] [PMC free article] [PubMed] [Google Scholar]
- 45.Mills TT, Toombes GES, Tristram-Nagle S, Smilgies DM, Feigenson GW, Nagle JF. Order parameters and areas in fluid-phase oriented lipid membranes using wide angle x-ray scattering. Biophysical Journal. 2008;95:669–681. doi: 10.1529/biophysj.107.127845. [DOI] [PMC free article] [PubMed] [Google Scholar]
- 46.Mills TT, Tristram-Nagle S, Heberle FA, Morales NF, Zhao J, Wu J, Toombes GES, Nagle JF, Feigenson GW. Liquid-liquid domains in bilayers detected by wide angle x-ray scattering. Biophysical Journal. 2008;95:682–690. doi: 10.1529/biophysj.107.127910. [DOI] [PMC free article] [PubMed] [Google Scholar]
- 47.Raghunathan M, Zubovski Y, Venable RM, Pastor RW, Nagle JF, Tristram-Nagle S. Structure and Elasticity of Lipid Membranes with Genistein and Daidzein Bioflavinoids Using X-ray Scattering and MD Simulations. Journal of Physical Chemistry B. 2012;116:3918–3927. doi: 10.1021/jp211904j. [DOI] [PMC free article] [PubMed] [Google Scholar]
- 48.Boscia AL, Akabori K, Benamram Z, Michel JA, Jablin MS, Steckbeck JD, Montelaro RC, Nagle JF, Tristram-Nagle S. Membrane structure correlates to function of LLP2 on the cytoplasmic tail of HIV-1 gp41 protein. Biophysical Journal. 2013;105:657–666. doi: 10.1016/j.bpj.2013.06.042. [DOI] [PMC free article] [PubMed] [Google Scholar]
- 49.Hess B, Kutzner C, van der Spoel D, Lindahl E. GROMACS 4: Algorithms for highly efficient, load-balanced, and scalable molecular simulation. J Chem Theory Comput. 2008;4:435–447. doi: 10.1021/ct700301q. [DOI] [PubMed] [Google Scholar]
- 50.Jambeck JP, Lyubartsev AP. Derivation and systematic validation of a refined all-atom force field for phosphatidylcholine lipids. The journal of physical chemistry B. 2012;116:3164–3179. doi: 10.1021/jp212503e. [DOI] [PMC free article] [PubMed] [Google Scholar]
- 51.Jambeck JPM, Lyubartsev AP. An extension and further validation of an all-atomistic force field for biological membranes. J Chem Theory Comput. 2012;8:2938–2948. doi: 10.1021/ct300342n. [DOI] [PubMed] [Google Scholar]
- 52.Hornak V, Abel R, Okur A, Strockbine B, Roitberg A, Simmerling C. Comparison of multiple amber force fields and development of improved protein backbone parameters. Proteins. 2006;65:712–725. doi: 10.1002/prot.21123. [DOI] [PMC free article] [PubMed] [Google Scholar]
- 53.Jorgensen WL, Chandrasekhar J, Madura JD, Impey RW, Klein ML. Comparison of simple potential functions for simulating liquid water. J Chem Phys. 1983;79:926–935. [Google Scholar]
- 54.Kčerka N, Katsaras J, Nagle JF. Comparing membrane simulations to scattering experiments: introducing the SIMtoEXP software. The Journal of membrane biology. 2010;235:43–50. doi: 10.1007/s00232-010-9254-5. [DOI] [PMC free article] [PubMed] [Google Scholar]
- 55.Kčerka N, Tristram-Nagle S, Nagle JF. Closer look at structure of fully hydrated fluid phase DPPC bilayers. Biophysical Journal. 2006;90:L83–L85. doi: 10.1529/biophysj.106.086017. [DOI] [PMC free article] [PubMed] [Google Scholar]
- 56.Kčerka N, Tristram-Nagle S, Nagle JF. Structure of fully hydrated fluid phase lipid bilayers with monounsaturated chains. J Membrane Biol. 2005;208:193–202. doi: 10.1007/s00232-005-7006-8. [DOI] [PubMed] [Google Scholar]
- 57.Pan J, Tieleman DP, Nagle JF, Kucerka N, Tristram-Nagle S. Alamethicin in lipid bilayers: combined use of X-ray scattering and MD simulations. Biochim Biophys Acta. 2009;1788:1387–1397. doi: 10.1016/j.bbamem.2009.02.013. [DOI] [PMC free article] [PubMed] [Google Scholar]
- 58.Tristram-Nagle S, Yang CP, Nagle JF. Thermodynamic studies of purple membrane. Biochim Biophys Acta. 1986;854:58–66. doi: 10.1016/0005-2736(86)90064-7. [DOI] [PubMed] [Google Scholar]
- 59.Johansson ACV, Lindahl E. The role of lipid composition for insertion and stabilization of amino acids in membranes. J Chem Phys. 2009:130. doi: 10.1063/1.3129863. [DOI] [PubMed] [Google Scholar]
- 60.Tristram-Nagle S, Nagle JF. HIV-1 fusion peptide decreases bending energy and promotes curved fusion intermediates. Biophysical Journal. 2007;93:2048–2055. doi: 10.1529/biophysj.107.109181. [DOI] [PMC free article] [PubMed] [Google Scholar]
- 61.Vazdar M, Wernersson E, Khabiri M, Cwiklik L, Jurkiewicz P, Hof M, Mann E, Kolusheva S, Jelinek R, Jungwirth P. Aggregation of oligoarginines at phospholipid membranes: molecular dynamics simulations, time-dependent fluorescence shift, and biomimetic colorimetric assays. The journal of physical chemistry B. 2013;117:11530–11540. doi: 10.1021/jp405451e. [DOI] [PubMed] [Google Scholar]
- 62.Herce HD, Garcia AE. Molecular dynamics simulations suggest a mechanism for translocation of the HIV-1 TAT peptide across lipid membranes. P Natl Acad Sci USA. 2007;104:20805–20810. doi: 10.1073/pnas.0706574105. [DOI] [PMC free article] [PubMed] [Google Scholar]
- 63.Wu Z, Cui Q, Yethiraj A. Why do arginine and lysine organize lipids differently? Insights from coarse-grained and atomistic simulations. Journal of Physical Chemistry B. 2013;117:12145–12156. doi: 10.1021/jp4068729. [DOI] [PubMed] [Google Scholar]
- 64.Li LB, Vorobyov I, Allen TW. Potential of mean force and pK(a) profile calculation for a lipid membrane-exposed arginine side chain. Journal of Physical Chemistry B. 2008;112:9574–9587. doi: 10.1021/jp7114912. [DOI] [PubMed] [Google Scholar]
- 65.Vorobyov I, Li LB, Allen TW. Assessing atomistic and coarse-grained force fields for protein-lipid interactions: The formidable challenge of an ionizable side chain in a membrane. Journal of Physical Chemistry B. 2008;112:9588–9602. doi: 10.1021/jp711492h. [DOI] [PubMed] [Google Scholar]
- 66.MacCallum JL, Bennett WFD, Tieleman DP. Distribution of amino acids in a lipid bilayer from computer simulations. Biophysical Journal. 2008;94:3393–3404. doi: 10.1529/biophysj.107.112805. [DOI] [PMC free article] [PubMed] [Google Scholar]
- 67.Schow EV, Freites JA, Cheng P, Bernsel A, von Heijne G, White SH, Tobias DJ. Arginine in membranes: The connection between molecular dynamics simulations and translocon-mediated insertion experiments. J Membrane Biol. 2011;239:35–48. doi: 10.1007/s00232-010-9330-x. [DOI] [PMC free article] [PubMed] [Google Scholar]
- 68.Wimley WC, Creamer TP, White SH. Solvation energies of amino acid side chains and backbone in a family of host-guest pentapeptides. Biochemistry. 1996;35:5109–5124. doi: 10.1021/bi9600153. [DOI] [PubMed] [Google Scholar]
- 69.Wimley WC, White SH. Experimentally determined hydrophobicity scale for proteins at membrane interfaces. Nat Struct Biol. 1996;3:842–848. doi: 10.1038/nsb1096-842. [DOI] [PubMed] [Google Scholar]
- 70.Roux B. Lonely arginine seeks friendly environment. J Gen Physiol. 2007;130:233–236. doi: 10.1085/jgp.200709819. [DOI] [PMC free article] [PubMed] [Google Scholar]
- 71.Sreerama N, Woody RW. Structural composition of beta(I)- and beta(II)-proteins. Protein Sci. 2003;12:384–388. doi: 10.1110/ps.0235003. [DOI] [PMC free article] [PubMed] [Google Scholar]
- 72.Kabsch W, Sander C. Dictionary of protein secondary structure: pattern recognition of hydrogen-bonded and geometrical features. Biopolymers. 1983;22:2577–2637. doi: 10.1002/bip.360221211. [DOI] [PubMed] [Google Scholar]
- 73.Mishra A, Gordon VD, Yang LH, Coridan R, Wong GCL. HIV TAT forms pores in membranes by inducing saddle-splay curvature: Potential role of bidentate hydrogen bonding. Angew Chem Int Edit. 2008;47:2986–2989. doi: 10.1002/anie.200704444. [DOI] [PubMed] [Google Scholar]
- 74.Choi D, Moon JH, Kim H, Sung BJ, Kim MW, Tae GY, Satija SK, Akgun B, Yu CJ, Lee HW, Lee DR, Henderson JM, Kwong JW, Lam KL, Lee KYC, Shin K. Insertion mechanism of cell-penetrating peptides into supported phospholipid membranes revealed by X-ray and neutron reflection. Soft Matter. 2012;8:8294–8297. [Google Scholar]
- 75.Ziegler A, Blatter XL, Seelig A, Seelig J. Protein transduction domains of HIV-1 and SIV TAT interact with charged lipid vesicles. Binding mechanism and thermodynamic analysis. Biochemistry. 2003;42:9185–9194. doi: 10.1021/bi0346805. [DOI] [PubMed] [Google Scholar]
- 76.Huang K, Garcia AE. Free Energy of Translocating an Arginine-Rich Cell-Penetrating Peptide across a Lipid Bilayer Suggests Pore Formation. Biophysical Journal. 2013;104:412–420. doi: 10.1016/j.bpj.2012.10.027. [DOI] [PMC free article] [PubMed] [Google Scholar]
Associated Data
This section collects any data citations, data availability statements, or supplementary materials included in this article.