

Abstract
Purpose
Pediatric rhabdomyosarcoma has two common histological subtypes: embryonal (ERMS) and alveolar (ARMS). PAX/FOXO1 fusion gene status is a more reliable prognostic marker than alveolar histology while fusion gene-negative (FN) ARMS patients are clinically similar to ERMS patients. A five-gene expression signature (MG5) previously identified two diverse risk groups within the fusion-gene negative RMS (FN-RMS) patients but this has not been independently validated. The goal of the current study was to test whether expression of the MG5 metagene, measured using a technical platform that can be applied to routine pathology material, would correlate with outcome in a new cohort of patients with FN-RMS.
Experimental Design
Cases were taken from the Children's Oncology Group (COG) D9803 study of children with intermediate-risk RMS and gene expression profiling for the MG5 genes was performed using the nCounter assay. The MG5 score was correlated with clinical and pathological characteristics as well as overall and event-free survival.
Results
MG5 standardized score showed no significant association with any of the available clinical-pathological variables. The MG5 signature score showed a significant correlation with overall (N=57; HR 7.3 95%CI[1.9-27.0], p=0.003) and failure-free survival (N=57; HR 6.1 95%CI[1.9-19.7], p=0.002).
Conclusions
This represents the first, validated molecular prognostic signature for children with FN-RMS who otherwise have intermediate-risk disease. The capacity to measure the expression of a small number of genes in routine pathology material and apply a simple mathematical formula to calculate the MG5 metagene score provides a clear path toward better risk-stratification in future, prospective clinical trial.
Keywords: Rhabdomyosarcoma, fusion negative, MG5, metagene, intermediate-risk
Introduction
Rhabdomyosarcoma (RMS) is the most common soft tissue sarcoma in children and adolescents. Traditional risk stratification of RMS patients is based on a complex algorithm of clinical “group” and “stage”, which is determined by histology (embryonal vs. alveolar), primary tumor site (favorable vs. unfavorable), size, presence or absence of nodal or distant metastases, and degree of primary tumor resection at diagnosis. Based on the algorithm, the Children's Oncology Group (COG) classifies patients into low, intermediate and high risk groups that are used for treatment allocation (1). Risk stratification varies between the North American COG and European national sarcoma groups, complicating the comparison of clinical trials results. In general, the prognosis for children with embryonal RMS (ERMS) is more favorable than those with alveolar RMS (ARMS) for similar stage/ clinical group of patients (1, 2).
In the era of molecular profiling, several sarcomas have been reclassified for treatment purposes based on molecular prognostic markers. In RMS, the hallmark molecular signature was the identification of PAX3/FOXO1 gene fusion in 1993 (3). A less frequent PAX7/FOXO1 gene fusion was identified in 1994 (4). Although these gene fusions are essentially unique to ARMS, they are only found in about 70-80% of histologically defined ARMS (5, 6). Several studies have suggested that PAX/FOXO1 fusion gene status portends a worse prognosis than fusion negative (FN) ARMS (7, 8). The PAX3/FOXO1 fusion may signify an inferior outcome than the PAX7/FOXO1 fusion, although these data remains conflicting (9-11). Furthermore, patients with FN ARMS have clinical outcomes similar to ERMS patients, a finding that is consistent with the fact that the molecular features of FN ARMS and ERMS are also similar (8). Hence, fusion status represents a robust molecular feature that is present in a substantial fraction of RMS cases.
Attempts to identify other prognostic gene signatures revealed a 34-gene signature (MG34) that was highly predictive of outcome within COG risk groups (12). However, in an independent cross-validated cohort, MG34 did not predict outcome significantly better when added to the PAX/FOXO1 fusion gene status (13). Because the PAX/FOXO1 gene fusion status is based on a well-established and easy to perform assay, the clinical utility of MG34 might be limited.
The study by Missiaglia et al. also identified an independent 5-gene signature, MG5, which showed a significant association with overall survival (OS) in the FN ARMS and ERMS patients and was also able to split the COG high-risk group in subgroups whose outcome differed. This latter difference did not reach statistical significance due to a limited statistical power as consequence of the small number of COG high-risk patients available in the study (13). In the current study, we tested the predictive power of the MG5 gene signature in a uniformly treated cohort of COG intermediate-risk FN RMS patients. In contrast to the aforementioned studies in which the MG5 signature was applied to microarray-based gene expression data from fresh-frozen tumor specimens, here we utilized the nCounter assay such that RNA transcripts can be quantified from formalin-fixed paraffin embedded (FFPE) tissues.
Materials and Methods
Patients and samples
This study involved 68 primary FN-RMS samples from patients treated on the COG study, D9803, from 1999-2005. The design and results from COG D9803 have been reported previously (14). All study subjects had intermediate-risk disease, based on accepted clinicalpathology criteria to include the following: patients with non-metastatic ARMS, patients with Stage 2 or 3, Clinical Group III ERMS; and patients <10 years of age with metastatic ERMS. On D9803, patients were randomized to receive vincristine, dactinomycin, and cyclophosphamide (VAC) or VAC alternating with vincristine, topotecan and cyclophosphamide (VTC). As part of D9803, paraffin embedded primary biopsy/resection samples for patients were banked at the Cooperative Human Tissue Network Bank, Columbus, OH; these blocks were used for the current study. Fusion gene status in all cases was confirmed by either reverse transcription polymerase chain reaction (RT-PCR) or fluorescent in-situ hybridization (FISH), as previously described. Cases with FN RMS and adequate tissue, as well as clinical-pathological annotation were included in the analysis.
RNA extraction from FFPE samples
FFPE tissue scrolls were used for RNA extraction. RNA was extracted using the Qiagen AllPrep DNA/RNA FFPE kit (Qiagen, Valencia, CA). Briefly, scrolls were de-paraffinized using xylene. Samples were then incubated with an optimized lysis buffer to release the RNA and precipitate the DNA. RNA containing supernatant was separated with centrifugation and then purified using the RNeasy MinElute spin column. Purified RNA was treated with DNase to remove any contaminating DNA, then washed and eluted. Up to 400ng of RNA was used with the nCounter assay (NanoString Technologies), and the Digital Analyzer was run at 1150 FOV for all samples.
Gene expression profiling using nCounter assay
The nCounter assay was used to measure the expression of 83 RNA transcripts, the expression of which was previously identified by us and others as having prognostic value for children with RMS (12, 13)(Timothy J. Triche, unpublished data); additional transcripts included 4 housekeeping genes, and 8 negative and 6 positive controls, in 84 samples representative of 68 primary FN RMS tumors. Here we limit the analysis to the five genes that are represented in MG5 signature (EPHA2 (Ephrin Receptor A2), EED (Embryonic Ectoderm Development), NSMF (NMDA receptor synaptonuclear signaling and neuronal migration factor), CBS (Cystathionine-β-synthase) and EPB41L4B (Erythrocyte Membrane Protein Band 4.1 like 4B) (Supplementary Table 1).
Taking advantage of the microarray expressions available from two cohorts of primary RMS samples (COG/IRSG (N=134) (11) and ITCC/CIT (N=101) (8), we explored the variability of the genes included in the nCounter platform in order to identify potential invariant endogenous controls which could be suitable for data normalization. We selected 10 genes which showed Standard Deviation (SD) < 0.6 as well as consistent level of expression in both datasets (Supplementary Figure 1), including DLG2, GRIK5, PGIL, ZNF671, CDYL, HPRT1, COMMD3, DYNLT1, RPL19 and ACTB. The samples went through a first quality assessment by evaluating distribution and level of expression of endogenous genes as well as positive and negative controls (Supplementary Figure 2 A-C). Normalization was performed by summarizing (by geometric mean) the positive and the invariant endogenous controls and adjusting samples by a relative factor. Background correction was performed using mean level of the negative controls plus 2 SDs. A second quality assessment was performed, including plotting of the log2 of the average raw counts versus the interquartile range (IQR) values (in log scale) (Supplementary Figure 2 D-F). Samples showing low intensity associated with high variability (IQR > 7.6) were removed from the analysis. When sample was performed with technical replicates, only the one with the highest average endogenous gene expression was retained. Nanostring analysis was performed using “NanoStringNorm” R package version 1.1.17. The gene expression profile data have been deposited at the ArrayExpress database (www.ebi.ac.uk/arrayexpress) under accession number E-MTAB-3580.
Data analysis and correlation with clinical-pathological characteristics
MG5 score was computed from the log transformed data using the model previously described (13). In summary, the risk score is the weighted sum of the log expression intensity of the genes, using the weights determined in the original study. The score was standardized by subtracting the score median and dividing by the score IQR. Correlation of MG5 score with clinical-pathological variables was tested by Wilcoxon or Kruskal–Wallis rank sum tests. Correlation of the variables with overall and failure free survival at univariate or multivariate levels was tested using Cox Proportional Hazard Regression models. Proportional hazard assumption was tested using the scaled Schoenfeld residual method implemented by “cox.zph” function in “survival” (version 2.37-7) R package(15). Relationship between expected survival at 3 or 5 years and the continuous MG5 score was visualized using local Cox regression analysis(16). We implemented the method by using “survfit.coxph” function from “survival” package (17), which was called at each grid point in MG5 score, using samples weighted by Gaussian kernel centered at the grid point. The kernel's sigma parameter is set to half of the SD of the MG5 score of all patients. The area under the curve (AUC) of the receiving operating characteristic (ROC) was computed using the Nearest Neighbor Estimation (NNE) method (18) as implemented in the “survival ROC” (version 1.0.3) R package. All analyses were performed using the R system for statistical computing, version 3.1.0 (R Core Team, 2013).
Results
Patient and sample characteristics
Primary tumor specimens were available for 68 FN-RMS treated on D9803 study, of which 68 specimens were FN RMS. Raw gene expression profile data was obtained from 84 samples, which included 16 technical replicates (derived from 11 patients). Twelve samples from 11 patients were discarded due to low quality. The nCounter assay was showed to be highly reproducible with a median Pearson's correlation coefficient between replicated samples of 0.96 (range 0.77-0.99). Upon removal of duplicated samples, the final dataset included 57 unique FN specimens (6 ARMS, 3 mixed and 48 ERMS). Table 1 summarizes the clinical-pathological features of these 57 patients.
Table 1. Summary of Clinical-Pathological Features of the 57 FN-RMS patients included in the study.
| Variables | Characteristic (N=57): n(%) |
|---|---|
| Histology | |
| ARMS Neg | 9 (15.8%) |
| ERMS | 48 (84.2%) |
| Gender | |
| Female | 16 (28.1%) |
| Male | 41 (71.9%) |
| Age | |
| (1,5] | 32 (56.1%) |
| (5,10] | 13 (22.8%) |
| (10,15] | 9 (15.8%) |
| (15,20] | 3 (5.3%) |
| Age categorized | |
| Favorable | 45 (78.9%) |
| Unfavorable | 12 (21.1%) |
| Tumor Size | |
| < 5cm | 11 (19.3%) |
| => 5cm | 41 (71.9%) |
| Unknown | 5 (8.8%) |
| Tumor Location | |
| Favorable | 12 (21.0%) |
| Unfavorable | 40 (70.2%) |
| Unknown | 5 (8.8%) |
| Group | |
| I | 4 (7.1%) |
| IIA | 6 (10.5%) |
| IIB | 1 (1.7%) |
| IIC | 2 (3.4%) |
| III | 28 (49.1%) |
| IV | 12 (21.1%) |
| Unknown | 4 (7.1%) |
| IRS Stage | |
| 1 | 11 (19.3%) |
| 2 | 4 (7.1%) |
| 3 | 26 (45.5%) |
| 4 | 12 (21.1%) |
| Unknown | 4 (7.1%) |
| T Stage | |
| T-1 | 17 (29.8%) |
| T-2 | 35 (61.4%) |
| Unknown | 5 (8.8%) |
| N Stage | |
| N-0 | 43 (75.4%) |
| N-1 | 9 (15.8%) |
| Unknown | 5 (8.8%) |
None of the available clinical-pathological features showed a significant correlation with overall survival (OS) and failure free survival (FFS) in univariate survival regression models in the cohort of 57 patients (Table 2).
Table 2.
Association of each clinico-pathological variable with OS and FFS in fusion negative RMS patients - Univariable Cox Proportional Hazard Regression model.
| Overall Survival (OS) | Failure Free Survival (FFS) | ||||
|---|---|---|---|---|---|
| Variables | HR (95% CI) | P-value | HR (95% CI) | P-value | N |
| Histology (ERMS vs. ARMS_Neg) | 1.29 (0.16-10.08) | 8.11E-001 | 1.44 (0.19-11.08) | 7.27E-001 | 57 |
| Histology (MIXED_Neg vs. ARMS_Neg) | 1.74 (0.11-28.20) | 6.96E-001 | 2.07 (0.13-33.55) | 6.07E-001 | 57 |
| Gender (Male vs. Female) | 0.55 (0.17-1.73) | 3.04E-001 | 0.51 (0.18-1.47) | 2.12E-001 | 57 |
| Age.cat (Unfavorable vs. Favorable) | 1.33 (0.36-4.92) | 6.70E-001 | 1.51 (0.47-4.82) | 4.88E-001 | 57 |
| Tumor.Size (=> 5cm vs. < 5cm) | 0.59 (0.15-2.30) | 4.49E-001 | 0.55 (0.17-1.83) | 3.31E-001 | 52 |
| Tumor.Location (Unfavorable vs. Favorable) | 0.47 (0.13-1.63) | 2.33E-001 | 0.49 (0.16-1.51) | 2.14E-001 | 52 |
| Group | 0.62 (0.32-1.22) | 1.66E-001 | 0.71 (0.39-1.31) | 2.78E-001 | 53 |
| IRS.Stage | 0.63 (0.37-1.09) | 1.00E-001 | 0.68 (0.42-1.12) | 1.32E-001 | 53 |
| Metastasis (M1 vs. M0) | 0.28 (0.04-2.24) | 2.33E-001 | 0.54 (0.12-2.46) | 4.30E-001 | 53 |
| T.stage (T-2 vs. T-1) | 1.13 (0.29-4.36) | 8.63E-001 | 0.99 (0.30-3.27) | 9.81E-001 | 52 |
| N.stage (N-1 vs. N-0) | 0.44 (0.06-3.47) | 4.35E-001 | 0.36 (0.05-2.80) | 3.30E-001 | 52 |
| MG5 score | 2.87 (1.52-5.27) | 1.02E-003 | 3.17 (1.66-6.05) | 4.63E-004 | 57 |
Correlation of MG5 risk score with clinical-pathological features and outcome
MG5 standardized score showed no significant association with any of the clinical-pathological variables available, including gender, age, stage, risk group, tumor histology, size and location (Supplementary Figure 3). We confirmed that the expression of three out of the five genes included in the MG5 signature were significantly associated with a poorer outcome (Table 3). Moreover, we observed a significant association of the MG5 score, as a continuous variable, with both OS and FFS (Table 2). Proportional hazard risk assumption was violated for neither OS nor FFS. The AUC of the ROC was 0.68 and 0.71 at 3 years and 0.69 and 0.74 at 5 years for OS and FFS, respectively. To investigate the dependence of survival on MG5 score level, we plotted the expected OS and FFS probabilities at 3 and 5 years versus the MG5 score (Figure 1A-B). As observed in the previous study, a low MG5 score was associated with a low risk for relapse or death, and the risk increased greatly in the top tertile. We split the population based on tertiles as previously described (13) and merged the two lower score groups (Low_MG5) to compare with the top tertile (High_MG5). Figure 2 shows a remarkable difference in OS and FFS between the Low and High MG5 score groups, with HR values in the same range as those found in the previous study.
Table 3.
Association between expression of the genes included in the MG5 signature with OS and FFS in fusion negative RMS patients - Univariate Cox Proportional Hazard Regression model.
| Overall Survival (OS) | Failure Free Survival (FFS) | ||||
|---|---|---|---|---|---|
| Gene | HR (95% CI) | P-value | HR (95% CI) | P-value | N |
| EPHA2 | 2.65 (1.16-6.03) | 2.06E-002 | 2.76 (1.31-5.81) | 7.45E-003 | 57 |
| EED | 1.00 (0.29-3.47) | 9.99E-001 | 1.08 (0.34-3.40) | 8.98E-001 | 57 |
| NSMF | 2.08 (1.16-3.74) | 1.46E-002 | 2.59 (1.36-4.91) | 3.61E-003 | 57 |
| CBS | 1.10 (0.73-1.66) | 6.44E-001 | 1.09 (0.74-1.59) | 6.77E-001 | 57 |
| EPB41L4B | 1.34 (1.02-1.77) | 3.72E-002 | 1.29 (1.00-1.66) | 4.89E-002 | 57 |
Figure 1.
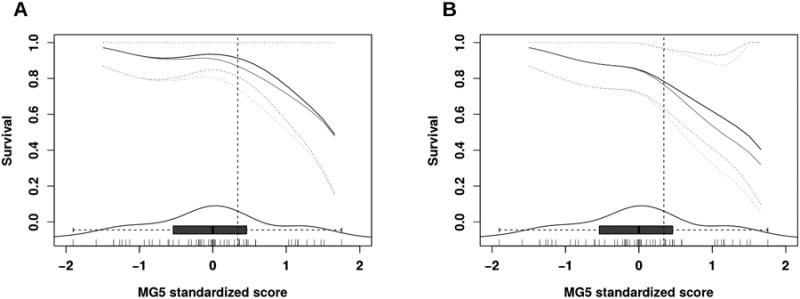
Probability of OS (A) and FFS (B) survival at 3 (black line) and 5 years (grey line), depending on MG5 score level. Dotted lines represent 95% CI. The box-and-whisker plot and density plot at the bottom of the graphs represent the distribution of the score levels. Each of the vertical segments at the bottom margin represents a patient. The vertical dotted line represents the MG5 top tertile.
Figure 2.
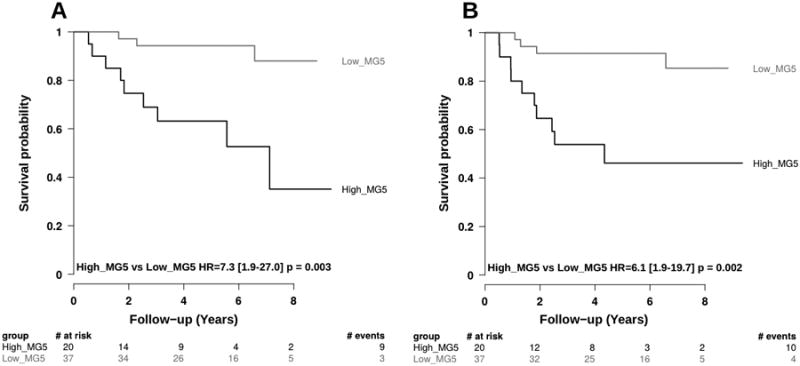
Kaplan Meier curves for OS (A) and FFS (B) splitting MG5 signature score in two groups. MG5 was categorized using tertiles: High_MG5 were patients whose MG5 score expression was within the top tertile; all the other were defined as Low_MG5.
Multivariable analysis confirmed that MG5 score is an independent prognostic marker when combined with tumor histology (ARMS, ERMS) and metastatic status (M0, M1) (Table 4).
Table 4.
Multivariate Cox Proportional Hazard regression model including MG5 score (as continuum), tumor histology (ARMS, ERMS)* and metastatic status (M0, M1).
| Overall Survival (OS) | Failure Free Survival (FFS) | ||||
|---|---|---|---|---|---|
| Variables | HR (95% CI) | P-value | HR (95% CI) | P-value | N |
| MG5.score | 2.7 (1.39-5.18) | 3.40E-003 | 2.95 (1.53-5.68) | 1.27E-003 | 53 |
| Metastasis (M1 vs M0) | 0.4 (0.05-2.92) | 3.42E-001 | 0.72 (0.15-3.34) | 6.72E-001 | 53 |
| Histology (ERMS vs ARMS_Neg)* | 1.6 (0.17-14.45) | 6.94E-001 | 1.46 (0.17-12.33) | 7.26E-001 | 53 |
In this analysis the 3 patients with Mixed histology were pooled with the alveolar histology
Discussion
While PAX/FOXO1 fusion status has recently become a well-accepted prognostic marker in ARMS, there are no similarly validated molecular prognostic features for FN RMS. The results of our study confirm that MG5 is an independent prognostic marker in FN RMS and that a high MG5 score portends a poor prognosis in this group of patients.
Previously, the MG5 signature was shown to have prognostic implications in FN patients and seemingly divided the COG patients with high-risk disease into two separate risk groups (13). However, this study used the Affymetrix GeneChip Human U133 microarray platform to measure gene expression, which ideally requires availability of frozen tissues. To date, the need for frozen specimens generally limited the capacity for a molecular prognostic factor to be applied to very large numbers of specimens or incorporated into clinical practice. On the other hand, the nCounter assay allows for RNA extracted from FFPE tissues to be analyzed for gene expression. This approach shows excellent correlation with Taqman based RT-PCR approach (19), and RNA expression quantified by nCounter has been used to discriminate FN from FP RMS (20). The nCounter assay has also been used and validated in other tumor types such as breast cancer and neuroblastoma (21, 22).
In the current study, we aimed to validate the MG5 signature using the FFPE based nCounter approach in a cohort of 68 COG intermediate-risk patients representing a cohort distinct from those used to generate MG5. Our results showed that high quality RNA was available for gene expression analysis in the majority of FFPE specimens (84% of the patients) and that the gene expression pattern was highly reproducible across technical replicates. More importantly, the gene signature divided a uniformly treated population of COG intermediate-risk FN RMS patients into two distinct groups for both OS and FFS, thus validating that MG5 is indeed prognostic in FN RMS. Of note, our results did not show any correlation of survival with the available clinical-pathological features but this was expected as all patients included in this study were homogenously classified as intermediate-risk based on the clinical and histological features.
The five analytes identified in the MG5 signature include EPHA2 (Ephrin Receptor A2; chromosome 1), EED (Embryonic Ectoderm Development; chromosome 11), NSMF (NMDA receptor synaptonuclear signaling and neuronal migration factor; chromosome 9), CBS (Cystathionine-β-synthase; chromosome 21) and EPB41L4B (Erythrocyte Membrane Protein Band 4.1 like 4B; chromosome 9). While the role of these genes in RMS remains to be specifically defined, majority of them have been implicated in cancer. EPHA2 receptor overexpression in gastric cancer stromal cells is a prognostic factor for relapse (23). It also promotes tumor cell proliferation and motility in non-small cell lung cancer (24); and increases infiltrative capacity of glioma stem cells in glioblastoma multiforme models (25). EPHA2 is also the most abundant surface receptor expressed in osteosarcoma, and patients with EPHA2 positive disease tend to have inferior overall survival (26). In vitro models have shown EPHA2 can foster angiogenesis in Ewing sarcoma (27). In RMS, it is a downstream target of the PAX3/FOXO1 fusion protein as PAX3/FOXO1 fusion protein has been shown to directly bind the EPHA2 promoter (28). Therefore, over-expression of EPHA2 in FN RMS might be a potential parallel to fusion positive RMS in the context of poor patient outcome.
EED is a member of the Polycomb repressor complex 2 (PRC2), which is important in epigenetic regulation of cancer. It is up-regulated in breast cancer lymph node metastasis and correlates with tumor proliferation (29). PRC2 is also highly expressed in mesothelioma and knockdown of EED leads to decreased proliferation, migration and tumorigenicity of mesothelioma cells (30). PRC2 overexpression also occurs in prostate cancer and adenoid cystic carcinoma of the salivary gland and portends a poor prognosis (31, 32). Recently, RMS was shown to highly express JARID2, a gene that encodes a protein that recruits histone-methylating complexes to their target genes. Further, JARID2 is a direct transcriptional target of PAX3-FOXO1 fusion protein that through PRC2 represses expression of genes involved in myogenic differentiation and maintains the undifferentiated phenotype seen in RMS. Interaction of PRC2 with myogenic gene promoters is dependent on EED (33). The polycomb group protein, Enhancer of Zeste Homolog 2 (EZH2), also supports survival and proliferation of alveolar RMS cells by repressing F-box protein 32 (FBXO32), a gene associated with muscle homeostasis (34, 35). CBS encodes cystathionine β-synthase, an enzyme in the folate metabolic pathway, which is closely linked to DNA methylation. Dysregulation of this pathway contributes to cancer pathogenesis, and induction of CBS promotes cellular proliferation in colorectal cancer (36). It also promotes ovarian tumor growth and drug resistance (37). How EPB41L4B might relate to cancer is unclear, but Ehm2, a member of the NF2/ERM/4.1 superfamily, has been implicated in breast and prostate cancer invasiveness (38, 39). Thus, beyond biomarker use, these genes might also contribute to RMS pathogenesis.
Our study confirms the ability of MG5 signature to identify different risk groups within FN RMS from a different patient cohort comprised of those with intermediate risk disease and signifies the ability of this signature to be able to identify poor-risk patients in this FN cohort. Nonetheless, it will be important to validate the potential clinical usefulness of this prognostic biomarker further in the context of a larger prospective clinical trial. Ultimately, our goal will be to apply the “MG5 score” to an individual patient with FN RMS. How robustly this discriminates individuals destined to fare well or poorly with a given therapy also remains to be determined.
It is also important to emphasize that the survival advantage for that subset of children with a favorable MG5 score is based on the therapy that is currently applied to patients with intermediate risk disease. Whether therapy intensity can be decreased while maintaining the excellent survival – or whether intensifying therapy can improve survival in that subset with an unfavorable MG5 score – must also be prospectively tested.
Supplementary Material
Statement of Translational Relevance.
To date, there are no known prognostic markers identified in patients with fusion gene-negative rhabdomyosarcoma. This study validates the 5-gene (MG5) signature as a prognostic marker in patients with fusion negative intermediate-risk rhabdomyosarcoma clearly stratifying this otherwise clinically homogenous population of patients into two risk groups based on outcome. In addition, this analysis was performed using nCounter assay on paraffin embedded tissues and the results were concordant to previously published results using frozen tissues in a different patient cohort. Therefore, this work holds tremendous translational relevance as the MG5 signature can be reliably assessed in readily available paraffin embedded tissues of fusion gene-negative rhabdomyosarcoma patients in prospective clinical trials to stratify them into prognostic risk groups as well as to potentially tailor future therapy based on these risk groups.
Acknowledgments
Financial Support: The work was supported, in part, by funding from the National Cancer Institute/NIH (RC2-CA148216), NHS funding to the NIHR Biomedical Research Centre at The Royal Marsden and the Institute Of Cancer Research, Fondation Medic (http://www.fondation-medic.ch/) and the Chris Lucas Trust, UK.
Footnotes
Conflicts of Interest: The authors have no conflicts of interest to disclose
References
- 1.Meza JL, Anderson J, Pappo AS, Meyer WH. Analysis of prognostic factors in patients with nonmetastatic rhabdomyosarcoma treated on intergroup rhabdomyosarcoma studies III and IV: the Children's Oncology Group. J Clin Oncol. 2006;24:3844–3851. doi: 10.1200/JCO.2005.05.3801. [DOI] [PubMed] [Google Scholar]
- 2.Malempati S, Hawkins DS. Rhabdomyosarcoma: review of the Children's Oncology Group (COG) Soft-Tissue Sarcoma Committee experience and rationale for current COG studies. Pediatr Blood Cancer. 2012;59:5–10. doi: 10.1002/pbc.24118. [DOI] [PMC free article] [PubMed] [Google Scholar]
- 3.Galili N, Davis RJ, Fredericks WJ, Mukhopadhyay S, Rauscher FJ, 3rd, Emanuel BS, et al. Fusion of a fork head domain gene to PAX3 in the solid tumour alveolar rhabdomyosarcoma. Nat Genet. 1993;5:230–235. doi: 10.1038/ng1193-230. [DOI] [PubMed] [Google Scholar]
- 4.Davis RJ, D'Cruz CM, Lovell MA, Biegel JA, Barr FG. Fusion of PAX7 to FKHR by the variant t(1;13)(p36;q14) translocation in alveolar rhabdomyosarcoma. Cancer Res. 1994;54:2869–2872. [PubMed] [Google Scholar]
- 5.Anderson J, Gordon T, McManus A, Mapp T, Gould S, Kelsey A, et al. Detection of the PAX3-FKHR fusion gene in paediatric rhabdomyosarcoma: a reproducible predictor of outcome? Br J Cancer. 2001;85:831–835. doi: 10.1054/bjoc.2001.2008. [DOI] [PMC free article] [PubMed] [Google Scholar]
- 6.Barr FG. Gene fusions involving PAX and FOX family members in alveolar rhabdomyosarcoma. Oncogene. 2001;20:5736–5746. doi: 10.1038/sj.onc.1204599. [DOI] [PubMed] [Google Scholar]
- 7.Skapek SX, Anderson J, Barr FG, Bridge JA, Gastier-Foster JM, Parham DM, et al. PAX-FOXO1 fusion status drives unfavorable outcome for children with rhabdomyosarcoma: a children's oncology group report. Pediatr Blood Cancer. 2013;60:1411–1417. doi: 10.1002/pbc.24532. [DOI] [PMC free article] [PubMed] [Google Scholar]
- 8.Williamson D, Missiaglia E, de Reynies A, Pierron G, Thuille B, Palenzuela G, et al. Fusion gene-negative alveolar rhabdomyosarcoma is clinically and molecularly indistinguishable from embryonal rhabdomyosarcoma. J Clin Oncol. 2010;28:2151–2158. doi: 10.1200/JCO.2009.26.3814. [DOI] [PubMed] [Google Scholar]
- 9.Sorensen PH, Lynch JC, Qualman SJ, Tirabosco R, Lim JF, Maurer HM, et al. PAX3-FKHR and PAX7-FKHR gene fusions are prognostic indicators in alveolar rhabdomyosarcoma: a report from the children's oncology group. J Clin Oncol. 2002;20:2672–2679. doi: 10.1200/JCO.2002.03.137. [DOI] [PubMed] [Google Scholar]
- 10.Stegmaier S, Poremba C, Schaefer KL, Leuschner I, Kazanowska B, Bekassy AN, et al. Prognostic value of PAX-FKHR fusion status in alveolar rhabdomyosarcoma: a report from the cooperative soft tissue sarcoma study group (CWS) Pediatr Blood Cancer. 2011;57:406–414. doi: 10.1002/pbc.22958. [DOI] [PubMed] [Google Scholar]
- 11.Davicioni E, Finckenstein FG, Shahbazian V, Buckley JD, Triche TJ, Anderson MJ. Identification of a PAX-FKHR gene expression signature that defines molecular classes and determines the prognosis of alveolar rhabdomyosarcomas. Cancer Res. 2006;66:6936–6946. doi: 10.1158/0008-5472.CAN-05-4578. [DOI] [PubMed] [Google Scholar]
- 12.Davicioni E, Anderson JR, Buckley JD, Meyer WH, Triche TJ. Gene expression profiling for survival prediction in pediatric rhabdomyosarcomas: a report from the children's oncology group. J Clin Oncol. 2010;28:1240–1246. doi: 10.1200/JCO.2008.21.1268. [DOI] [PMC free article] [PubMed] [Google Scholar]
- 13.Missiaglia E, Williamson D, Chisholm J, Wirapati P, Pierron G, Petel F, et al. PAX3/FOXO1 fusion gene status is the key prognostic molecular marker in rhabdomyosarcoma and significantly improves current risk stratification. J Clin Oncol. 2012;30:1670–1677. doi: 10.1200/JCO.2011.38.5591. [DOI] [PubMed] [Google Scholar]
- 14.Arndt CA, Stoner JA, Hawkins DS, Rodeberg DA, Hayes-Jordan AA, Paidas CN, et al. Vincristine, actinomycin, and cyclophosphamide compared with vincristine, actinomycin, and cyclophosphamide alternating with vincristine, topotecan, and cyclophosphamide for intermediate-risk rhabdomyosarcoma: children's oncology group study D9803. J Clin Oncol. 2009;27:5182–5188. doi: 10.1200/JCO.2009.22.3768. [DOI] [PMC free article] [PubMed] [Google Scholar]
- 15.Grambsch PM, Therneau TM. Proportional hazards tests and diagnostics based on weighted residuals. Biometrika. 1994;81:515–526. [Google Scholar]
- 16.Tibshirani R, Hastie T. Local Likelihood Estimation. Journal of American Statistical Association. 1987;82:559–567. [Google Scholar]
- 17.Therneau TM, Grambasch PM. Modeling Survival Data: Extending the Cox Model. New York: Springer-Verlag; 2000. [Google Scholar]
- 18.Heagerty PJ, Lumley T, Pepe MS. Time-dependent ROC curves for censored survival data and a diagnostic marker. Biometrics. 2000;56:337–344. doi: 10.1111/j.0006-341x.2000.00337.x. [DOI] [PubMed] [Google Scholar]
- 19.Malkov VA, Serikawa KA, Balantac N, Watters J, Geiss G, Mashadi-Hossein A, et al. Multiplexed measurements of gene signatures in different analytes using the Nanostring nCounter Assay System. BMC Res Notes. 2009;2:80. doi: 10.1186/1756-0500-2-80. [DOI] [PMC free article] [PubMed] [Google Scholar]
- 20.Wilson RA, Teng L, Bachmeyer KM, Bissonnette ML, Husain AN, Parham DM, et al. A novel algorithm for simplification of complex gene classifiers in cancer. Cancer Res. 2013;73:5625–5632. doi: 10.1158/0008-5472.CAN-13-0324. [DOI] [PMC free article] [PubMed] [Google Scholar]
- 21.Nielsen T, Wallden B, Schaper C, Ferree S, Liu S, Gao D, et al. Analytical validation of the PAM50-based Prosigna Breast Cancer Prognostic Gene Signature Assay and nCounter Analysis System using formalin-fixed paraffin-embedded breast tumor specimens. BMC Cancer. 2014;14:177. doi: 10.1186/1471-2407-14-177. [DOI] [PMC free article] [PubMed] [Google Scholar]
- 22.Stricker TP, Morales La Madrid A, Chlenski A, Guerrero L, Salwen HR, Gosiengfiao Y, et al. Validation of a prognostic multi-gene signature in high-risk neuroblastoma using the high throughput digital NanoString nCounter system. Mol Oncol. 2014;8:669–678. doi: 10.1016/j.molonc.2014.01.010. [DOI] [PMC free article] [PubMed] [Google Scholar]
- 23.Kikuchi S, Kaibe N, Morimoto K, Fukui H, Niwa H, Maeyama Y, et al. Overexpression of Ephrin A2 receptors in cancer stromal cells is a prognostic factor for the relapse of gastric cancer. Gastric Cancer. 2014 doi: 10.1007/s10120-014-0390-y. [DOI] [PubMed] [Google Scholar]
- 24.Song W, Ma Y, Wang J, Brantley-Sieders D, Chen J. JNK signaling mediates EPHA2-dependent tumor cell proliferation, motility, and cancer stem cell-like properties in non-small cell lung cancer. Cancer Res. 2014;74:2444–2454. doi: 10.1158/0008-5472.CAN-13-2136. [DOI] [PMC free article] [PubMed] [Google Scholar]
- 25.Miao H, Gale NW, Guo H, Qian J, Petty A, Kaspar J, et al. EphA2 promotes infiltrative invasion of glioma stem cells in vivo through cross-talk with Akt and regulates stem cell properties. Oncogene. 2014 doi: 10.1038/onc.2013.590. [DOI] [PMC free article] [PubMed] [Google Scholar]
- 26.Posthumadeboer J, Piersma SR, Pham TV, van Egmond PW, Knol JC, Cleton-Jansen AM, et al. Surface proteomic analysis of osteosarcoma identifies EPHA2 as receptor for targeted drug delivery. Br J Cancer. 2013;109:2142–2154. doi: 10.1038/bjc.2013.578. [DOI] [PMC free article] [PubMed] [Google Scholar]
- 27.Sainz-Jaspeado M, Huertas-Martinez J, Lagares-Tena L, Martin Liberal J, Mateo-Lozano S, de Alava E, et al. EphA2-induced angiogenesis in ewing sarcoma cells works through bFGF production and is dependent on caveolin-1. PLoS One. 2013;8:e71449. doi: 10.1371/journal.pone.0071449. [DOI] [PMC free article] [PubMed] [Google Scholar]
- 28.Begum S, Emami N, Cheung A, Wilkins O, Der S, Hamel PA. Cell-type-specific regulation of distinct sets of gene targets by Pax3 and Pax3/FKHR. Oncogene. 2005;24:1860–72. doi: 10.1038/sj.onc.1208315. [DOI] [PubMed] [Google Scholar]
- 29.Yu H, Simons DL, Segall I, Carcamo-Cavazos V, Schwartz EJ, Yan N, et al. PRC2/EED-EZH2 complex is up-regulated in breast cancer lymph node metastasis compared to primary tumor and correlates with tumor proliferation in situ. PLoS One. 2012;7:e51239. doi: 10.1371/journal.pone.0051239. [DOI] [PMC free article] [PubMed] [Google Scholar]
- 30.Kemp CD, Rao M, Xi S, Inchauste S, Mani H, Fetsch P, et al. Polycomb repressor complex-2 is a novel target for mesothelioma therapy. Clin Cancer Res. 2012;18:77–90. doi: 10.1158/1078-0432.CCR-11-0962. [DOI] [PMC free article] [PubMed] [Google Scholar]
- 31.van Leenders GJ, Dukers D, Hessels D, van den Kieboom SW, Hulsbergen CA, Witjes JA, et al. Polycomb-group oncogenes EZH2, BMI1, and RING1 are overexpressed in prostate cancer with adverse pathologic and clinical features. Eur Urol. 2007;52:455–463. doi: 10.1016/j.eururo.2006.11.020. [DOI] [PubMed] [Google Scholar]
- 32.Vekony H, Raaphorst FM, Otte AP, van Lohuizen M, Leemans CR, van der Waal I, et al. High expression of Polycomb group protein EZH2 predicts poor survival in salivary gland adenoid cystic carcinoma. J Clin Pathol. 2008;61:744–749. doi: 10.1136/jcp.2007.054262. [DOI] [PubMed] [Google Scholar]
- 33.Walters ZS, Villarejo-Balcells B, Olmos D, Buist TW, Missiaglia E, Allen R, et al. JARID2 is a direct target of the PAX3-FOXO1 fusion protein and inhibits myogenic differentiation of rhabdomyosarcoma cells. Oncogene. 2014;33:1148–1157. doi: 10.1038/onc.2013.46. [DOI] [PMC free article] [PubMed] [Google Scholar]
- 34.Ciarapica R, De Salvo M, Carcarino E, Bracaglia G, Adesso L, Leoncini PP, et al. The Polycomb group (PcG) protein EZH2 supports the survival of PAX3-FOXO1 alveolar rhabdomyosarcoma by repressing FBXO32 (Atrogin1/MAFbx) Oncogene. 2014;33:4173–4184. doi: 10.1038/onc.2013.471. [DOI] [PubMed] [Google Scholar]
- 35.Marchesi I, Giordano A, Bagella L. Roles of enhancer of zeste homolog 2: from skeletal muscle differentiation to rhabdomyosarcoma carcinogenesis. Cell Cycle. 2014;13:516–527. doi: 10.4161/cc.27921. [DOI] [PubMed] [Google Scholar]
- 36.Coletta C, Chao C, Modis K, Papapetropoulos A, Hellmich M, Szabo C. OP17 Cystathionine-beta-synthase (CBS) is upregulated in colorectal cancer cells and promotes their proliferation. Nitric Oxide. 2013;31(Suppl 2):S26–7. doi: 10.1016/j.niox.2014.03.001. [DOI] [PMC free article] [PubMed] [Google Scholar]
- 37.Bhattacharyya S, Saha S, Giri K, Lanza IR, Nair KS, Jennings NB, et al. Cystathionine beta-synthase (CBS) contributes to advanced ovarian cancer progression and drug resistance. PLoS One. 2013;8:e79167. doi: 10.1371/journal.pone.0079167. [DOI] [PMC free article] [PubMed] [Google Scholar]
- 38.Yu H, Ye L, Mansel RE, Zhang Y, Jiang WG. Clinical implications of the influence of Ehm2 on the aggressiveness of breast cancer cells through regulation of matrix metalloproteinase-9 expression. Mol Cancer Res. 2010;8:1501–1512. doi: 10.1158/1541-7786.MCR-10-0186. [DOI] [PubMed] [Google Scholar]
- 39.Wang J, Cai Y, Penland R, Chauhan S, Miesfeld RL, Ittmann M. Increased expression of the metastasis-associated gene Ehm2 in prostate cancer. Prostate. 2006;66:1641–1652. doi: 10.1002/pros.20474. [DOI] [PubMed] [Google Scholar]
Associated Data
This section collects any data citations, data availability statements, or supplementary materials included in this article.