Abstract
Invasive bladder cancer, for which there have been few therapeutic advances in the past 20 years, is a significant medical problem associated with metastatic disease and frequent mortality. Although previous studies had identified many genetic alterations in invasive bladder cancer, recent genome-wide studies have provided a more comprehensive view. Here we review those recent findings and suggest therapeutic strategies. Bladder cancer has a high mutation rate, exceeded only by lung cancer and melanoma. About 65% of all mutations are due to APOBEC-mediated mutagenesis. There is a high frequency of mutations and/or genomic amplification or deletion events that affect many of the canonical signaling pathways involved in cancer development: cell cycle, receptor tyrosine kinase, RAS, and PI-3-kinase/mTOR. In addition, mutations in chromatin-modifying genes are unusually frequent in comparison with other cancers, and mutation or amplification of transcription factors is also common. Expression clustering analyses organize bladder cancers into four principal groups, which can be characterized as luminal, immune undifferentiated, luminal immune, and basal. The four groups show markedly different expression patterns for urothelial differentiation (keratins, uroplakins) and immunity genes (CD274, CTLA4), among others. These observations suggest numerous therapeutic opportunities, including kinase inhibitors and antibody therapies for genes in the canonical signaling pathways, histone deacetylase inhibitors, novel molecules for chromatin gene mutations, and immune therapies, which should be targeted to specific patients based on genomic profiling of their cancers.
Introduction
Bladder cancer is a major cause of morbidity and mortality worldwide, with about 380,000 new cases and 150,000 deaths per year (1). It is notable among the common cancers in that both pre-invasive and invasive forms of the disease are commonly diagnosed. Non-muscle invasive bladder cancer (NMIBC), in which the smooth muscle layer surrounding the bladder is not invaded by tumor, accounts for about 80% of all bladder cancer diagnoses (1). NMIBCs (Ta and T1) include both low and high-grade papillary tumors, and carcinoma in situ, a flat high-grade tumor. NMIBC treatment consists of intravesical chemo- or immunotherapy and requires regular cystoscopic monitoring for early detection of recurrence and/or progression to invasive disease. Muscle-invasive bladder cancer, hereafter termed invasive bladder cancer, is characterized by a high risk of metastases to regional pelvic lymph nodes and visceral sites, and is usually incurable despite systemic chemotherapy. Unfortunately, treatment of invasive bladder cancer has progressed little in the past two decades (2).
Past studies have identified multiple genes as commonly mutated in bladder cancer, including TP53 (3), RB1 (4), TSC1 (5), FGFR3 (6), and PIK3CA (7,8). Many genomic regions of gain and loss have also been identified (1,9).
A comprehensive review of the molecular pathogenesis of bladder cancer was recently published (1). Here we focus on insights derived from the NIH NCI TCGA bladder cancer program (10) and other recent genome-wide analyses that include whole exome sequencing (11–13).
High Mutation Rate in Bladder Cancer Due to APOBEC-Type Mutagenesis
TCGA analysis of 130 invasive bladder cancers revealed a relatively high rate of mutation, a mean of 7.7 and median of 5.5 per Mb within coding regions, amounting to 302 protein-coding mutations per cancer (10). Lung adenocarcinoma, lung squamous cell carcinoma, and melanoma are the only major cancers studied by TCGA that have higher mutation rates. For those cancers the causes are thought to be cigarette carcinogen mutagenesis (lung cancer) and sunlight UV mutagenesis (melanoma) (14). Unexpectedly, the association between smoking history and mutation rate or mutation spectrum in TCGA cohort was rather weak (10), despite the known epidemiologic association between cigarette smoking and bladder cancer. In TCGA data, many mutations seen in bladder cancer were TCW-> TTW or TGW changes (nucleotide subject to change is underlined, W=A/T), a class of mutation probably mediated by one of the DNA cytosine deaminases in the APOBEC gene family (15,16).
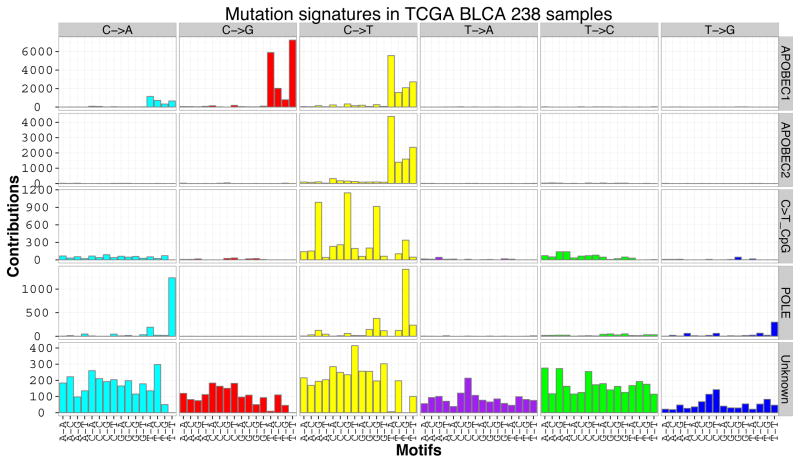
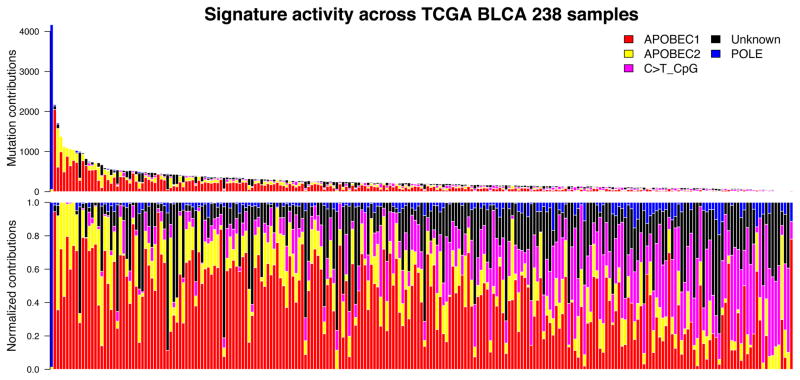
To examine mutational categories and processes in greater detail, we performed Bayesian non-negative matrix factorization (Bayesian-NMF) analysis (17) (note that ref. 17 describes the original algorithm; full details of the method and its implementation will be described elsewhere) of the mutations stratified by 96 tri-nucleotide contexts in 238 TCGA bladder cancer specimens (Fig. 1), which were downloaded from Broad GDAC firehose. While conventional NMF requires the number of signatures as an input, Bayesian-NMF automatically prunes away irrelevant components that do not contribute to explaining observed mutations and effectively determines the appropriate number of signatures and their sample-specific contributions. That analysis identified five distinct patterns of mutagenesis operating among 73301 single nucleotide variants (SNVs) in 238 bladder cancers (Fig. 1A). Two are variations of the APOBEC mutation signature, one consisting of C>T mutations in the TCW context (“APOBEC2” – 17% SNVs), and the other consisting of both C>T and C>G mutations in the consensus (“APOBEC1” – 48% SNVs). In contrast to other signatures the third common mutation pattern (“Unknown”) is relatively non-specific in terms of site and context and had a broad spectrum of base changes. 18% SNVs were associated with this signature of uncertain origin. The fourth pattern is the well-known C>T transition at CpG sites (“C>T_CpG” – 10% SNVs). Interestingly, one sample with an ultra-high mutator phenotype (> 4000 SNVs) had a POLE (DNA polymerase epsilon catalytic subunit) mutation commonly seen in colon and endometrial cancers (P286R), and a predominance of C>A mutations at TCT and C>T mutations at TCG sites (“POLE” – 8% SNVs). Figure 1B demonstrates that the number of mutations is highly variable among individual bladder cancers, as is the mutation signature. Overall the APOBEC mutation pattern, with APOBEC1 and APOBEC2 signatures, accounts for about 65% of all point mutations, and is predominant in cancers with high mutation burdens apart from the single POLE hyper-mutated sample. However, there are some cancers with APOBEC mutation signature contribution as low as 5% (Fig. 1B). APOBEC3B is expressed at relatively high levels in all bladder cancers (10), and may be the mediator of APOBEC signature mutations (18). Notably, independent analysis of a smaller data set (n=30), but including whole genome sequencing data for 4 samples, indicated that there was a strong APOBEC signature in 37% of bladder cancer, medium in 28%, and weak in 37% (19).
Figure 1.
Mutation signatures in 238 muscle-invasive TCGA bladder cancers. A. Bayesian NMF (17) was used to identify five patterns of mutation that occur in bladder cancer genomes. Two of them match the APOBEC pattern, TCW-> TTW or TGW. The uppermost signature, APOBEC1, consists of both C>T and C>G mutations, whereas the next, APOBEC2, consists of only C>T mutations. The third mutation signature is that of CpG > TpG, the fourth is a POLE signature, and the fifth signature identified by NMF analysis is of unknown origin. The y axis gives the number of mutations of each type at each specific sequence.
B. Graph of the total number of mutations associated with five mutation signatures (upper panel) and relative proportion of mutation types (lower panels) seen in each TCGA bladder cancer sample.
Genes Commonly Mutated in Bladder Cancer
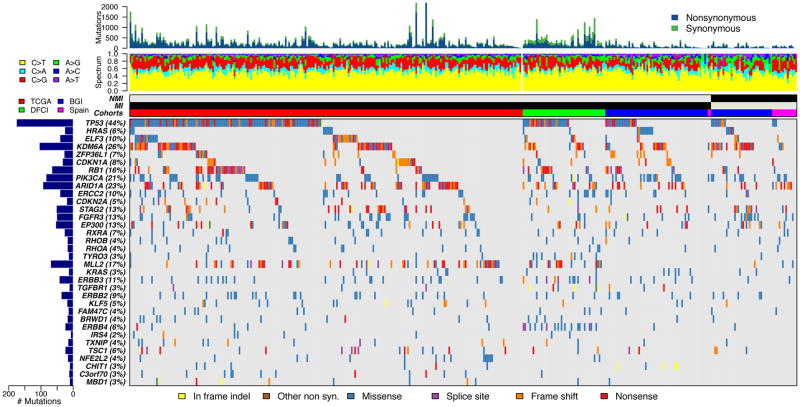
To identify genes that are statistically significantly mutated in bladder cancer, we combined mutation data sets from TCGA (238 invasive cases) (10), the Beijing Genomics Institute [(BGI); 62 invasive cases and 37 NMIBC] (11), the CNIO (Spanish National Cancer Research Centre), (2 invasive and 15 NMIBC) (12), and the Dana-Farber Cancer Institute/Broad Institute (50 invasive cases) (13). Thirty-four genes were identified as being significantly mutated using Mutsig 2CV (20) (Fig. 2, Table 1) on this combined set of cohorts (not including the CNIO cohort due to unavailability of synonymous mutations), with rates of mutation varying from a high of 44% in TP53 to a low of 2% in IRS4. Many other large genes had rates of mutation as high as 11% (e.g. CREBBP (11%), MLL3 (11%), ATM (9%), NF1 (7%), and FBXW7 (6%)), but were not identified as statistically significantly mutated since the number of mutations that are expected to be random events (‘noise’) grows in proportion to the size of a gene. Statistically significantly mutated genes grouped into several different categories (Table 1). Genes related to receptor tyrosine kinase function including several kinases were significantly mutated (n=7), as were those involved in chromatin regulation (n=6), transcription (n=5), and cell cycle regulation (n=4). The list of genes is similar to that reported previously from analysis of individual data sets (10,11). Many pairs of genes from the list showed patterns of co-occurrence of mutations, including TP53 and RB1, STAG2 and FGFR3, MLL2 and NFE2L2, KDM6A and FGFR3, and ERBB3 and ERBB4, all with q < 0.003 (Fisher exact test with FDR correction used for these and subsequent analyses). Only a few pairs showed patterns of mutual exclusivity, TP53 and any RAS gene, and RB1 and FGFR3, q < 0.02.
Figure 2.
Significantly mutated genes (SMGs) identified in 404 cases of bladder cancer. Mutation data used was from TCGA (238 invasive cases) (10), the Beijing Genomics Institute (62 invasive cases and 37 NMIBC: 28 T1N0, 2 T1bN0, 1 T1Nx, 6 TaN0) (11), the CNIO (Spanish National Cancer Research Centre), (2 invasive and 15 NMIBC: 3 TaG1, 2 TaG2, 1 TaG3, 3 T1G2, 6 T1G3) (12), and the DFCI/Broad (50 invasive cases) (13). Sequentially from top to bottom: mutation rate, mutation spectrum, non-muscle invasive (NMI) vs. muscle-invasive (MI), source of data, and genes with statistically significant levels of mutation (MutSig 2CV (19) false discovery rate < 0.1) sorted by q value are shown. Colors indicate different mutation types, shown at bottom. The total number of mutations and the percent of samples with mutation in each gene are shown at left. The CNIO data were not included in MutSig analysis to identify SMGs. Mutations seen at allele fraction ≤ 5% were not included. Five genes (FAM82A2, STK39, ATP8P2, ZNF83, GLT6D1) identified by Mutsig were also deleted due to suspicious mutation patterns. Note that bar plots at the top are truncated for a few cancers.
Table 1.
Genes identified as being significantly mutated or subject to focal copy number change in bladder cancer
| Genes identified as signficantly mutated | |||||||||||
|---|---|---|---|---|---|---|---|---|---|---|---|
| Gene | Category | Total # mutations | % samples with mutations | # mutations NMIBC | % NMIBC | # mutations invasive | % invasive | Higher in NMIBC p= | Higher in NMIBC q= | Higher in invasive p= | Higher in invasive q= |
| TP53 | cell cycle | 176 | 44% | 12 | 22% | 164 | 47% | 0.9999 | 1 | 0.0004 | 0.01584 |
| HRAS | RAS | 26 | 6% | 5 | 9% | 21 | 6% | 0.2577 | 1 | 0.8829 | 0.9586 |
| ELF3 | transcription | 41 | 10% | 4 | 7% | 37 | 11% | 0.8305 | 1 | 0.3318 | 0.6532 |
| KDM6A | chromatin | 105 | 26% | 23 | 43% | 82 | 23% | 0.0032 | 0.1229 | 0.9988 | 0.9988 |
| ZFP36L1 | transcription | 28 | 7% | 2 | 4% | 26 | 7% | 0.9122 | 1 | 0.2477 | 0.5945 |
| CDKN1A | cell cycle | 33 | 8% | 1 | 2% | 32 | 9% | 0.9929 | 1 | 0.0468 | 0.3332 |
| RB1 | cell cycle | 66 | 16% | 5 | 9% | 61 | 17% | 0.9637 | 1 | 0.0894 | 0.4246 |
| PIK3CA | PI3K-mTOR | 84 | 21% | 13 | 24% | 71 | 20% | 0.3162 | 1 | 0.7960 | 0.9452 |
| ARID1A | chromatin | 94 | 23% | 11 | 20% | 83 | 24% | 0.7588 | 1 | 0.3640 | 0.6587 |
| ERCC2 | DNA repair | 41 | 10% | 3 | 6% | 38 | 11% | 0.9354 | 1 | 0.1695 | 0.5482 |
| CDKN2A | cell cycle | 20 | 5% | 0 | 0% | 20 | 6% | 1 | 1 | 0.0526 | 0.3332 |
| STAG2 | chr. segregation | 52 | 13% | 11 | 20% | 41 | 12% | 0.0658 | 0.8339 | 0.9713 | 0.9988 |
| FGFR3 | RTK | 51 | 13% | 12 | 22% | 39 | 11% | 0.0247 | 0.4692 | 0.9907 | 0.9988 |
| EP300 | chromatin | 54 | 13% | 9 | 17% | 45 | 13% | 0.2819 | 1 | 0.8375 | 0.9543 |
| RXRA | transcription | 27 | 7% | 4 | 7% | 23 | 7% | 0.4997 | 1 | 0.7145 | 0.8776 |
| RHOB | migration | 18 | 4% | 2 | 4% | 16 | 5% | 0.7212 | 1 | 0.5589 | 0.8249 |
| RHOA | migration | 18 | 4% | 2 | 4% | 16 | 5% | 0.7212 | 1 | 0.5589 | 0.8249 |
| TYRO3 | RTK | 14 | 3% | 1 | 2% | 13 | 4% | 0.8705 | 1 | 0.4199 | 0.7253 |
| MLL2 | chromatin | 70 | 17% | 3 | 6% | 67 | 19% | 0.9999 | 1 | 0.00704 | 0.13369 |
| KRAS | RAS | 14 | 3% | 2 | 4% | 12 | 3% | 0.5801 | 1 | 0.7159 | 0.8776 |
| ERBB3 | RTK | 43 | 11% | 2 | 4% | 41 | 12% | 0.9877 | 1 | 0.0514 | 0.3332 |
| TGFBR1 | RTK | 12 | 3% | 0 | 0% | 12 | 3% | 1 | 1 | 0.1742 | 0.5482 |
| ERBB2 | RTK | 37 | 9% | 5 | 9% | 32 | 9% | 0.5695 | 1 | 0.6284 | 0.8776 |
| KLF5 | transcription | 19 | 5% | 1 | 2% | 18 | 5% | 0.9388 | 1 | 0.2503 | 0.5945 |
| FAM47C | other | 15 | 4% | 2 | 4% | 13 | 4% | 0.6196 | 1 | 0.6764 | 0.8776 |
| BRWD1 | chromatin | 18 | 4% | 1 | 2% | 17 | 5% | 0.9289 | 1 | 0.2788 | 0.6233 |
| ERBB4 | RTK | 25 | 6% | 1 | 2% | 24 | 7% | 0.9754 | 1 | 0.1262 | 0.5330 |
| IRS4 | RTK | 8 | 2% | 0 | 0% | 8 | 2% | 1 | 1 | 0.3139 | 0.6532 |
| TXNIP | ROS regulation | 16 | 4% | 1 | 2% | 15 | 4% | 0.9039 | 1 | 0.3438 | 0.6532 |
| TSC1 | PI3K-mTOR | 25 | 6% | 3 | 6% | 22 | 6% | 0.6760 | 1 | 0.5644 | 0.8249 |
| NFE2L2 | transcription | 17 | 4% | 0 | 0% | 17 | 5% | 1 | 1 | 0.0827 | 0.4246 |
| CHIT1 | other | 11 | 3% | 0 | 0% | 11 | 3% | 1 | 1 | 0.2020 | 0.5482 |
| C3orf70 | other | 13 | 3% | 0 | 0% | 13 | 4% | 1 | 1 | 0.1502 | 0.5482 |
| MBD1 | chromatin | 11 | 3% | 0 | 0% | 11 | 3% | 1 | 1 | 0.2020 | 0.5482 |
| RAS* | RAS | 40 | 10% | 7 | 13% | 33 | 9% | 0.2753 | 1 | 0.8539 | 0.9543 |
| RHO* | migration | 36 | 9% | 4 | 7% | 32 | 9% | 0.7396 | 1 | 0.4572 | 0.7554 |
| Genes subject to focal copy number change | |||
|---|---|---|---|
| Gene symbol | Category | Total # focal CN change | % samples with focal CN change |
| ARID1A | chromatin | 12 | 5 |
| BCL2L1 | apoptosis | 24 | 10 |
| BEND3 | chromatin | 8 | 3 |
| BIRC3 | apoptosis | 10 | 4 |
| CCND1 | cell cycle | 26 | 11 |
| CCNE1 | cell cycle | 22 | 9 |
| CDKN2A | cell cycle | 100 | 43 |
| CREBBP | chromatin | 38 | 16 |
| E2F3 | Elongation factor | 43 | 18 |
| EGFR | RTK | 17 | 7 |
| ERBB2 | RTK | 12 | 5 |
| CCSER1 | mitosis | 36 | 15 |
| FGFR3 | RTK | 10 | 4 |
| FHIT | Fragile site | 30 | 13 |
| FOXQ1 | transcription | 25 | 11 |
| GDI2 | migration | 20 | 9 |
| IKZF2 | transcription | 35 | 15 |
| LRP1B | migration | 39 | 17 |
| MDM2 | cell cycle | 21 | 9 |
| MYC | transcription | 31 | 13 |
| MYCL | transcription | 13 | 6 |
| NCOR1 | chromatin | 57 | 24 |
| PDE4D | cAMP | 52 | 22 |
| PPARG | transcription | 34 | 14 |
| PRKCI | protein kinase C, | 9 | 4 |
| PTEN | PI3K-MTOR | 30 | 13 |
| Matrix | |||
| PVRL4 | interactions | 40 | 17 |
| RB1 | cell cycle | 39 | 17 |
| SOX4 | transcription | 42 | 18 |
| WWOX | other | 35 | 15 |
| YWHAZ | 14-3-3-zeta | 51 | 22 |
| ZNF703 | transcription | 24 | 10 |
Top: Genes identified as being significantly mutated or subject to focal copy number change in bladder cancer. Genes identified as significantly mutated in bladder cancer (Mutsig 2CV (20)) from analysis of 404 bladder cancers (350 invasive and 54 non-muscle invasive), as described in the Fig. 1 legend and text. The different colors in the “Category” column for genes identified as being significantly mutated indicate the different functional categories of genes with mutations. The green color in the other columns highlights those p values that are nominally significant (p < 0.05), and those q values that are significant (q < 0.2).
Bottom: Genes identified as involved in copy number change, either amplification or deletion, as identified by GISTIC2.0 (21). The red color in the “Gene symbol” column for genes subject to copy number change denotes amplification; blue denotes deletion. Again, the different colors in the “Category” column highlight the different functional categories of genes with mutations.
The asterisk denotes union of mutations of the types indicated:
RAS means KRAS or HRAS
RHO means RHOA or RHOB
Abbreviations: chr. segregation, chromosome segregation; RTK, receptor tyrosine kinase.
The combination of both NMIBC and invasive bladder cancers in this analysis enabled assessment of differences in mutation rate between the two (Table 1). MLL2 mutation was seen at a much higher rate in invasive bladder cancer (19% vs. 6% in NMIBC, p=0.007, q=0.13), as was TP53 mutation (47% in invasive vs. 22% in NMIBC, p=0.0004, q=0.016). Mutations in KDM6A were seen more commonly in NMIBC (43% vs. 23% in invasive bladder cancer, p=0.0032, q=0.12). Many previous studies have investigated differences in mutation frequency between NMIBC and invasive bladder cancer (1). In past studies, FGFR3 mutation was much more common in low grade NMIBC than in invasive cancer (~70% vs. ~12%), while TP53 mutation was much more common in invasive cancer than low grade NMIBC (~40% vs. ~7%) (1). A recent small series identified a higher rate of mutations in KDM6A in NMIBC (65% in 30 NMIBC vs. 33% in 18 MIBC), concordant with our findings, as well as a higher rate of mutations in TP53 in MIBC (56% of 18) vs. NMIBC (5% of 20) (19). (These data were not included in our pooled analysis due to lack of availability of the primary data.) Our observations based on these pooled genome-wide studies support mutation in TP53 as being a key factor differentiating invasive bladder cancer from non-invasive disease. However, differences in FGFR3 mutation were not seen. The observed differences in MLL2 and KDM6A mutation rates between the two stage groups of bladder cancer are relatively novel. They suggest that different chromatin gene mutations contribute to the two different stage groups. However, these observations may be due in part to differences in the histologic characteristics of the NMIBC, or in the patient populations pooled for this analysis, or technical factors in the NGS analysis, and further study is required.
Amplification, Deletion, and Other Genomic Events in Bladder Cancer
Many comprehensive studies have identified numerous genomic amplification and deletion events occurring in bladder cancer (1,9). These findings were confirmed and extended in the recent TCGA analysis based upon Affymetrix SNP profiling and low-pass whole genome sequencing, both analyzed by GISTIC (21). Thirteen genes were targets of focal deletion and 19 were targets of focal amplification (Table 1). The majority of those genes fall into the same categories as those for which mutations are seen, including cell cycle, chromatin regulation, receptor tyrosine kinase signaling, and transcription.
In TCGA data set, 3 (2%) invasive bladder cancers contained FGFR3-TACC3 fusion sequences (11), a chromosomal translocation identified previously in bladder cancer (22). These fusion proteins are highly transforming. They have now been seen in multiple cancer types, and cancers bearing them may be especially sensitive to FGFR3 inhibitors. Four (3%) cancers had fusions involving ERBB2 and various other genomic regions, of uncertain functional significance (11).
Subsets of Bladder Cancer Based upon Expression Profiling
Several recent studies have performed comprehensive gene expression profiling analysis of high grade or muscle invasive bladder cancer and used unsupervised hierarchical clustering to define expression pattern subtypes (10,23–26). Although the findings from those analyses have not been completely uniform, there is considerable similarity. The Sjodahl report (2012) identified 5 expression subtypes, Urobasal A and B, genomically unstable, squamous cell carcinoma-like (SCC-like), and infiltrated (referring to the presence of non-tumor cells) (26). A subtype termed basal was identified by all of the other studies (10,24,25), and is characterized by expression of keratins KRT5, KRT14, and KRT6A/B/C, as well as HES2 and MYC, indicative of a basal or stem cell phenotype, and is similar to the SCC-like subtype of Sjodahl. The three later studies also identified a ‘Luminal’ expression subtype, so-called because of its similarity to breast cancer luminal subtypes, characterized by high expression of FGFR3, the uroplakin genes, KRT20, and transcription factors PPARG, GATA3, FOXA1, and RXRA. The Luminal subtype was similar to the Urobasal A subtype in the Sjodahl study. Another subtype, p53-like was also identified in one of these studies (24). All of these analyses for which prognostic information was available showed the basal subtype to be associated with poorer prognosis, and the luminal subtype to be associated with more favorable prognosis (23–26).
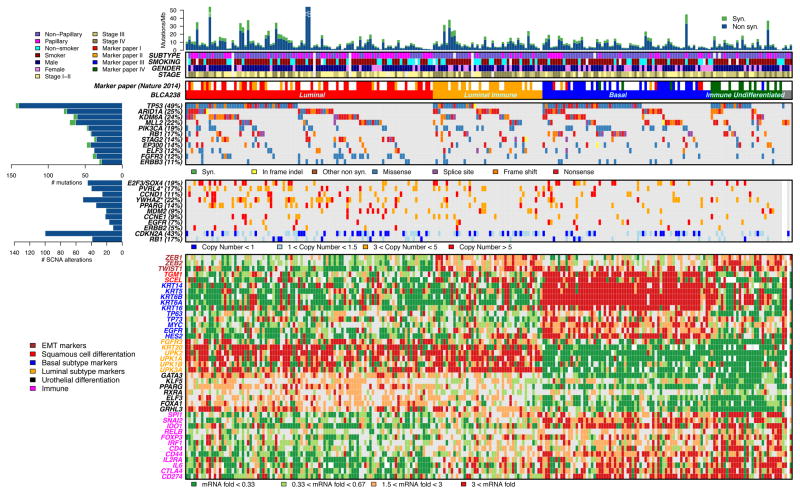
To examine patterns of expression in invasive bladder cancer in greater detail, we performed unsupervised hierarchical clustering (27) on 238 TCGA bladder cancers for which both RNA-Seq and whole exome sequencing mutational analysis had been performed (Fig. 3). That analysis gave results similar to those published on the 131 samples (10) (Rand index = 0.82), and identified 4 different subtypes, splitting the luminal and basal subtypes into two further subtypes each. 41% of the invasive cancers were in the Luminal subtype (red, Fig. 3) with high expression of KRT20 and UPKs 2/1A/1B/3A, as well as moderate to high expression of multiple pertinent transcription factors (KLF5, PPARG, GRHL5). The Luminal subtype was enriched in male patients, papillary histology, and Stage II tumors, and is similar to the previously identified luminal (10,24,25) and urobasal A (26) subtypes. 29% of the invasive bladder cancers were in the Basal subtype (blue, Fig. 3) with high expression of KRT14, KRT5, KRT6A/B, and KRT16, and low expression of all uroplakins, consistent with a basal or undifferentiated cytokeratin expression pattern. Consistent with previous studies, the basal subtype expressed TP63, TP73, MYC, and EGFR, as well as TGM1 and SCEL, indicative of some degree of squamous differentiation (10,24–26). The Basal subtype was enriched in female patients and non-papillary histology, and also expressed many immune genes at intermediate and somewhat variable levels, including CTLA4 and CD274 (encodes PD-L1), suggestive of immune cell infiltration. 11% of the cancers grouped into a novel subtype that we term Immune Undifferentiated (green, Fig. 3). Those cancers showed very low expression of luminal markers, with variable expression of basal cytokeratins, and relatively high level expression of many immune genes, including CTLA4 and CD274, suggesting significant immune cell infiltration and possible immune evasion (see further below). Last, the Luminal Immune subtype (18%) (orange, Fig. 3) was characterized by expression of Luminal genes (cytokeratins and uroplakins), and intermediate expression of immune genes, and was enriched for Stage N+ tumors. The Luminal subtype was enriched in cancers with mutations in FGFR3, and amplification events involving PVRL4 and YWHAZ, whereas the Basal subtype was enriched in mutations in NFE2L2 (all with p < 0.02 and q < 0.2) (Fig. 3). Furthermore, both Luminal Immune and Immune Undifferentiated subtypes had a high level of expression of ZEB1, ZEB2, and TWIST1 characteristic of epithelial-to-mesenchymal transition (EMT).
Figure 3. Expression clustering identifies four different types of bladder cancer. Unsupervised hierarchical clustering (27) was performed on 238 TCGA bladder cancers using RNA-Seq RSEM expression values for the 3,000 most variable genes. Mutation and copy number change data were also available for the 238 samples.
A. Mutation rate and type, histological subtype, smoking status, gender, and tumor stage are shown.
Four clusters were identified, red (Luminal), orange (Luminal Immune), blue (Basal), and green (Immune Undifferentiated). Four samples without complete data were not included in the clustering and are shown in gray (right).
B. Genes with statistically significant levels of mutation, as identified in Figure 3, and mutation rates > 10% are shown, with mutation types.
C. Genomic regions with statistically significant focal copy number changes (GISTIC2.0) (21) are shown; limited to deletions seen in > 15% of samples, and amplifications seen in ≥ 5% of samples. ‘Copy number’ refers to absolute copy number. The asterisk indicates that the gene listed is one among many within an amplification peak.
D. RNA expression levels for selected genes, chosen to reflect luminal vs. basal differentiation, and for roles in the immune system, are expressed as fold change from the median value for all samples. Gene fonts are color-coded to indicate gene class, and correlate with expression subtypes.
Note that bar plots at the top are truncated for a few cancers.
EMT, epithelial-to-mesenchymal transition; SCN, somatic copy number alterations.
Therapeutic Targets in Invasive Bladder Cancer
Those observations, along with continuing drug development by pharma, has led to a large number of potential therapeutic opportunities for invasive bladder cancer.
First, the high frequency of mutations and genomic deletions affecting chromatin regulatory genes in bladder cancer, higher than in any other epithelial malignancy (11), suggests that therapies targeted at the effects of those mutations could be useful. Mocetinostat, an oral second-generation HDAC inhibitor, is currently being assessed in a clinical trial for invasive bladder cancers with mutations in either EP300 or CREBBP (28). Further pharmaceutical development of agents that target those mutations is needed and is actively being pursued.
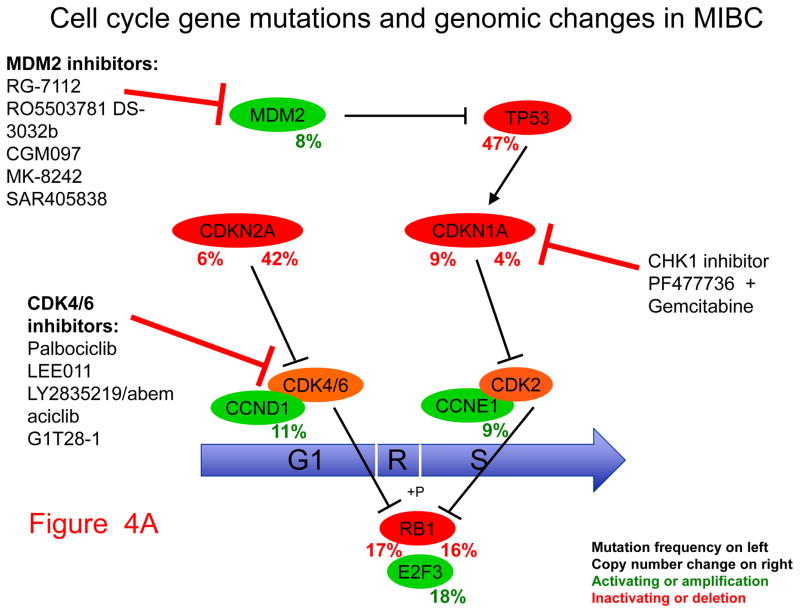
Second, mutations and genomic deletion or amplification events that affect the cell cycle are very common in bladder cancer. Those include alterations of TP53 and the cyclin-dependent kinase inhibitors CDKN1A and CDKN2A (Fig. 4A). Both CDNK2A loss and amplification of cyclin D1 (gene symbol CCND1) can be targeted by agents in development that are CDK4/6 inhibitors, including palbociclib (29). MDM2, amplified in 8% of invasive bladder cancer, is also a therapeutic target of several drugs in development. CDKN1A mutation, although extremely rare in other cancer types, is seen in 14% invasive bladder cancer, and occurs with concurrent TP53 mutation about half the time (30). Concurrent loss of CDKN1A and TP53 has been shown in cell line and mouse xenograft models to lead to marked sensitivity to combined treatment with gemcitabine and a CHK1 inhibitor, such as PF477736, suggesting potential clinical utility (30).
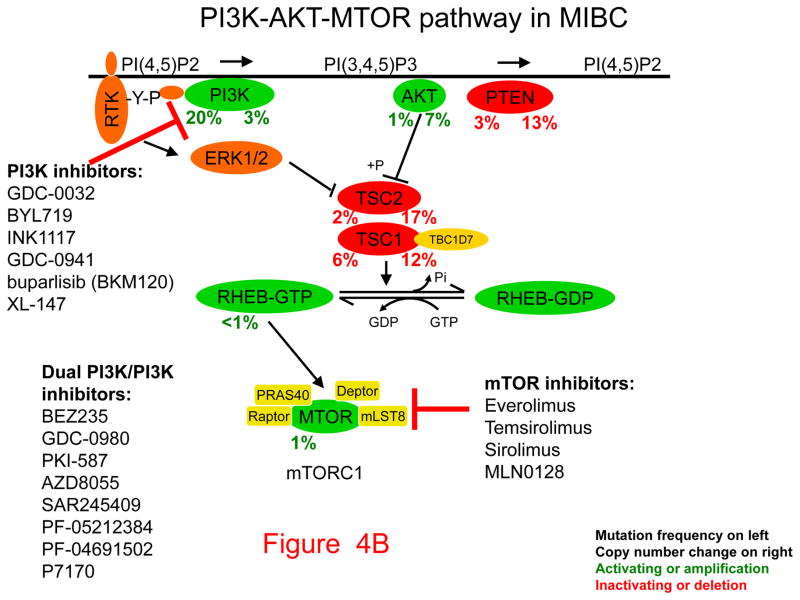
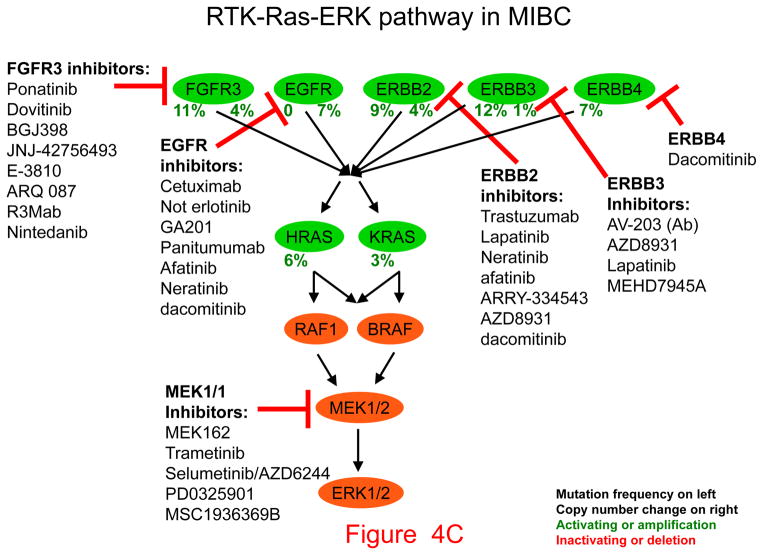
Figure 4. Pathways, potential therapeutic targets, and possible inhibitors for invasive bladder cancer.
Genes that drive growth or cancer progression are shown in green. Genes that are tumor suppressors and act to prevent growth or progression are shown in red. Beneath each gene symbol, the number on the left indicates the frequency of inactivating (red) or activating (green) mutation, the number on the right indicates the frequency of copy number loss (red) or amplification (green). Classes of inhibitors and their targets are shown with blunt arrows indicating the components they inhibit.
A. Cell cycle. B. PI3K-AKT-mTOR pathway. C. RTK-RAS-ERK pathway (asterisk indicates not erlotinib).
Third, the PI3K-AKT-mTOR pathway is commonly subject to mutation in invasive bladder cancer (Fig. 4B). Multiple agents are in clinical development to target PI3-kinase (gene name PIK3CA), one of the genes most commonly mutated in bladder cancer. Though less common than PIK3CA mutations, mutations in TSC1 are well-known in bladder cancer (5), and they have been shown in at least some cases to lead to dramatic sensitivity to treatment with mTOR kinase inhibitors, such as everolimus (31). Further studies are underway to define the precise clinical and genetic characteristics of response to mTOR inhibition in bladder cancer.
Fourth, the extent of involvement of the receptor tyrosine kinase-RAS-ERK signaling pathway involvement in invasive bladder cancer has recently become much more evident (Fig. 4C). Both FGFR3 and all the members of the ERBB family are affected by either activating mutations or amplification events (Fig. 4C). Drugs that target those genetic abnormalities are at various stages of clinical development, and arguably, FGFR3-activating mutations and gene fusions are the most promising targets among those genes. Clinical trials of FGFR3 kinase inhibitors against bladder and other cancers are ongoing (32).
Last, immune therapy has shown considerable promise for invasive bladder cancer. A recent report indicated that one immunomodulatory treatment approach, use of the humanized anti-PD-L1 monoclonal antibody MPDL3280A, had significant activity in bladder cancer (33). Of those patients whose bladder tumors contained high amounts of tumor-infiltrating cells expressing PD-L1 as assessed by immunohistochemistry, 13 of 25 (52%) demonstrated an objective response by 12 weeks on therapy, and the response was ongoing (33). These results build upon a large and growing body of evidence that immune evasion through cancer-induced immunosuppression, often through activation of immune checkpoints, is an important factor in cancer progression (34). For example, both cytotoxic T-lymphocyte associated antigen-4 (CTLA4) and programmed death-1 (PD-1) receptor expressed by T cells can be engaged by corresponding receptor molecules on cancer cells (e.g. PD-L1) or other immune cells, to block lymphocyte activity directed at cancer cells (34). Hence antibodies that block such interaction, directed at either of the interacting molecules, can interfere with cancer checkpoint blockade, leading to native immune cell attack on the cancer, and therefore, to clinical response. The relatively high level of immune gene expression by some bladder cancers, including CTLA4 and CD274 (encoding PD-L1) (Fig. 3) is consistent with the hypothesis that a subset of bladder cancers are characterized by immune suppression, and will be sensitive to immune modulatory therapy. Clinical trials of multiple immune therapy agents are in progress for bladder cancer (2,28). Based upon our current analyses, it appears that the Immune Undifferentiated and Basal subtypes of bladder cancer will be the most promising subtypes for immune checkpoint therapy (Fig. 3). However, further analysis is urgently needed so that these therapies can be applied with the most precision and effectiveness in bladder cancer.
Conclusions
Invasive bladder cancer is characterized by a high overall mutation rate, which appears to be explained mainly by APOBEC-mediated mutagenesis. Both well-known and relatively novel cancer genes are commonly affected in invasive bladder cancer by mutation, genomic amplification/deletion, or both. Genes affected include those involved in transcription, chromatin regulation, receptor tyrosine kinase signaling, PI3K-mTOR signaling, RAS, and the cell cycle. Expression profiling studies are consistent in the identification of two main subtypes of bladder cancer, broadly definable as basal and luminal. Basal tumors are less differentiated, more aggressive, and more lethal; luminal tumors are more differentiated and show higher expression levels of uroplakins and FGFR3. Expression clustering reveals additional subtypes within the two main groups, and, quite significantly, the subtypes differ in immune gene expression and EMT marker expression.
The future is looking bright for therapeutic advances in bladder cancer. There are many promising targets and drugs in development that should be deployed in mutation- and expression-specific fashions, as per the “precision medicine” paradigm. Promising therapeutic agents directed against the cell cycle, receptor tyrosine kinase pathway, and PI3K-mTOR pathway mutations are in hand. Mutations in chromatin regulatory genes are promising targets for which further pharmaceutical development will be required. Immune checkpoint agents, already in the clinic, also show promise, and the expression/mutational subtypes defined above may aid both our pre-clinical and clinical progress with them.
Acknowledgments
Grant Support
R. Akbani and J.N. Weinstein are supported by the NCI of the NIH under award numbers CA143883 and P30CA016672, the NIH under CPRIT RP130397, the Mary K. Chapman Foundation, and the Michael & Susan Dell Foundation. C.J. Creighton is supported by the NCI of the NIH under award numbers P30CA125123 and U24CA143843. D.J. Kwiatkowski is supported by the NCI of the NIH under award number P01CA120964.
Footnotes
Disclosure of Potential Conflicts of Interest
Seth P. Lerner reports receiving commercial research grants from Endo Pharmaceuticals and FKD Therapies, and is a consultant/advisory board member for BioCancell, Dendreon (uncompensated), Genentech, and OncoGenex Pharmaceuticals. No potential conflicts of interest were disclosed by the other authors.
References
- 1.Knowles MA, Hurst CD. Molecular biology of bladder cancer: new insights into pathogenesis and clinical diversity. Nat Rev Cancer. 2015;15:25–41. doi: 10.1038/nrc3817. [DOI] [PubMed] [Google Scholar]
- 2.Carballido EM, Rosenberg JE. Optimal treatment for metastatic bladder cancer. Curr Oncol Rep. 2014;16:404. doi: 10.1007/s11912-014-0404-2. [DOI] [PubMed] [Google Scholar]
- 3.Esrig D, Spruck CH, 3rd, Nichols PW, Chaiwun B, Steven K, Groshen S, et al. p53 nuclear protein accumulation correlates with mutations in the p53 gene, tumor grade, and stage in bladder cancer. Am J Pathol. 1993;143:1389–97. [PMC free article] [PubMed] [Google Scholar]
- 4.Cote RJ, Dunn MD, Chatterjee SJ, Stein JP, Shi SR, Tran QC, et al. Elevated and absent pRb expression is associated with bladder cancer progression and has cooperative effects with p53. Cancer Res. 1998;58:1090–4. [PubMed] [Google Scholar]
- 5.Hornigold N, Devlin J, Davies AM, Aveyard JS, Habuchi T, Knowles MA. Mutation of the 9q34 gene TSC1 in sporadic bladder cancer. Oncogene. 1999;18:2657–61. doi: 10.1038/sj.onc.1202854. [DOI] [PubMed] [Google Scholar]
- 6.Cappellen D, De Oliveira C, Ricol D, de Medina S, Bourdin J, Sastre-Garau X, et al. Frequent activating mutations of FGFR3 in human bladder and cervix carcinomas. Nat Genet. 1999;23:18–20. doi: 10.1038/12615. [DOI] [PubMed] [Google Scholar]
- 7.Lopez-Knowles E, Hernandez S, Malats N, Kogevinas M, Lloreta J, Carrato A, et al. PIK3CA mutations are an early genetic alteration associated with FGFR3 mutations in superficial papillary bladder tumors. Cancer Res. 2006;66:7401–4. doi: 10.1158/0008-5472.CAN-06-1182. [DOI] [PubMed] [Google Scholar]
- 8.Platt FM, Hurst CD, Taylor CF, Gregory WM, Harnden P, Knowles MA. Spectrum of phosphatidylinositol 3-kinase pathway gene alterations in bladder cancer. Clin Cancer Res. 2009;15:6008–17. doi: 10.1158/1078-0432.CCR-09-0898. [DOI] [PubMed] [Google Scholar]
- 9.Goebell PJ, Knowles MA. Bladder cancer or bladder cancers? Genetically distinct malignant conditions of the urothelium. Urol Oncol. 2010;28:409–28. doi: 10.1016/j.urolonc.2010.04.003. [DOI] [PubMed] [Google Scholar]
- 10.Cancer Genome Atlas Research N. Comprehensive molecular characterization of urothelial bladder carcinoma. Nature. 2014;507:315–22. doi: 10.1038/nature12965. [DOI] [PMC free article] [PubMed] [Google Scholar]
- 11.Guo G, Sun X, Chen C, Wu S, Huang P, Li Z, et al. Whole-genome and whole-exome sequencing of bladder cancer identifies frequent alterations in genes involved in sister chromatid cohesion and segregation. Nat Genet. 2013;45:1459–63. doi: 10.1038/ng.2798. [DOI] [PMC free article] [PubMed] [Google Scholar]
- 12.Balbas-Martinez C, Sagrera A, Carrillo-de-Santa-Pau E, Earl J, Marquez M, Vazquez M, et al. Recurrent inactivation of STAG2 in bladder cancer is not associated with aneuploidy. Nat Genet. 2013;45:1464–9. doi: 10.1038/ng.2799. [DOI] [PMC free article] [PubMed] [Google Scholar]
- 13.Van Allen EM, Mouw KW, Kim P, Iyer G, Wagle N, Al-Ahmadie H, et al. Somatic ERCC2 mutations correlate with cisplatin sensitivity in muscle-invasive urothelial carcinoma. Cancer Discov. 2014;4:1140–53. doi: 10.1158/2159-8290.CD-14-0623. [DOI] [PMC free article] [PubMed] [Google Scholar]
- 14.Lawrence MS, Stojanov P, Polak P, Kryukov GV, Cibulskis K, Sivachenko A, et al. Mutational heterogeneity in cancer and the search for new cancer-associated genes. Nature. 2013;499:214–8. doi: 10.1038/nature12213. [DOI] [PMC free article] [PubMed] [Google Scholar]
- 15.Nik-Zainal S, Alexandrov LB, Wedge DC, Van Loo P, Greenman CD, Raine K, et al. Mutational processes molding the genomes of 21 breast cancers. Cell. 2012;149:979–93. doi: 10.1016/j.cell.2012.04.024. [DOI] [PMC free article] [PubMed] [Google Scholar]
- 16.Roberts SA, Sterling J, Thompson C, Harris S, Mav D, Shah R, et al. Clustered mutations in yeast and in human cancers can arise from damaged long single-strand DNA regions. Mol Cell. 2012;46:424–35. doi: 10.1016/j.molcel.2012.03.030. [DOI] [PMC free article] [PubMed] [Google Scholar]
- 17.Tan VY, Fevotte C. Automatic relevance determination in nonnegative matrix factorization with the beta-divergence. IEEE Trans Pattern Anal Mach Intell. 2013;35:1592–605. doi: 10.1109/TPAMI.2012.240. [DOI] [PubMed] [Google Scholar]
- 18.Roberts SA, Gordenin DA. Hypermutation in human cancer genomes: footprints and mechanisms. Nat Rev Cancer. 2014;14:786–800. doi: 10.1038/nrc3816. [DOI] [PMC free article] [PubMed] [Google Scholar]
- 19.Konsavage WM, Jr, Kyler SL, Rennoll SA, Jin G, Yochum GS. Wnt/beta-catenin signaling regulates Yes-associated protein (YAP) gene expression in colorectal carcinoma cells. J Biol Chem. 2012;287:11730–9. doi: 10.1074/jbc.M111.327767. [DOI] [PMC free article] [PubMed] [Google Scholar]
- 20.Lawrence MS, Stojanov P, Mermel CH, Robinson JT, Garraway LA, Golub TR, et al. Discovery and saturation analysis of cancer genes across 21 tumour types. Nature. 2014;505:495–501. doi: 10.1038/nature12912. [DOI] [PMC free article] [PubMed] [Google Scholar]
- 21.Zack TI, Schumacher SE, Carter SL, Cherniack AD, Saksena G, Tabak B, et al. Pan-cancer patterns of somatic copy number alteration. Nat Genet. 2013;45:1134–40. doi: 10.1038/ng.2760. [DOI] [PMC free article] [PubMed] [Google Scholar]
- 22.Williams SV, Hurst CD, Knowles MA. Oncogenic FGFR3 gene fusions in bladder cancer. Hum Mol Genet. 2013;22:795–803. doi: 10.1093/hmg/dds486. [DOI] [PMC free article] [PubMed] [Google Scholar]
- 23.Volkmer JP, Sahoo D, Chin RK, Ho PL, Tang C, Kurtova AV, et al. Three differentiation states risk-stratify bladder cancer into distinct subtypes. Proc Natl Acad Sci U S A. 2012;109:2078–83. doi: 10.1073/pnas.1120605109. [DOI] [PMC free article] [PubMed] [Google Scholar]
- 24.Choi W, Porten S, Kim S, Willis D, Plimack ER, Hoffman-Censits J, et al. Identification of distinct basal and luminal subtypes of muscle-invasive bladder cancer with different sensitivities to frontline chemotherapy. Cancer Cell. 2014;25:152–65. doi: 10.1016/j.ccr.2014.01.009. [DOI] [PMC free article] [PubMed] [Google Scholar]
- 25.Damrauer JS, Hoadley KA, Chism DD, Fan C, Tiganelli CJ, Wobker SE, et al. Intrinsic subtypes of high-grade bladder cancer reflect the hallmarks of breast cancer biology. Proc Natl Acad Sci U S A. 2014;111:3110–5. doi: 10.1073/pnas.1318376111. [DOI] [PMC free article] [PubMed] [Google Scholar]
- 26.Sjodahl G, Lauss M, Lovgren K, Chebil G, Gudjonsson S, Veerla S, et al. A molecular taxonomy for urothelial carcinoma. Clin Cancer Res. 2012;18:3377–86. doi: 10.1158/1078-0432.CCR-12-0077-T. [DOI] [PubMed] [Google Scholar]
- 27.Wilkerson MD, Hayes DN. ConsensusClusterPlus: a class discovery tool with confidence assessments and item tracking. Bioinformatics. 2010;26:1572–3. doi: 10.1093/bioinformatics/btq170. [DOI] [PMC free article] [PubMed] [Google Scholar]
- 28.Sonpavde G, Jones BS, Bellmunt J, Choueiri TK, Sternberg CN. Future directions and targeted therapies in bladder cancer. Hematol Oncol Clin North Amer. 2015;29:361–76. doi: 10.1016/j.hoc.2014.10.008. [DOI] [PubMed] [Google Scholar]
- 29.Rocca A, Farolfi A, Bravaccini S, Schirone A, Amadori D. Palbociclib (PD 0332991): targeting the cell cycle machinery in breast cancer. Expert Opin Pharmacother. 2014;15:407–20. doi: 10.1517/14656566.2014.870555. [DOI] [PubMed] [Google Scholar]
- 30.Liu Y, Kwiatkowski DJ. Combined CDKN1A/TP53 mutation in bladder cancer is a therapeutic target. Mol Cancer Ther. 2015;14:174–82. doi: 10.1158/1535-7163.MCT-14-0622-T. [DOI] [PMC free article] [PubMed] [Google Scholar]
- 31.Iyer G, Hanrahan AJ, Milowsky MI, Al-Ahmadie H, Scott SN, Janakiraman M, et al. Genome sequencing identifies a basis for everolimus sensitivity. Science. 2012;338:221. doi: 10.1126/science.1226344. [DOI] [PMC free article] [PubMed] [Google Scholar]
- 32.Mazzola CR, Siddiqui KM, Billia M, Chin J. Dovitinib: rationale, preclinical and early clinical data in urothelial carcinoma of the bladder. Expert Opin Investig Drugs. 2014;23:1553–62. doi: 10.1517/13543784.2014.966900. [DOI] [PubMed] [Google Scholar]
- 33.Powles T, Eder JP, Fine GD, Braiteh FS, Loriot Y, Cruz C, et al. MPDL3280A (anti-PD-L1) treatment leads to clinical activity in metastatic bladder cancer. Nature. 2014;515:558–62. doi: 10.1038/nature13904. [DOI] [PubMed] [Google Scholar]
- 34.Drake CG, Lipson EJ, Brahmer JR. Breathing new life into immunotherapy: review of melanoma, lung and kidney cancer. Nat Rev Clin Oncol. 2014;11:24–37. doi: 10.1038/nrclinonc.2013.208. [DOI] [PMC free article] [PubMed] [Google Scholar]


