Abstract

Although models based on the Poisson–Boltzmann (PB) equation have been fairly successful at predicting some experimental quantities, such as solvation free energies (ΔG), these models have not been consistently successful at predicting binding free energies (ΔΔG). Here we found that ranking a set of protein–protein complexes by the electrostatic component (ΔΔGel) of ΔΔG was more difficult than ranking the same molecules by the electrostatic component (ΔGel) of ΔG. This finding was unexpected because ΔΔGel can be calculated by combining estimates of ΔGel for the complex and its components with estimates of the ΔΔGel in vacuum. One might therefore expect that if a theory gave reliable estimates of ΔGel, then its estimates of ΔΔGel would be reliable. However, ΔΔGel for these complexes were orders of magnitude smaller than ΔGel, so although estimates of ΔGel obtained with different force fields and surface definitions were highly correlated, similar estimates of ΔΔGel were often not correlated.
Introduction
Classical molecular dynamics (MD) methods1,2 have been fairly successful at predicting a wide variety of biophysical quantities, including solvation free energies (ΔG),3−5 but computing binding free energies (ΔΔG) with such methods is computationally expensive. Implicit solvent models, such as the Poisson–Boltzmann (PB) equation (PBE),6−10 that average over the degrees of freedom of the solvent have therefore been developed to predict these quantities more quickly. The basic strategy of PB methods is to model the effects of the solvating waters by treating the molecule as a set of point charges in a low-dielectric region with a surrounding high-dielectric medium and to replace the surrounding ions with a continuous charge distribution outside the molecule that changes self-consistently in response to the electric field generated by the fixed charges in the molecule. These models have been fairly successful at predicting many biophysical quantities, including ΔG of small molecules3,5,11−15 and the salt dependences of ΔΔG.16−22
If estimates of ΔΔG could be obtained quickly from implicit solvent models, drug development and discovery could be accelerated. However, although implicit solvent models, including PB methods, have been successful at predicting ΔG,3,5,11−15 they have been less successful at predicting ΔΔG.23−30 At first glance, this statement appears to be self-contradictory because the electrostatic component (ΔΔGel) of ΔΔG can be computed from
| 1 |
where ΔGelcomp is the electrostatic component (ΔGel) of ΔG of the complex, ΔGel and ΔGel2 are the ΔGel of the two components of the complex, and ΔΔGel is the electrostatic binding free energy of the complex in vacuum. One might therefore initially think that if implicit solvent models can accurately rank molecules by ΔG, then they should be able to similarly rank complexes by ΔΔG, but, as shown in the Results, this assumption is not necessarily true.
One potential explanation of this apparent contradiction is explored in the present work. In this study, ΔGel was orders of magnitude larger than ΔΔGel. Therefore, estimates of ΔGel with small relative errors combined to yield estimates of ΔΔGel that contained large relative errors. All of the methods examined led to estimates of ΔGel that were highly correlated with each other, but the individual estimates of ΔGel could differ by hundreds of kJ/mol. These differences did not affect the rankings of these molecules by ΔGel because ΔGel covered a range of tens of thousands of kJ/mol, but the rankings by ΔΔGel were affected because ΔΔGel only covered a range of hundreds of kJ/mol.
One possible source of these errors is uncertainty in the force field used to specify the atomic charges and radii. These parameters were taken from the AMBER 9431 and CHARMM 2732 force fields, which were both created for classical MD simulations. Partly because these force fields were not designed specifically for implicit solvent models, using them could introduce errors into the calculations.33−35 The choice of force field led to large absolute changes in ΔGel (ranging from 39–2640 kJ/mol), but these changes did not lead to significant changes in the rankings of the molecules by ΔGel because of the large range of ΔGel. The rankings of complexes by ΔΔGel were also not strongly affected by the choice of force field, but the large absolute errors in these free energies (ranging from 0.3–112 kJ/mol) could cause problems for applications, such as drug development, where complexes may differ in ΔΔGel on the order of 1 kJ/mol.
Another potential source of error is the method chosen to define the boundary between the molecular interior and exterior. Several surface definitions have been used in implicit solvent models. The most common choice is the solvent-excluded (SE) surface,36,37 but other surfaces are advocated by some researchers, including the van der Waals (vdW) surface,38−40 Gaussian surfaces,41,42 and self-consistent surfaces.43−47 No consensus has yet emerged about which of these surfaces is most realistic or best matches experimental data. For the complexes in the present study, although the SE surface produced predictions of ΔGel that were highly correlated with those given by the vdW surface, the predictions of ΔΔGel by these two surfaces were not strongly correlated. To further explore the uncertainties in these free energies generated by the uncertainties in the surface definition, we used a modified version of the vdW surface48 (mvdW) to examine how these free energies changed as the definition of the surface was gradually changed. As the gaps and crevices inside the vdW surface were filled in as the radius of the probe used to define the mvdW surface was increased, ΔGel increased smoothly and monotonically. These increases in ΔGel probably reflected the losses of the favorable interactions between these regions of high dielectric constant and the nearby charges. However, the dependence of ΔΔGel on probe radius was less predictable and nonmonotonic. Because ΔGel changed smoothly and monotonically with probe radius, the rankings of these complexes by ΔGel were not strongly sensitive to the choice of probe radius, but the complicated dependences of the ΔΔGel on probe radius made the rankings by ΔΔGel sensitive to the choice of probe radius.
If the results presented here are transferable to other molecular complexes, they could help explain why PB models have been less successful at ranking complexes by ΔΔG than at ranking them by ΔG. Perhaps the predictions of ΔΔG by PB methods could be improved by obtaining better force fields and by determining what surface definition best matches experimental data. However, trying to do so by comparing the predictions of ΔG given by PB methods to experimental measurements may be difficult. In addition to ΔGel and ΔΔGel, ΔG and ΔΔG contain nonelectrostatic components that are also somewhat uncertain.49−52 Therefore, most of these comparisons are performed by determining whether the predictions of the PB methods are correlated with the experimental measurements, not by comparing the absolute values of these free energies. Because the uncertainties in the force field and molecular surface definition did not significantly change the rankings of these complexes by ΔGel but did change the rankings by ΔΔGel, such experimental data would not have provided enough information to improve the predictions of ΔΔGel. Attempting to improve the predictions of ΔG given by PB models may not provide enough information to improve their predictions of ΔΔG.
Methods
We chose 14 complexes from the RCSB Protein Data Bank53 by searching for high-resolution X-ray structures of protein–protein complexes where the components of the complex had a wide variety of interfacial shapes and charges. The pdbids and chains used as the binding components were as follows: 1acb chains E and I, 1atn chains A and D, 1avx chains A and B, 1b6c chains A and B, 1beb chains A and B, 1brs chains A and D, 1buh chains A and B, 1h1v chains A and G, 1he8 chains A and B, 1kxp chains A and D, 1sbb chains A and B, 1ysl chains A and B, 2hp0 chains A and B, and 2uy1 chains A and B. The coordinates of the protein atoms in these chains were taken from the structure files. The atomic partial charges were taken from the CHARMM 2732 and AMBER 9431 force fields. The radii were taken to be half the distance to the Lennard-Jones potential energy minimum between two atoms of the type in question. These charges and radii were added to the structures with the pdb2pqr utility.54,55 All protein residues were assumed to be in their standard ionization states at pH = 7. All PB calculations were performed with the Cartesian PB (CPB) solver.56 The locations of the atoms were fixed at the coordinates given in the structure files. No attempt was made to model conformational changes. All of these calculations used an interior dielectric constant of 1, an exterior dielectric constant of 80, a temperature of 298.15 K, a 1:1 salt concentration of 0.1 M, a grid that extended 2 times the largest dimensions of the complex, a finest grid spacing of 0.02 nm, and charge-conserving boundary conditions.57
The vdW surface defines the interior of the molecule to be the interiors of the set of spheres centered at the charge sites with radii equal to the vdW radii in the force fields. The SE surface defines the exterior of the molecule as the regions that can be contained within a probe sphere that does not overlap any of the vdW spheres. We used a probe radius of 0.14 nm to define the SE surface. The mvdW surface48 is similar to the vdW surface, but any spheres that would not have solvent-accessible surface area in a SE surface with a given probe radius have their vdW radii increased by the probe radius. The internal crevices present in the vdW surface are therefore filled in as the probe radius used to define the mvdW surface is increased.
Results
Convergence with Respect to Grid Spacing
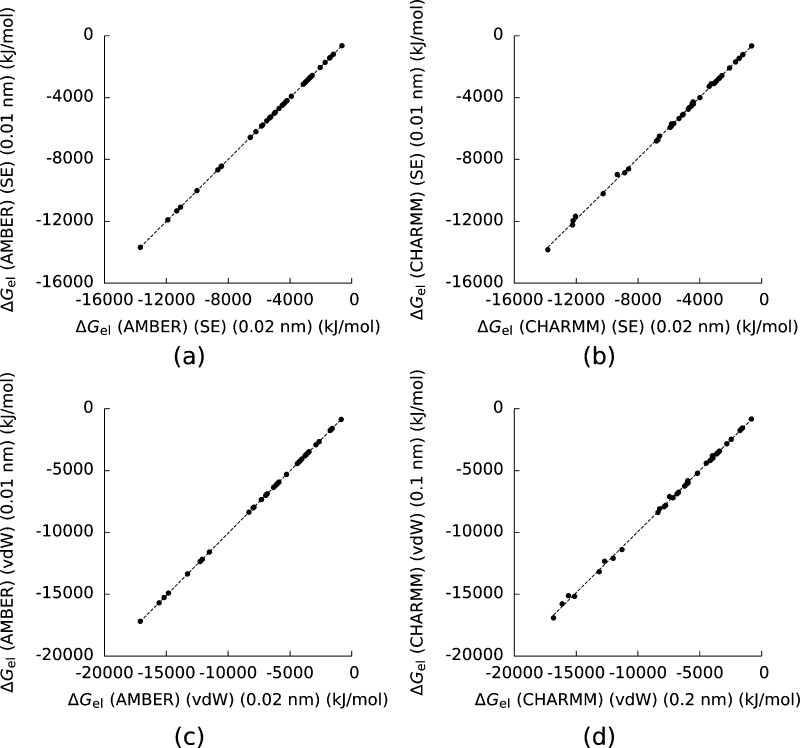
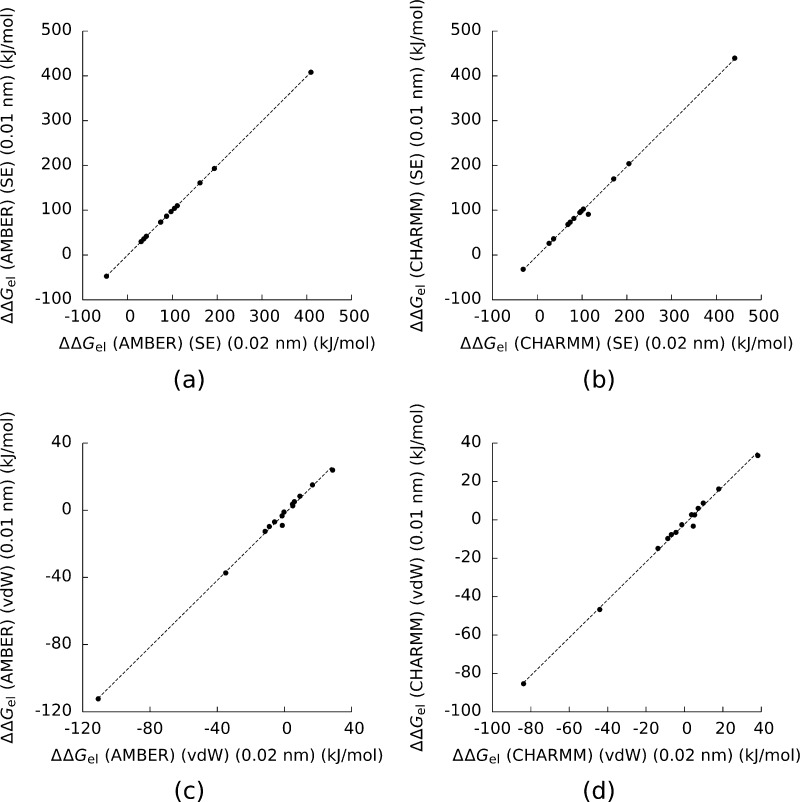
Ensuring that PB results are converged is necessary in any PB application.58,59 To this end, we recomputed ΔGel and ΔΔGel with both the AMBER and CHARMM force fields and with both the SE and vdW surfaces with a mesh spacing of 0.01 nm and compared the results to those obtained with a mesh spacing of 0.02 nm (Figure 1 and Figure 2). The results obtained at 0.01 nm were in good agreement with those we obtained with a grid spacing of 0.02 nm. For the remainder of the paper, we will only consider results obtained with a grid spacing of 0.02 nm.
Figure 1.
a) The electrostatic solvation free energy (ΔGel) for the complexes and their components computed with the AMBER force field, the solvent-excluded (SE) surface, and a mesh spacing of 0.01 nm plotted against the same numbers computed with a mesh spacing of 0.02 nm. b), c), and d) are the same figures using the CHARMM force field and the SE surface, the AMBER force field and the van der Waals (vdW) surface, and the CHARMM force field and the vdW surface. The dotted lines are least-squares fits to the data. For a) the square of the Pearson correlation coefficient (R2) is 0.99999996, for b) R2 = 0.9993, for c) R2 = 0.999997, and for d) R2 = 0.9991.
Figure 2.
a) The electrostatic binding free energy (ΔΔGel) for the complexes and their components computed with the AMBER force field, the solvent-excluded (SE) surface, and a mesh spacing of 0.01 nm plotted against the same numbers computed with a mesh spacing of 0.02 nm. b), c), and d) are the same figures using the CHARMM force field and the SE surface, the AMBER force field and the van der Waals (vdW) surface, and the CHARMM force field and the vdW surface. The dotted lines are least-squares fits to the data. For a) the square of the Pearson correlation coefficient (R2) is 0.999997, for b) R2 = 0.997, for c) R2 = 0.997, and for d) R2 = 0.996.
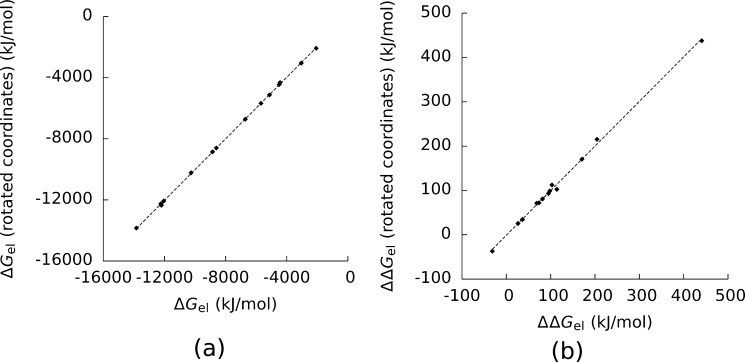
To further test that our results had reached convergence, we recomputed ΔGel and ΔΔGel with a grid spacing of 0.02 nm, the CHARMM force field, and the SE surface after rotating the coordinates of the molecules around the x-axis by 45 deg. Figure 3 shows that these new values were highly correlated with our original data. (The square of the Pearson correlation coefficient (R2) was 0.99992 for ΔGel and R2 = 0.999 for ΔΔGel.) We can therefore conclude that for those plots where R2 ≪ 1 this lack of correlation was not caused by numerical errors.
Figure 3.
a) The electrostatic solvation energy (ΔGel) for the complexes and their components computed with the CHARMM force field, the solvent-excluded surface, and coordinates rotated around the x-axis by 45 deg plotted against the same values computed with nonrotated coordinates. b) The same plot for the electrostatic binding free energy (ΔΔGel. For a) the square of the Pearson correlation coefficient (R2) was equal to 0.99992, and the square of the Spearman correlation coefficient (RS2) was equal to 0.996. For b) R2 = 0.999, and RS = 0.996.
Force Field Choice
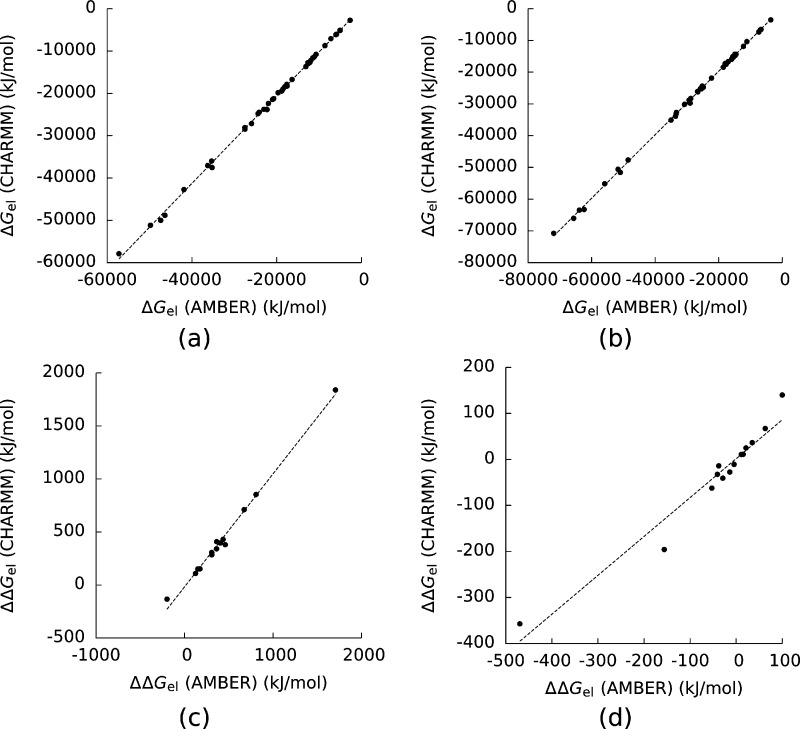
The choice of force field did not strongly affect the ordering of the molecules by ΔGel (Figure 4), as the Spearman correlation coefficients (RS2) were large. The R2 between the ΔGel computed with the AMBER force field and those computed with the CHARMM force field was greater than 0.99999 when either the vdW or SE surface was used. However, these R2 were this large partly because ΔGel covered a relatively large range, and simply using these correlation coefficients to judge the accuracy of this method would obscure some large uncertainties for individual molecules. The individual ΔGel given by the AMBER force field differed from those given by the CHARMM force field by between 39 and 2640 kJ/mol when the SE surface was used and 8 and 1180 kJ/mol when the vdW surface was used. These estimates were still accurate enough to generate large R2 because the ΔGel of these molecules covered a range of more than 50000 kJ/mol.
Figure 4.
Electrostatic solvation free energies (ΔGel) for the complexes and their components computed with the CHARMM force field plotted against those with the AMBER force field created with (a) a solvent-excluded surface and (b) a van der Waals surface. (c) and (d) show the same plots for the electrostatic binding free energies (ΔΔGel). For (a) and (b) the Pearson correlation coefficient (R2) of the least-squares line was greater than 0.99999, and the Spearman correlation coefficients (RS2) were 0.998 and 0.998. For (c) and (d) R2 = 0.99 and 0.95, and RS = 0.965 and 0.978. The dashed lines are least-squares lines drawn through the data.
The rankings of the complexes by ΔΔGel, like the rankings of the molecules by ΔGel, were not strongly sensitive to the choice of force field, as a plot of the results given by the CHARMM force field versus those given by the AMBER force field had R2 = 0.99 and RS2 = 0.965 when the SE surface was used and R2 = 0.95 and RS = 0.978 when the vdW surface was used (Figure 4). However, the differences between the predictions given by the two force fields ranged from 0.15–127 kJ/mol when the SE surface was used and from 0.3–112 kJ/mol when the vdW surface was used.
Surface Definition
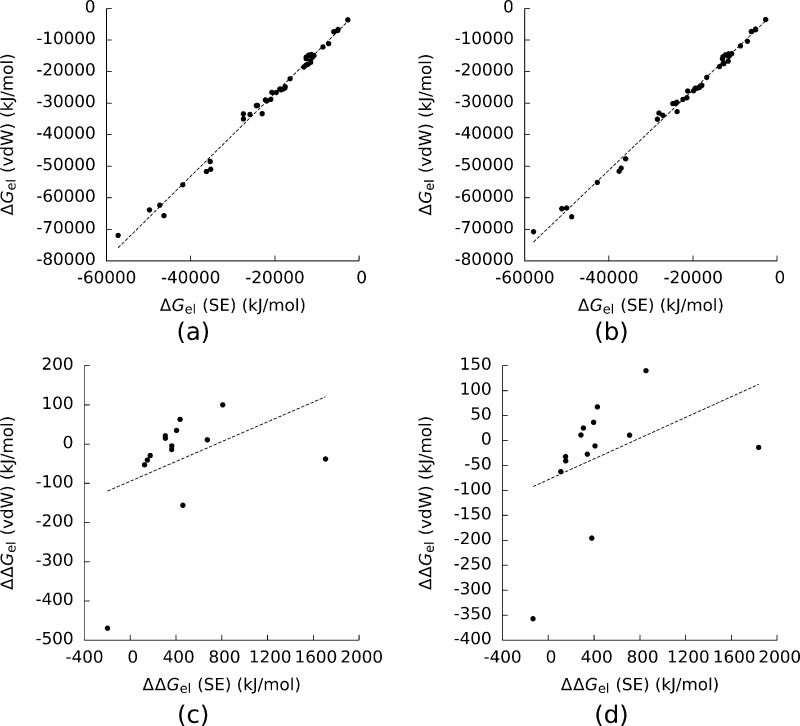
Figure 5 shows the ΔGel computed with the SE surface plotted against those computed with the vdW surface for both the AMBER and CHARMM force fields. For both force fields, the vdW surface predicted consistently larger magnitudes of ΔGel. The slopes of the least-squares lines in the first two plots in Figure 5 were 0.75 and 0.78, but this difference did not affect the ranking of the complexes by ΔGel. (For both of these plots R2 > 0.99 and RS2 > 0.99.)
Figure 5.
Electrostatic solvation free energies (ΔGel) for the complexes and their components computed with the van der Waals (vdW) surface plotted against those with the solvent-excluded (SE) surface created with (a) the AMBER force field and (b) the CHARMM force field. (c) and (d) show the same plots for the electrostatic binding free energies (ΔΔGel). For (a) and (b) the Pearson and Spearman correlation coefficients (R2 and RS2) of the least-squares line were greater than 0.99. For (c) and (d) R2 = 0.16 and 0.17, and RS = 0.45 and 0.63. The dashed lines are least-squares lines drawn through the data.
In contrast, the rankings of these complexes by ΔΔGel (Figure 5) were very sensitive to the choice of surface definition. (R2 = 0.16 and 0.17 and RS2 = 0.45 and 0.63.) The predictions of ΔΔGel given by the two surface definitions differed by between 177 and 1745 kJ/mol.
Gradually Varying the Surface Definition
As shown in the previous section, the estimates of ΔΔGel given by the SE surface differed substantially from those given by the vdW surface. Although both the SE and vdW surfaces agree that the region contained within the vdW radii of the solute atoms should be treated as interior to the solute, the charges in the vdW surface are more solvent exposed than those in the SE surface because the vdW surface contains gaps and crevices of high dielectric inside the molecule, whereas the SE surface does not (Figure 6).
Figure 6.
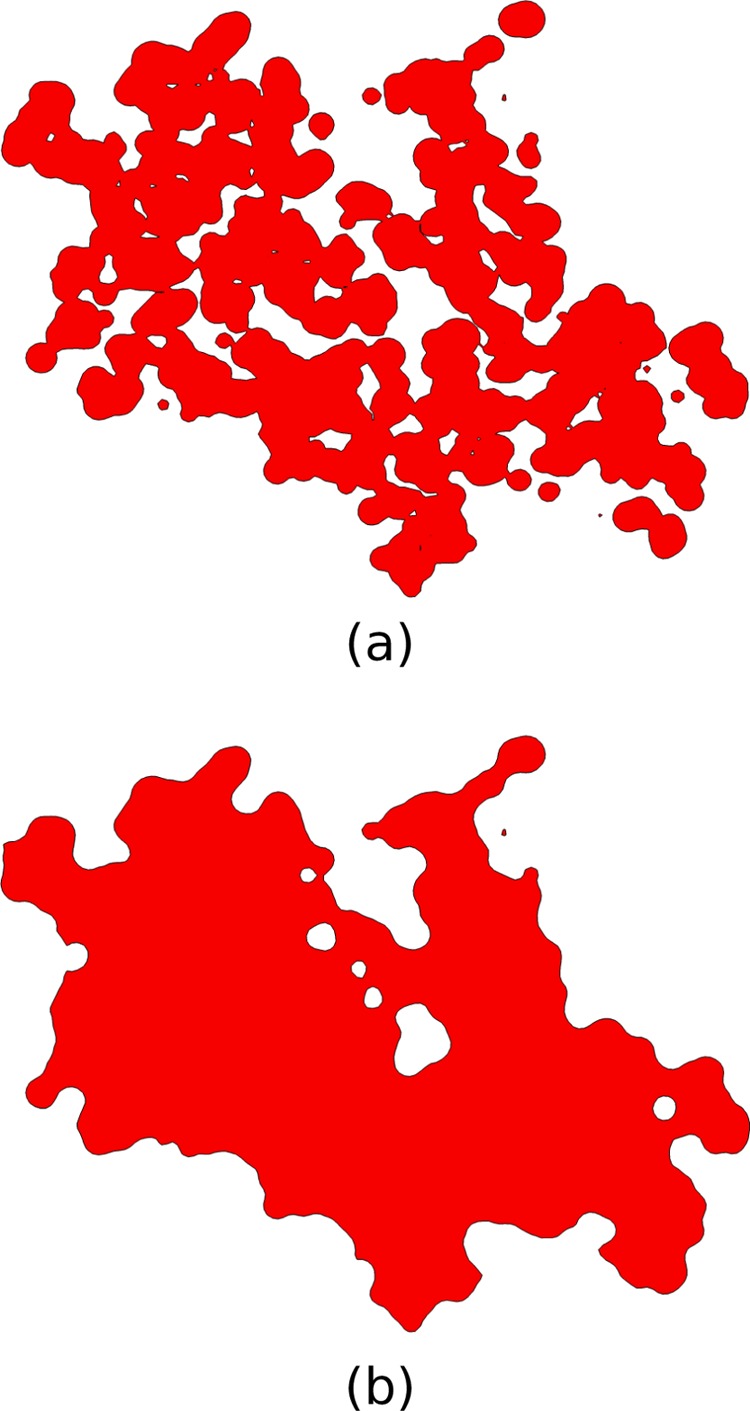
Slices through chain A of the 1he8 complex. The contours trace the boundary between the molecular interior and exterior for a) the van der Waals and b) the solvent-excluded surfaces.
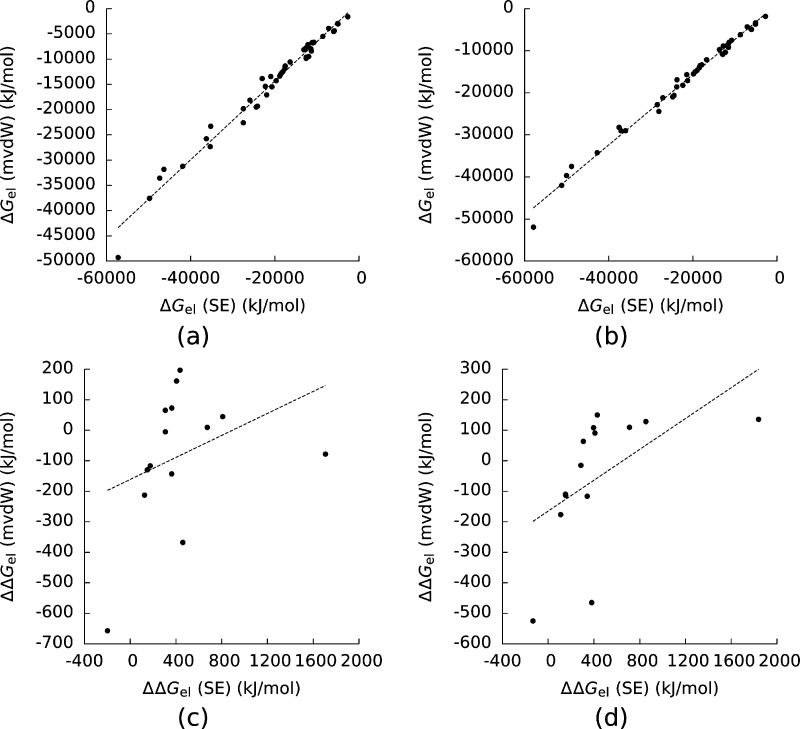
Whether these crevices should be considered to be solvated is still an active area of research,38−40 and we wanted to know how the PBE’s predictions of ΔGel and ΔΔGel changed as these crevices were gradually filled. To this end, we considered the mvdW surface. The mvdW surface was originally designed to mimic the SE surface when the probe radius was set to 1.4 Å,48 and its predictions of ΔGel were indeed highly correlated with those of the SE surface (Figure 7). (R2 = 0.98 for the AMBER force field and 0.99 for CHARMM.) However, its predictions of ΔΔGel were not. (R2 = 0.13 for the AMBER force field and 0.30 for CHARMM.) Once again, that a surface definition produced estimates of ΔGel that were highly correlated with those given by the SE surface did not guarantee that its predictions of ΔΔGel would be similarly highly correlated with those of the SE surface.
Figure 7.
Electrostatic solvation free energies (ΔGel) for the complexes and their components computed with the modified van der Waals (mvdW) surface plotted against those with the solvent-excluded (SE) surface created with (a) the AMBER force field and (b) the CHARMM force field. (c) and (d) show the same plots for the electrostatic binding free energies (ΔΔGel). For (a) and (b) the Pearson correlation coefficients (R2) of the least-squares lines were 0.98 and 0.99. For (c) and (d) R2 = 0.13 and 0.30. The dashed lines are least-squares lines drawn through the data.
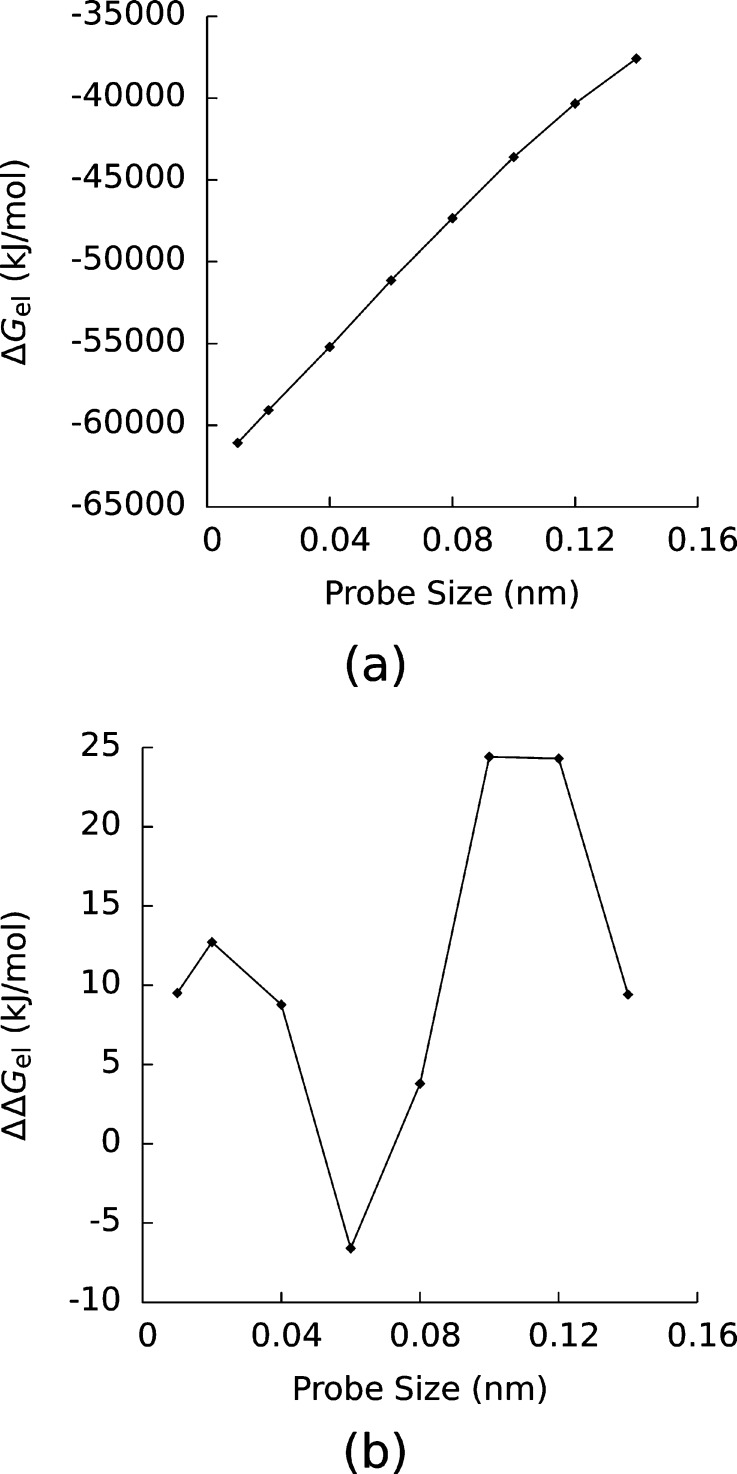
In Table 1, the ΔGel of the complexes and the ΔΔGel are shown as functions of the probe radius in the mvdW surface. Possibly because the charges in the molecules were less solvent exposed as the probe radius was increased, ΔGel increased monotonically with probe radius. A typical example is shown in Figure 8, where ΔGel for the complex with the pdbid 1kxp is shown as a function of probe radius. However, the dependence of ΔΔGel on probe radius is more complex. In Figure 8 ΔΔGel for 1kxp is displayed, and unlike ΔGel for this complex, ΔΔGel did not vary monotonically with probe radius. Although ΔΔGelC did not depend on probe radius and the ΔGel all increased monotonically with surface area, ΔΔGel = ΔGcomp – ΔG1 – ΔG2 + ΔΔGel had no simple dependence on probe radius and was instead a complicated function of the molecular shape and charge distribution.
Table 1. Electrostatic Solvation (ΔGel) and Binding (ΔΔGel) Free Energies for the Complexes in This Study Computed with the Modified van der Waals Surface and the AMBER Force Field As Functions of Probe Radiusa.
| probe radii (nm) |
|||||||||
|---|---|---|---|---|---|---|---|---|---|
| complexes | 0.01 | 0.02 | 0.04 | 0.06 | 0.08 | 0.1 | 0.12 | 0.14 | |
| 1acb | ΔGel | –16941 | –16107 | –14482 | –12847 | –11387 | –9987 | –8781 | –7810 |
| ΔΔGel | –39 | –37 | –39 | –30 | –41 | –70 | –102 | –130 | |
| 1atn | ΔGel | –45796 | –43720 | –40084 | –36851 | –34123 | –31514 | –29228 | –27330 |
| ΔΔGel | –53 | –48 | –59 | –73 | –103 | –144 | –181 | –213 | |
| 1avx | ΔGel | –23678 | –22504 | –20272 | –18115 | –16272 | –14552 | –13066 | –11846 |
| ΔΔGel | –474 | –473 | –487 | –497 | –529 | –566 | –613 | –657 | |
| 1b6c | ΔGel | –27210 | –26020 | –23682 | –21188 | –18952 | –16858 | –15001 | –13440 |
| ΔΔGel | 20 | 21 | 23 | 26 | 33 | 38 | 50 | 65 | |
| 1beb | ΔGel | –32291 | –31412 | –29810 | –28156 | –26631 | –25147 | –23792 | –22603 |
| ΔΔGel | –32 | –20 | –28 | –57 | –71 | –91 | –107 | –117 | |
| 1brs | ΔGel | –11592 | –11121 | –10126 | –9055 | –8060 | –7082 | –6209 | –5491 |
| ΔΔGel | –9 | 4 | –4 | –38 | –69 | –96 | –121 | –143 | |
| 1buh | ΔGel | –23443 | –22389 | –20309 | –18157 | –16226 | –14363 | –12722 | –11367 |
| ΔΔGel | –4 | –3 | 0 | 10 | 30 | 40 | 61 | 73 | |
| 1h1v | ΔGel | –53147 | –50968 | –46929 | –43069 | –39649 | –36404 | –33593 | –31214 |
| ΔΔGel | 65 | 76 | 78 | 92 | 94 | 114 | 146 | 197 | |
| 1he8 | ΔGel | –61945 | –59048 | –53460 | –47992 | –43215 | –38849 | –35058 | –31823 |
| ΔΔGel | 12 | 11 | 7 | 9 | 27 | 14 | –5 | –5 | |
| 1kxp | ΔGel | –61074 | –59078 | –55212 | –51137 | –47334 | –43605 | –40331 | –37577 |
| ΔΔGel | 10 | 13 | 9 | –7 | 4 | 24 | 24 | 9 | |
| 1sbb | ΔGel | –31396 | –29839 | –26757 | –23646 | –20853 | –18146 | –15783 | –13853 |
| ΔΔGel | 40 | 43 | 50 | 56 | 80 | 110 | 135 | 161 | |
| 1ysl | ΔGel | –69136 | –67038 | –63300 | –59813 | –56728 | –53866 | –51382 | –49291 |
| ΔΔGel | –21 | –3 | 7 | 12 | 35 | 7 | –38 | –78 | |
| 2hp0 | ΔGel | –48480 | –46080 | –41773 | –37751 | –34226 | –30989 | –28172 | –25779 |
| ΔΔGel | 119 | 139 | 173 | 201 | 202 | 156 | 103 | 45 | |
| 2uy1 | ΔGel | –59581 | –57517 | –53323 | –48714 | –44448 | –40334 | –36703 | –33576 |
| ΔΔGel | –158 | –146 | –159 | –177 | –220 | –267 | –328 | –368 | |
Both ΔGel and ΔΔGel are in units of kJ/mol.
Figure 8.
Electrostatic (a) solvation and (b) binding free energies (ΔGel and ΔΔGel) of one of the complexes in this study (pdbid: 1kxp) as functions of the probe radius used to define the modified van der Waals surface.
Conclusions
Implicit solvent methods based on the PBE6−10 have been fairly successful at predicting a wide range of biophysical quantities, including ΔG3,5,11−15 and the salt dependence of ΔΔG.16−22 Because these methods eliminate the need to consider the degrees of freedom of the solvent by integrating over them, they are a fast alternative to methods, such as MD methods,1,2 that explicitly account for those degrees of freedom. In particular, if PB methods could be used to obtain fast and accurate estimates of ΔΔG, they could complement slow, expensive experimental screening of compound libraries in drug-development studies, potentially revolutionizing drug development and discovery. Unfortunately, PB methods have been less successful at predicting ΔΔG than ΔG.23−30
At first glance, the idea that PB methods could be successful at predicting ΔG but fail to predict ΔΔG seems self-contradictory. As shown in eq 1, ΔΔGel can be computed by combining estimates of ΔGel with estimates of ΔΔGelC. Part of the reason for this seeming contradiction may be that ΔΔGel, as in the present study, is sometimes orders of magnitude smaller than ΔGel, and therefore estimates of ΔGel that have reasonably small relative errors can lead to estimates of ΔΔGel with large relative errors. In the present study ΔGel covered a range of tens of thousands of kJ/mol, whereas ΔΔGel only covered a range of hundreds of kJ/mol. Rankings of these molecules by ΔGel were almost independent of surface definition and choice of force field, whereas rankings of these complexes by ΔΔGel were very sensitive to these details.
One reason that ΔΔGel is difficult to compute may be its sensitivity to the choice of force field. Modern force fields, such as the AMBER31 and CHARMM32 force fields, use approximate classical energy functions to model the underlying quantum mechanical interactions, and whether these methods can accurately predict ΔΔG, even when the degrees of freedom of the solvent are included, is unclear. The results presented here are consistent with those of other studies that show that current force fields are accurate enough to accurately rank small molecules by ΔG.3−5 Additionally, the rankings of these complexes by ΔΔGel were not much affected by changing the force field, but although the rankings of the complexes examined here did not change significantly when different force fields were used, the absolute differences in ΔΔGel were large enough that they could cause problems for applications where the differences in ΔΔGel between different complexes were smaller.
Another potential source of uncertainties in ΔΔGel is the uncertainty in how the interface between the interior and exterior of the molecule should be defined. Many different surface definitions have been created (e.g., the SE surface,36,37 the vdW surface,38−40 Gaussian surfaces,41,42 and self-consistent surfaces43−47), and no clear consensus has emerged on which of these surface definitions is most realistic. In the present study both the SE and vdW surfaces produced consistent rankings of these molecules by ΔGel, although the absolute differences in ΔGel between these two surface definitions could be quite large. In contrast, the estimates of ΔΔGel produced by these two surface definitions were not correlated. (R2 = 0.16 for the AMBER force field, and 0.17 for CHARMM.) Even the mvdW surface, which was designed to mimic the SE surface, produced estimates of ΔΔGel that were uncorrelated with those given by the SE surface. (R2 = 0.13 for the AMBER force field and 0.30 for CHARMM.) Until the question of how to define the molecular surface is more settled, the PBE will not be able to produce estimates of ΔΔGel accurate enough to be useful for the systems considered here. Of course, only a small number of complexes were considered here and the PBE may be more reliable for other systems, but the data shown here indicate that the sensitivity of ΔΔGel to the exact method that is used to define the molecular surface may help explain why PBE methods have not been uniformly successful at predicting ΔΔG.
In conclusion, explaining why PB methods have been fairly successful at predicting ΔG but have been much less successful at predicting ΔΔG appears to be difficult at first glance because ΔΔGel can be computed by combining estimates of ΔGel with ΔΔGelC. However, ΔGel is typically orders of magnitude larger than ΔΔGel, and therefore estimates of ΔGel must be very accurate if they are to combine to give accurate estimates of ΔΔGel. For these reasons, studies that compare the predictions of ΔG by PB methods to experimental results will probably not be sufficient for improving the predictions of ΔΔG given by these methods because the ability of a particular model to predict consistent estimates of ΔGel does not guarantee that it will produce consistent estimates of ΔΔGel.
Acknowledgments
Marcia O. Fenley acknowledges the support of NIH grant 5R44GM073391-03, and Robert C. Harris acknowledges the support of the National Science Foundation (CHE-1152876) and the National Institutes of Health (GM-037657).
The authors declare no competing financial interest.
Funding Statement
National Institutes of Health, United States
References
- Allen M. P.; Tildesley D. J.. Computer Simulation of Liquids; Oxford University Press: New York, 1987. [Google Scholar]
- Frenkel D.; Smit B.. Understanding Molecular Simulation From Algorithms to Applications; Academic Press: San Diego, 2002. [Google Scholar]
- Guthrie J. P. A Blind Challenge for Computational Solvation Free Energies: Introduction and Overview. J. Phys. Chem. B 2009, 113, 4501–4507. [DOI] [PubMed] [Google Scholar]
- Mobley D. L.; Bayly C. I.; Cooper M. D.; Shirts M. R.; Dill K. A. Small Molecule Hydration Free Energies in Explicit Solvent: An Extensive Test of Fixed-Charge Atomistic Simulations. J. Chem. Theory Comput. 2009, 5, 350–358. [DOI] [PMC free article] [PubMed] [Google Scholar]
- Mobley D. L.; Wymer K. L.; Lim N. M.; Guthrie J. P. Blind Prediction of Solvation Free Energies From the SAMPL4 Challenge. J. Comput.-Aided Mol. Des. 2014, 28, 135–150. [DOI] [PMC free article] [PubMed] [Google Scholar]
- Grochowski P.; Trylska J. Continuum Molecular Electrostatics, Salt Effects, and Counterion Binding–A Review of the Poisson-Boltzmann Theory and its Modifications. Biopolymers 2008, 89, 93–113. [DOI] [PubMed] [Google Scholar]
- Bardhan J. P. Biomolecular Electrostatics–I Want Your Solvation (Model). Comput. Sci. Discovery 2012, 5, 013001. [Google Scholar]
- Li C.; Li L.; Petukh M.; Alexov E. Progress in Developing Poisson–Boltzmann Equation Solvers. Mol. Based Math. Biol. 2013, 1, 42–62. [DOI] [PMC free article] [PubMed] [Google Scholar]
- Botello-Smith W. M.; Cai Q.; Luo R. Biological Applications of Classical Electrostatics Methods. J. Theor. Comput. Chem. 2014, 13, 1440008. [Google Scholar]
- Xiao L.; Wang C.; Luo R. Recent Progress in Adapting Poisson–Boltzmann Methods to Molecular Simulations. J. Theor. Comput. Chem. 2014, 13, 1430001. [Google Scholar]
- Jean-Charles A.; Nicholls A.; Sharp K.; Honig B.; Tempczyk A.; Hendrickson T. F.; Still W. C. Electrostatic Contributions to Solvation Energies: Comparison of Free Energy Perturbation and Continuum Calculations. J. Am. Chem. Soc. 1991, 113, 1454–1455. [Google Scholar]
- Mohan V.; Davis M. E.; McCammon J. A.; Pettitt B. M. Continuum Model Calculations of Solvation Free Energies: Accurate Evaluation of Electrostatic Contributions. J. Phys. Chem. 1992, 96, 6428–6431. [Google Scholar]
- Simonson T.; Bruenger A. T. Solvation Free Energies Estimated from Macroscopic Continuum Theory: An Accuracy Assessment. J. Phys. Chem. 1994, 98, 4683–4694. [Google Scholar]
- Dejaegere A.; Karplus M. Analysis of Coupling Schemes in Free Energy Simulations: A Unified Description of Nonbonded Contributions to Solvation Free Energies. J. Phys. Chem. 1996, 100, 11148–11164. [Google Scholar]
- Nicholls A.; Mobley D. L.; Guthrie J. P.; Chodera J. D.; Bayly C. I.; Cooper M. D.; Pande V. S. Predicting Small-Molecule Solvation Free Energies: An Informal Blind Test for Computational Chemistry. J. Med. Chem. 2008, 51, 769–779. [DOI] [PubMed] [Google Scholar]
- Misra V. K.; Hecht J. L.; Sharp K. A.; Friedman R. A.; Honig B. Salt Effects on Protein-DNA Interactions: The λcI Repressor and EcoRI Endonuclease. J. Mol. Biol. 1994, 238, 264–280. [DOI] [PubMed] [Google Scholar]
- Misra V. K.; Honig B. On the Magnitude of the Electrostatic Contribution to Ligand-DNA Interactions. Proc. Natl. Acad. Sci. U. S. A. 1995, 92, 4691–4695. [DOI] [PMC free article] [PubMed] [Google Scholar]
- Bredenberg J.; Boschitsch A. H.; Fenley M. O. The role of anionic protein residues on the salt dependence of the binding of aminoacyl-tRNA synthetases to tRNA: a Poisson-Boltzmann analysis. Commun. Comput. Phys. 2008, 3, 1051–1070. [Google Scholar]
- Bredenberg J. H.; Russo C.; Fenley M. O. Salt-mediated electrostatics in the association of TATA binding proteins to DNA: a combined molecular mechanics/Poisson-Boltzmann study. Biophys. J. 2008, 94, 4634–4645. [DOI] [PMC free article] [PubMed] [Google Scholar]
- Fenley M. O.; Harris R. C.; Jayaram B.; Boschitsch A. H. Revisiting the Association of Cationic Groove-Binding Drugs to DNA Using a Poisson-Boltzmann Approach. Biophys. J. 2010, 99, 879–886. [DOI] [PMC free article] [PubMed] [Google Scholar]
- Fenley M. O.; Russo C.; Manning G. S. Theoretical assessment of the oligolysine model for ionic interactions in protein–DNA complexes. J. Phys. Chem. B 2011, 115, 9864–9872. [DOI] [PMC free article] [PubMed] [Google Scholar]
- Harris R. C.; Bredenberg J. H.; Silalahi A. R. J.; Boschitsch A. H.; Fenley M. O. Understanding the physical basis of the salt dependence of the electrostatic binding free energy of mutated charged ligand–nucleic acid complexes. Biophys. Chem. 2011, 156, 79–87. [DOI] [PubMed] [Google Scholar]
- Wang J.; Morin P.; Wang W.; Kollman P. A. Use of MM-PBSA in Reproducing the Binding Free Energies to HIV-1 RT of TIBO Derivatives and Predicting the Binding Mode to HIV-1 RT of Efavirenz by Docking and MM-PBSA. J. Am. Chem. Soc. 2001, 123, 5221–5230. [DOI] [PubMed] [Google Scholar]
- Brown S. P.; Muchmore S. W. High-Throughput Calculation of Protein–Ligand Binding Affinities: Modification and Adaptation of the MM-PBSA Protocol to Enterprise Grid Computing. J. Chem. Inf. Model. 2006, 46, 999–1005. [DOI] [PubMed] [Google Scholar]
- Hou T.; Wang J.; Li Y.; Wang W. Assessing the Performance of the MM/PBSA and MM/GBSA Methods. 1. The Accuracy of Binding Free Energy Calculations Based on Molecular Dynamics Simulations. J. Chem. Inf. Model. 2011, 51, 69–82. [DOI] [PMC free article] [PubMed] [Google Scholar]
- Adler M.; Beroza P. Improved Ligand Binding Energies Derived from Molecular Dynamics: Replicate Sampling Enhances the Search of Conformational Space. J. Chem. Inf. Model. 2013, 53, 2065–2072. [DOI] [PubMed] [Google Scholar]
- Harris R. C.; Mackoy T.; Fenley M. O. A Stochastic Solver of the Generalized Born Model. Mol. Based Math. Biol. 2013, 1, 63–74. [Google Scholar]
- Li M.; Petukh M.; Alexov E.; Panchenko A. R. Predicting the Impact of Missense Mutations on Protein–Protein Binding Affinity. J. Chem. Theory Comput. 2014, 10, 1770–1780. [DOI] [PMC free article] [PubMed] [Google Scholar]
- Muddana H. S.; Fenley A. T.; Mobley D. L.; Gilson M. K. The SAMPL4 Host–Guest Blind Prediction Challenge: An Overview. J. Comput.-Aided Mol. Des. 2014, 1–13. [DOI] [PMC free article] [PubMed] [Google Scholar]
- Zhu Y.-L.; Beroza P.; Artis D. R. Including Explicit Water Molecules as Part of the Protein Structure in MM/PBSA Calculations. J. Chem. Inf. Model. 2014, 54, 462–469. [DOI] [PubMed] [Google Scholar]
- Cornell W. D.; Cieplak P.; Bayly C. I.; Gould I. R.; Merz K. M.; Ferguson D. M.; Spellmeyer D. C.; Fox T.; Caldwell J. W.; Kollman P. A. A Second Generation Force Field for the Simulation of Proteins, Nucleic Acids, and Organic Molecules. J. Am. Chem. Soc. 1995, 117, 5179–5197. [Google Scholar]
- MacKerell A. D. Jr.; et al. All-atom empirical potential for molecular modeling and dynamics studies of proteins. J. Phys. Chem. B 1998, 102, 3586–3616. [DOI] [PubMed] [Google Scholar]
- Sitkoff D.; Ben-Tal N.; Honig B. Calculation of Alkane to Water Solvation Free Energies Using Continuum Solvent Models. J. Phys. Chem. 1996, 100, 2744–2752. [Google Scholar]
- Nina M.; Beglov D.; Roux B. Atomic Radii for Continuum Electrostatics Calculations Based on Molecular Dynamics Free Energy Simulations. J. Phys. Chem. B 1997, 101, 5239–5248. [Google Scholar]
- Green D. F. Optimized Parameters for Continuum Solvation Calculations with Carbohydrates. J. Phys. Chem. B 2008, 112, 5238–5249. [DOI] [PubMed] [Google Scholar]
- Alexov E. Role of the Protein Side-Chain Fluctuations on the Strength of Pair-Wise Electrostatic Interactions: Comparing Experimental with Computed pKas. Proteins: Struct., Funct., Bioinf. 2003, 50, 94–103. [DOI] [PubMed] [Google Scholar]
- Connolly M. L. Solvent-Accessible Surfaces of Proteins and Nucleic Acids. Science 1983, 221, 709–713. [DOI] [PubMed] [Google Scholar]
- Dong F.; Vijayakumar M.; Zhou H.-X. Comparison of Calculation and Experiment Implicates Significant Electrostatic Contributions to the Binding Stability of Barnase and Barstar. Biophys. J. 2003, 85, 49–60. [DOI] [PMC free article] [PubMed] [Google Scholar]
- Dong F.; Zhou H.-X. Electrostatic Contribution to the Binding Stability of Protein-Protein Complexes. Proteins: Struct., Funct., Bioinf. 2006, 65, 87–102. [DOI] [PubMed] [Google Scholar]
- Alsallaq R.; Zhou H.-X. Electrostatic Rate Enhancement and Transient Complex of Protein-Protein Association. Proteins: Struct., Funct., Bioinf. 2008, 71, 320–335. [DOI] [PMC free article] [PubMed] [Google Scholar]
- Friedrichs M.; Zhou R.; Edinger S. R.; Friesner R. A. Poisson-Boltzmann Analytical Gradients for Molecular Modeling Calculations. J. Phys. Chem. B 1999, 103, 3057–3061. [Google Scholar]
- Grant J. A.; Pickup B. T.; Nicholls A. A Smooth Permittivity Function for Poisson-Boltzmann Solvation Methods. J. Comput. Chem. 2001, 22, 608–640. [Google Scholar]
- Dzubiella J.; Swanson J. M. J.; McCammon J. A. Coupling Nonpolar and Polar Solvation Free Energies in Implicit Solvent Models. J. Chem. Phys. 2006, 124, 084905. [DOI] [PubMed] [Google Scholar]
- Cheng L.-T.; Dzubiella J.; McCammon J. A.; Li B. Application of the Level-Set Method to the Implicit Solvation of Nonpolar Molecules. J. Chem. Phys. 2007, 127, 084503. [DOI] [PubMed] [Google Scholar]
- Cheng L.-T.; Wang Z.; Setny P.; Dzubiella J.; Li B.; McCammon J. A. Interfaces and Hydrophobic Interactions in Receptor-Ligand Systems: A Level-Set Variational Implicit Solvent Approach. J. Chem. Phys. 2009, 131, 144102. [DOI] [PMC free article] [PubMed] [Google Scholar]
- Chen Z.; Baker N. A.; Wei G. W. Differential Geometry Based Solvation Model I: Eulerian Formulation. J. Comput. Phys. 2010, 229, 8231–8258. [DOI] [PMC free article] [PubMed] [Google Scholar]
- Chen Z.; Baker N. A.; Wei G. W. Differential Geometry Based Solvation Model II: Lagrangian Formulation. J. Math. Biol. 2011, 63, 1139–1200. [DOI] [PMC free article] [PubMed] [Google Scholar]
- Lu Q.; Luo R. A Poisson-Boltzmann dynamics method with nonperiodic boundary condition. J. Chem. Phys. 2003, 119, 11035–11047. [Google Scholar]
- Hu C. Y.; Kokubo H.; Lynch G. C.; Bolen D. W.; Pettitt B. M. Backbone additivity in the transfer model of protein solvation. Protein Sci. 2010, 19, 1011–1022. [DOI] [PMC free article] [PubMed] [Google Scholar]
- Kokubo H.; Hu C. Y.; Pettitt B. M. Peptide Conformational Preferences in Osmolyte Solutions: Transfer Free Energies of Decaalanine. J. Am. Chem. Soc. 2011, 133, 1849–1858. [DOI] [PMC free article] [PubMed] [Google Scholar]
- Kokubo H.; Harris R. C.; Asthagiri D.; Pettitt B. M. Solvation Free Energies of Alanine Peptides: The Effect of Flexibility. J. Phys. Chem. B 2013, 117, 16428–16435. [DOI] [PMC free article] [PubMed] [Google Scholar]
- Harris R. C.; Pettitt B. M. Effects of geometry and chemistry on hydrophobic solvation. Proc. Natl. Acad. Sci. U. S. A. 2014, 111, 14681–14686. [DOI] [PMC free article] [PubMed] [Google Scholar]
- Berman H. M.; Westbrook J.; Feng Z.; Gilliland G.; Bhat T. N.; Weissig H.; Shindyalov I. N.; Bourne P. E. The Protein Data Bank. Nucleic Acids Res. 2000, 28, 235–242. [DOI] [PMC free article] [PubMed] [Google Scholar]
- Dolinsky T. J.; Nielsen J. E.; McCammon J. A.; Baker N. A. PDB2PQR: An Automated Pipeline for the Setup of Poisson-Boltzmann Electrostatics Calculations. Nucleic Acids Res. 2004, 32, W665–W667. [DOI] [PMC free article] [PubMed] [Google Scholar]
- Dolinsky T. J.; Czodrowski P.; Li H.; Nielsen J. E.; Jensen J. H.; Klebe G.; Baker N. A. PDB2PQR: Expanding and Upgrading Automated Preparation of Biomolecular Structures for Molecular Simulations. Nucleic Acids Res. 2007, 35, W522–W525. [DOI] [PMC free article] [PubMed] [Google Scholar]
- Boschitsch A. H.; Fenley M. O. A fast and robust Poisson-Boltzmann solver based on adaptive Cartesian grids. J. Chem. Theory Comput. 2011, 7, 1524–1540. [DOI] [PMC free article] [PubMed] [Google Scholar]
- Boschitsch A. H.; Fenley M. O. A New Outer Boundary Formulation and Energy Corrections for the Nonlinear Poisson–Boltzmann Equation. J. Comput. Chem. 2007, 28, 909–921. [DOI] [PubMed] [Google Scholar]
- Harris R. C.; Boschitsch A. H.; Fenley M. O. Influence of Grid Spacing in Poisson-Boltzmann Equation Binding Energy Estimation. J. Chem. Theory Comput. 2013, 9, 3677–3685. [DOI] [PMC free article] [PubMed] [Google Scholar]
- Cooper C. D.; Bardhan J. P.; Barba L. A. A Biomolecular Electrostatics Solver Using Python, GPUs and Boundary Elements that can Handle Solvent-Filled Cavities and Stern Layers. Comput. Phys. Commun. 2014, 185, 720–729. [DOI] [PMC free article] [PubMed] [Google Scholar]


