

Summary
Cells internalize various molecules through clathrin-mediated endocytosis (CME). Previous live-cell imaging studies suggested that CME is inefficient, with about half of the events terminated. These CME efficiency estimates may have been confounded by overexpression of fluorescently tagged proteins and inability to filter out false CME sites. Here, we employed genome editing and machine learning to identify and analyze authentic CME sites. We examined CME dynamics in cells that express fluorescent fusions of two defining CME proteins, AP2 and clathrin. Support vector machine classifiers were built to identify and analyze authentic CME sites. From inception until disappearance, authentic CME sites contain both AP2 and clathrin, have the same degree of limited mobility, continue to accumulate AP2 and clathrin over lifetimes > ~20s, and almost always form vesicles as assessed by dynamin2 recruitment. Sites that contain only clathrin or AP2 show distinct dynamics, suggesting they are not part of the CME pathway.
Introduction
Cells internalize lipids, signaling molecules and nutrients through clathrin-mediated endocytosis (CME) (Doherty and McMahon, 2009; McMahon and Boucrot, 2011). During CME, the coat protein clathrin, the adaptor protein AP2, and many other endocytic proteins and cargo molecules assemble at a region of the plasma membrane (PM) enriched for phosphatidylinositol 4,5-bisphosphate (PIP2). A clathrin-coated pit (CCP) is formed by the concerted actions of CME proteins and actin. The CCP is subsequently pinched off by the GTPase dynamin to form a vesicle, in which cargo molecules are internalized.
This “canonical” behavior for productive CME events, however, applies to a subset of the clathrin or AP2 spots visible by fluorescence light microscopy at or near the cell surface (Loerke et al., 2009; Taylor et al., 2011; Aguet et al., 2013; Grassart et al., 2014). A large fraction of the fluorescent spots identified as CME sites have been reported to fail to form vesicles, as revealed by observation of dynamin recruitment or of internalization of transferrin labeled with pH-sensitive markers (Ehrlich et al., 2004; Taylor et al., 2011; Grassart et al., 2014). The nature of this presumed failed population is not well understood. It has been proposed that some authentic CME sites are disassembled when they fail to be stabilized by other endocytic proteins or a quorum of cargo molecules (Ehrlich et al., 2004; Loerke et al., 2009; Mettlen et al., 2010). However, the apparent CME sites that never form vesicles also include single molecules, clathrin triskelia, and clathrin-coated vesicles from sources other than CME etc. (Keyel et al., 2004; Zhao and Keen, 2008). Whether, why and how often bona fide CME sites are disassembled prior to vesicle formation are important questions for understanding CME mechanism and regulation. Therefore, an essential prerequisite for understanding CME regulation is identification of authentic CME sites. In previous work, authentic CME sites were identified based on assumptions about CME dynamics, such as lifetime, and assembly-disassembly kinetics of CME sites (Loerke et al., 2009; Aguet et al., 2013). Although these approaches provided insights into the dynamic nature of CME, these analyses have an intrinsic limitation: The identifying characteristics of authentic CME sites were largely based on a priori assumptions rather than on unbiased analysis and validation.
Here, we developed a robust tool that can distinguish authentic CME sites from false CME sites. By employing genome editing and machine learning, we distinguished authentic CME sites from all other clathrin- and AP2- containing sites. When we excluded the false CME sites from our analyses, we found that the vast majority (~90%) of the authentic CME sites form vesicles, in contrast to previous conclusions that CME is inefficient.
Results
Identification of authentic CME sites based on native AP2 and clathrin dynamics
We began our analyses with the assumption, based on various reports, that the AP2 adaptor is an integral component of the CME machinery (Boucrot et al., 2010; Cocucci et al., 2012), and assumed that the majority of authentic CME sites contain both AP2 and clathrin. AP2 is an endocytic hub protein whose appendage domains bind numerous endocytic accessory proteins and cargo molecules (Schmid and McMahon, 2007). Although existence of CME sites without AP2 was postulated because uptake of certain ligands (such as low density lipoprotein) was not affected by severe AP2 depletion (Hinrichsen et al., 2003; Keyel et al., 2006; Motley et al., 2006), no direct evidence for existence of authentic CME sites lacking AP2 has been reported. Nevertheless, our assumption may lead to an underestimation of the number of authentic CME sites.
To visualize AP2 and clathrin without perturbing expression levels, we genome edited a cell line to expresses fluorescent protein fusions of the AP2 µ subunit (AP2M1) and clathrin light chain A (CLTA). Overexpression of fluorescent fusion proteins changes the stoichiometry of CME proteins, and can perturb normal CME dynamics and function (Doyon et al., 2011; Mettlen and Danuser, 2014). Additionally, changes in CME adaptor protein levels affect CME productivity (Loerke et al., 2009; Mettlen et al., 2009). Furthermore, depending on the level of overexpression of the AP2 beta subunit, the observed AP2 dynamics can be drastically altered from the native dynamics, because the overexpressed subunit can be mis-incorporated into AP1 complexes (Keyel et al., 2004). Thus, it is extremely important to analyze CME productivity when protein stoichiometry is not perturbed.
AP2 consists of four subunits, α, β, µ and σ. We chose to create an internal fusion of the AP2 µ subunit, inserting a fluorescent protein between residues 236 and 237, because insertions at this site cause minimal perturbation to CME (Motley et al., 2006). We generated a pair of Transcription Activator-Like Effector Nucleases (TALENs) and a donor plasmid (Fig. 1A, S1A). The AP2M1 gene in MDA-MB-231 human cells was edited to express an RFP fusion (Fig.1BC, S1BC). Additionally, the gene encoding clathrin light chain A (CLTA) was edited to express its product as a GFP fusion (Fig. 1BC, S1BC, Table S1). Fluorescent protein fusions of AP2 and clathrin are often used interchangeably as CME markers. AP2, however, is solely involved in CME, whereas clathrin-coated vesicles (CCVs) not only form on the plasma membrane (PM), but also form on various cytoplasmic organelles including endosomes and the trans-Golgi network (TGN) (Brodsky, 2012). Accordingly, by epifluorescence imaging, clathrin is observed as punctate signals on the PM and on many cytoplasmic compartments, while AP2 is only found as spots on the PM (Fig. 1B).
Figure 1. Authentic CME sites were identified and characterized by co-labeling of clathrin and AP2.
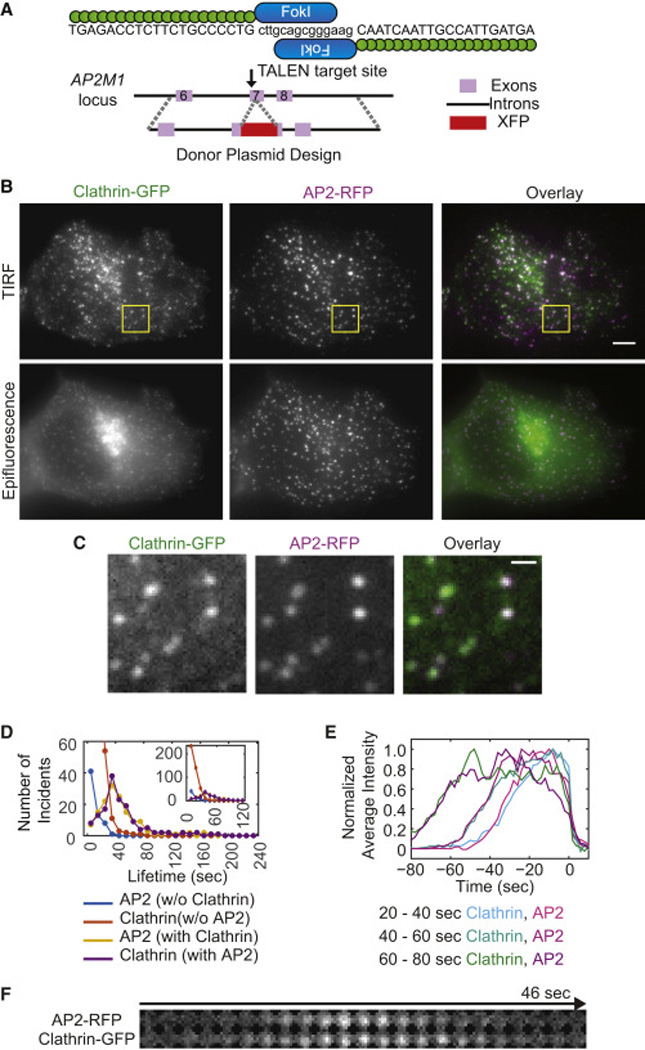
A) Schematics showing TALEN and donor plasmid design for AP2M1 genome editing. B) Epifluorescence and TIRF images of the MDA-MB-231 cell line genome-edited to express CLTA-GFP and AP2M1-RFP. Scale bar = 5µm C) Magnified views of the boxed region in the TIRF images in B). Scale bar = 1µm. D) Histogram of lifetimes for fluorescent spots containing AP2 and clathrin, AP2 alone or clathrin alone, determined from time-lapse TIRF movies with 200ms exposure times, 2s intervals and 4 min duration (19 cells from 3 experiments). E) Average fluorescence intensity profiles for colocalized AP2 and clathrin tracks belonging to different AP2 lifetime cohorts: 20s<t≤40s, 40s<t≤60s and 60s<t≤80s (n = 58, 37 and 16 for each cohort). The tracks are aligned so that the last detected clathrin spot is aligned to time zero. F) A representative montage showing colocalized AP2-RFP and clathrin-GFP. Circular areas of 7-pixel diameter (756nm) are shown for montages.
AP2 and clathrin dynamics were analyzed in a quantitative and automated manner (please see Extended Experimental Procedures in Supplemental Information for details). We obtained simultaneous time-lapse total internal reflection fluorescence (TIRF) images of AP2-RFP and clathrin-GFP (Movie S1–3). Imaris software was used to track fluorescent spots in individual channels. Using custom-built Matlab programs, corresponding tracks in the RFP and GFP channels were identified in a reciprocal and iterative manner (Fig. S1D). Some of the tracks that were divided into subtracks due to imperfect tracking were stitched together (Fig. S1D). If a track had a low signal-to-noise ratio (SNR) or was intersected by tracks in the vicinity, then the track was automatically excluded from further analyses. The putative abortive population is characterized by short lifetimes and weak fluorescence signals. For this reason, a lenient threshold was chosen for spot detection by the Imaris software. However, the overall SNR for a spot over its lifetime was calculated to eliminate spurious spots from our analyses. Spots of all lifetimes that started ≥ 5 frames after, or ended ≥ 5 frames before, the beginning or end of image acquisition, respectively, were analyzed for our study.
Our employment of an imaging system with higher sensitivity and the application of a new analysis scheme increased the number observed of AP2 and clathrin spots compared to our previous analyses of clathrin (Doyon et al., 2011; Grassart et al., 2014). Still, a large fraction of AP2 tracks were observed to associate with clathrin tracks (70.1%, n = 212), and the observed dynamics were consistent with the previous findings (Loerke et al., 2011). The mean lifetimes of AP2 tracks and clathrin tracks that colocalized with each other were very similar (46.68±2.67s for AP2 and 46.70±2.69 s for clathrin) (Fig. 1D, Table S2). AP2 and clathrin accumulated at similar rates and disappeared from endocytic sites almost simultaneously, confirming that these two proteins function together as core CME components (Fig. 1E, F). Consistent with the proposal that AP2 is located asymmetrically within CCPs, and as a result leaves the TIRF field earlier than clathrin, we found that AP2 intensity started to drop before clathrin intensity (Fig. 1E, F) (Saffarian and Kirchhausen, 2008). Many AP2 and clathrin spots, however, did not colocalize with each other and their lifetimes were usually much shorter than the lifetimes of the colocalized tracks (9.81±0.91s for AP2 and 11.55±0.44s for clathrin) (Fig. 1D, Table S2). Clathrin spots without AP2 were strikingly more abundant than AP2 spots without clathrin, and a large fraction of them had very short lifetimes (Fig. 1D, inset). Only 25.0% of clathrin spots colocalized with AP2 (n=596).
Machine learning based identification of authentic CME sites
In order to analyze authentic CME sites defined as those containing both AP2 and clathrin, we employed Support Vector Machine (SVM) algorithms. SVMs are the most widely used supervised machine learning algorithms. When an SVM algorithm is applied, an SVM classifier (a boundary in the form of a hyperplane in multi-dimensional feature space) is determined that best separates training data belonging to two different categories. SVM classifiers allowed us not only to quantitatively define the signature of authentic CME sites, but also to predict authenticity in single-color images of AP2 or clathrin. For reliable analysis of authentic CME dynamics, it is necessary to distinguish authentic CME sites from false CME sites marked by fluorescent clathrin or AP2, and to investigate dynamics along with another CME protein, such as dynamin.
We selected four features for SVM analysis that quantitatively describe the dynamics of the fluorescent spots. The first two features, track lifetime (feature 1) and the maximum intensity (feature 2), are often quantified in studies of CME dynamics and generally show a positive correlation (Ehrlich et al., 2004; Loerke et al., 2011; Taylor et al., 2011). Additionally, we selected two other features that measure the mobility of the spots. In contrast to single AP2 tetramers or clathrin triskelia or CCVs visiting from the cytoplasm, authentic CME sites are composed of multimolecular complexes assembled on the PM, and they are expected to show reduced lateral and vertical movement. Lateral movement was quantified as the distance between the position where the fluorescent spot first appeared and the position where it finally disappeared (feature 3). As an indirect measure of vertical movement, we used the rate of change in spot brightness (feature 4). Since TIRF illumination drops sharply as a function of the distance from the cover slip, the vertical movement of the spot will result in a sudden change in the brightness of the fluorescent spot. We hypothesized that the rate of change due to vertical movement will be much larger than the rate of change due to growth of the structure because the vertical movements in the cytoplasm occur over a few seconds, while CCP maturation generally occurs over tens of seconds or longer.
We acquired dual-color TIRF imaging datasets for AP2 and clathrin. Half of the AP2-RFP tracks captured (n = 106) were used as a training set to develop an SVM classifier. The classifier was optimized to best distinguish AP2 spots with clathrin (authentic CME sites) from those without a clathrin signal (false CME sites). The other half of the AP2 tracks (n=106) was used as to test the efficacy of the classifier, as evaluated by dual-color imaging. The SVM classifier for AP2 was able to effectively differentiate authentic CME sites marked by AP2 from false CME sites (86.6±4.2% accuracy, Table 1). Coefficients define SVM hyperplanes (classifiers), and the coefficients with larger absolute values are more important for classification. The coefficients of the SVM classifier for AP2 showed that lifetime and maximum brightness are two strong contributing features for classification of authentic CME sites marked by AP2 from false CME sites (Table 1, β1 and β2). The AP2 signals for authentic CME sites are longer-lived and brighter than the false CME sites (Fig. 2A). To evaluate the differentiating power for each feature, we calculated prediction accuracies of SVM classifiers when only one of the four features was used (Table 1). When lifetime is used as the sole feature, the classifier works with comparable accuracy to when all four features are used. The threshold was determined to be 18s, validating our previous finding that a 20s threshold is a good predictor for productive events (Grassart et al., 2014). The other three features, however, also have considerable distinguishing power, showing that the SVM classifier with all four features more accurately captures the intrinsic dynamic properties of authentic endocytic CME events, and therefore provides a more complete description of productive CME. Thus, we used all 4 features for our SVM analysis.
Table 1.
Prediction accuracy and coefficients of SVM classifiers.
| Prediction accuracy (%) | SVM coefficient | ||||
|---|---|---|---|---|---|
| AP2 | Clathrin | AP2 | Clathrin | ||
| All 4 features | 86.6±4.2 | 91.8±2.3 | β0 | 1.82 | 1.06 |
| 1. Lifetime | 86.1±4.6 | 91.2±2.2 | β1 | −2.96 | −1.73 |
| 2. Max intensity | 71.8±4.5 | 76.4±3.3 | β2 | −0.96 | −0.02 |
| 3. Displacement | 69.1±6.8 | 75.3±3.8 | β3 | −0.07 | 0.46 |
| 4. Intensity change | 69.5±6.7 | 75.9±3.9 | β4 | 0.25 | 1.22 |
Prediction accuracies were determined for SVM classifiers when all of the 4 features or one were used. Accuracy is 50% for random assignment. Coefficients define the classifying SVM hyperplane. (β1, β2, β3, β4) is the normal vector, and β0 is the bias for the hyperplane. β1- β4 correspond to the four features listed in the column 1.
Figure 2. Support Vector Machine (SVM) classifiers were calculated for identification of authentic CME sites.
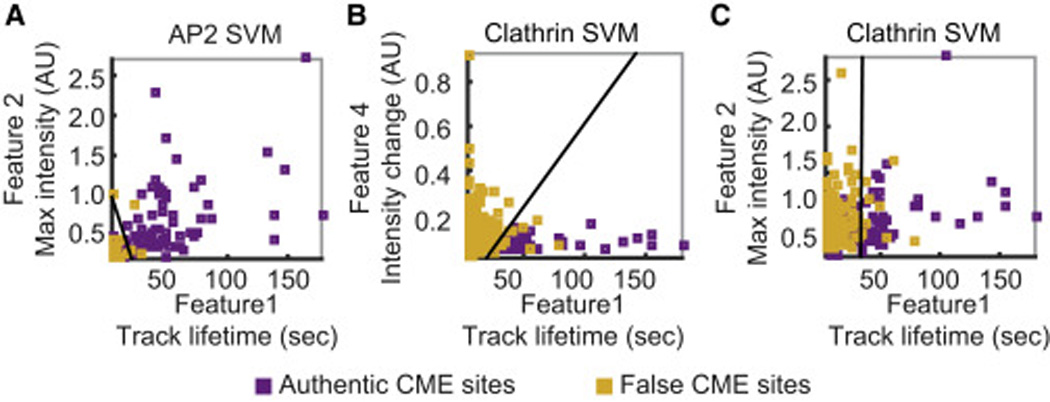
A-C) Projections of 4-dimensional (4D) features used for SVM classification onto a 2D plane. The line represents a 2D slice of an SVM hyperplane (classifier) at the mean of the other two features orthogonal to the shown plane. Purple squares represent sites with colocalized clathrin and AP2, and the yellow squares are sites with only AP2 or clathrin. A) A projection of features for AP2 sites to a plane showing feature 1 (track lifetime) and 2 (maximum intensity). B-C) A projection of features for clathrin sites to a plane showing two features (1 and 4 in B; 1 and 2 in C). Projections to all possible combinations of two features are shown in Fig. S2.
The SVM classifier for clathrin was developed in the same manner (298 clathrin tracks for training and 298 tracks for testing). The SVM classifier for clathrin also effectively differentiated authentic CME sites from false CME sites (91.8±2.3% accuracy, Table 1). The coefficients of the SVM classifier for clathrin showed that the two most important features for identifying authentic CME sites were lifetime and the rate of change in brightness (Table 1, β1 and β4). Authentic CME sites, compared to false CME sites, had longer lifetimes and showed less fluctuation in brightness, implying that the authentic CME sites marked by clathrin represent stable complexes on the PM (Fig. 2B). Unlike false AP2-marked CME sites, the false clathrin-marked CME sites were as bright as the authentic CME sites, implying that false clathrin-marked CME sites and false AP2-marked CME sites are likely to have different origins (Fig. 2A, C). To assess the differentiating power of each feature for clathrin-marked sites, we calculated prediction accuracies of SVM classifiers when only one of the four features was used (Table 1). As with AP2, spot lifetime was the strongest distinguishing feature. However, the other three features also had significant distinguishing power, validating use of all four features (Table 1).
The SVM classifiers demonstrated that AP2-RFP and clathrin-GFP dynamics at authentic CME sites are similar (longer lifetimes and slowly-changing intensity), whereas false CME sites have distinct dynamics. In order to confirm that this difference in dynamics is not due to the fact that different fluorescent proteins were fused to AP2 and clathrin, we quantitatively compared dynamics of AP2-GFP and clathrin-GFP individually in separate cell lines (Fig. S3AB). To predict if an observed fluorescent spot is an authentic CME site, we applied the SVM classifier determined from the analysis of dual color images of AP2-RFP and clathrin-GFP, to tracks extracted from single color AP2-GFP and clathrin-GFP images. The dynamic features of authentic and false CME sites in single-color cell lines were consistent with those observed in the dual-color cell lines. The percentage of fluorescent spots predicted to represent authentic CME sites in the single-color clathrin-GFP cell line (21.2±4.9%, n = 391) was similar to the percentage in the dual-color cell line expressing clathrin-GFP and AP2-RFP (25.0%). The percentage of fluorescent spots predicted to represent authentic CME sites in the single-color AP2-GFP cell line (92.2±8.0%, n = 180) was somewhat higher than the fraction of AP2-RFP spots containing clathrin-GFP in the dual-color cell line (70.1%), probably due to different photophysical characteristics of RFP and GFP (Siegel et al., 2013). However, the lifetime distributions for spots predicted to represent authentic or false CME sites in the single-color cell line were close to those for authentic or false CME sites in the dual color cell line (Fig. 1D, Fig. S3C). Mean lifetimes for the predicted authentic and false CME sites from single color images were the same within the statistical error margin as those observed in dual color cell lines (Table S2). In dual color cell lines, we observed distinct dynamics for false CME sites marked by clathrin-GFP only and those marked by AP2-RFP only (Fig. 2A–C). Consistently, in single color cell lines, we observed distinct dynamics for predicted false sites marked by clathrin-GFP and those marked by AP2-GFP (Fig. S3D,E). Maximum intensities of the predicted false and authentic CME sites marked by clathrin-GFP were equally strong, whereas the maximum intensities for predicted authentic CME sites marked by AP2-GFP were significantly stronger than for the predicted false CME sites (Fig, S3D, panel i; Fig S3E, panel i). Also, greater motility (features 3 and 4) was observed for predicted false CME sites relative to predicted authentic CME sites marked by clathrin, while this difference were not observed for AP2 spots, confirming that the fluorescent tag was not the cause of the difference between AP2 and clathrin dynamics (Fig. S2A, panel vi; Fig. S2B, panel vi).
Authentic CME sites mature over time and recruit dynamin
We next determined the fraction of CME sites containing both clathrin and AP2 that progress to productive scission by monitoring dynamin2 recruitment. From simultaneous analysis of AP2-RFP and clathrin-GFP, we found that 70.1% of the AP2-RFP spots colocalize with clathrin whereas only 25.0% of clathrin spots colocalize with AP2. As a higher fraction of AP2 spots appear to represent authentic CME sites as defined by colocalization with clathrin, we used AP2 as a marker further analysis. We created an MDA-MB-231 cell line wherein the AP2 µ subunit (AP2M1) is tagged with RFP, and dynamin2 (DNM2) is tagged with GFP (Fig. 3A, B, Table S2). We obtained time-lapse movies of the AP2-RFP/DNM2-GFP cell line using TIRF microscopy (Movie S4). 63.2±8.8% of AP2-RFP tracks recruited dynamin2-GFP (n = 318, Fig. 3B). AP2 typically accumulated at endocytic sites gradually while the majority of dynamin2 was recruited rapidly near end of the AP2 lifetime, signaling scission (Ehrlich et al., 2004; Taylor et al., 2012; Aguet et al., 2013; Grassart et al., 2014) (Fig. 3CD).
Figure 3. Authentic CME sites mature over time and recruit dynamin.
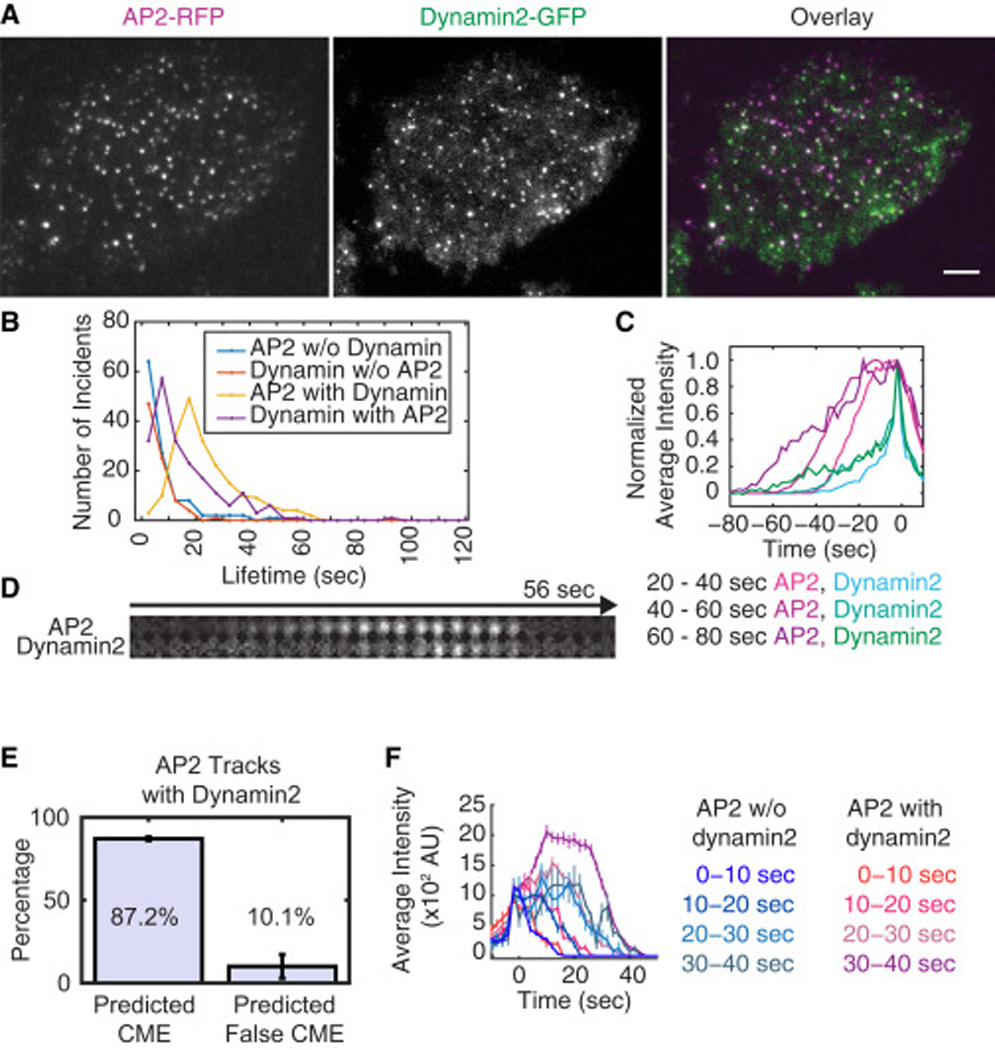
A) TIRF images of an MDA-MB-231 cell genome-edited to express DNM2-GFP/AP2M1-RFP. Scale bar = 5µm B) Histogram showing track lifetimes for colocalized or non-colocalized AP2 and dynamin2 tracks from time lapse TIRF movies with 200ms exposure times, 2s intervals and 4 min duration (11 cells from 3 experiments). The average lifetimes are shown in Table S2. C). Average profiles for associated AP2-RFP and dynamin2-GFP tracks belonging to different AP2 lifetime cohorts: 20s<t≤40s, 40s<t≤60s and 60s<t≤80s (n = 51, 79 and 26 for each cohort). The tracks are aligned to the time at which the dynamin2 maximum intensity was reached. D) Representative montage for AP2-RFP and dynamin2-GFP recruitment and disappearance. Circular areas of 7-pixel diameter are shown for montages. E) Bar graphs showing the fraction of predicted authentic and false CME sites that recruited dynamin2. F) Average intensity profiles for AP2-RFP in different lifetime cohorts: 0–10s, 10–20s, 20–30s and 30–40s. AP2 tracks followed by dynamin2 recruitment showed steady increases in intensity as a function of lifetime (n=6, 10, 38 and 47 for each cohort). AP2 tracks not followed by dynamin2 recruitment showed similar maximum intensities even if they had different lifetimes (n=71, 22, 9 and 5 for each cohort). The tracks were aligned so that the first time point of spot detection is zero. Intensity profile data for all tracks are displayed in Fig. S4A.
We built an SVM classifier for AP2 spots representing authentic CME using dual color images of AP2-RFP and clathrin-GFP (Fig. 2). To identify the spots that likely represent authentic CME events in the AP2-RFP/dynamin2-GFP cell line, we used the SVM classifier. The four dynamic features defined above - lifetime, maximum brightness, displacement and the rate of change in brightness - were calculated for AP2 spots extracted from AP2-RFP/dynamin2-GFP images. Then the SVM classifier was applied to determine whether the dynamic features of an AP2 spot are more similar to those of endocytic AP2 spots (colocalized with clathrin) or to those of AP2 spots devoid of clathrin signal. In order for the machine learning approach to work, it is crucial that experimental and imaging conditions be kept identical. Use of genome-edited cells expressing fluorescent protein fusions minimized variation in protein expression levels. Additionally, our experimental conditions were kept as consistent as possible.
The fraction of AP2-RFP spots that are predicted by the SVM classifier to represent authentic CME sites, and that also recruit dynamin2, should reflect the true CME productivity. 68.9% of the AP2 tracks were predicted to represent authentic CME events based on their dynamic features (n = 318). Essentially all of the AP2 tracks that recruited dynamin2 were predicted to represent authentic CME events based on our classifier (95.0%, n=201). Also, the vast majority of the predicted authentic CME sites, recruited dynamin2 before they disappeared (87.2±1.1%, Fig. 3E). Further validating the efficacy of our SVM classifier, AP2 spots classified as representing false CME sites rarely recruited dynamin2 (10.1± 7.2%, Fig. 3E).
AP2 and clathrin spots with longer lifetimes generally have brighter fluorescence signals, reflecting accumulation of more proteins (Ehrlich et al., 2004; Taylor et al., 2011; Aguet et al., 2013). We asked whether this trend holds for AP2 that represents authentic and false CME sites. As mentioned above, almost all of the AP2 tracks to which dynamin2 was recruited were predicted by our SVM classifier to represent authentic CME events (95.0%, n=201), and vice versa. Thus, dynamin2 recruitment to AP2 spots also is an effective indicator of CME site authenticity. We found that AP2 spots that recruit dynamin2 show positive correlations between lifetime and the brightness (Fig. 3F, Fig. S4A). In contrast, AP2 spots that do not recruit dynamin2 have constant, low AP2 signal intensities (Fig. 3F, Fig. S4A). It appears that once authentic CME sites with AP2 and clathrin are formed, the sites steadily mature into larger CCPs over time.
From initiation authentic CME sites contain both AP2 and clathrin, and have same degree of limited mobility
One of the attributes of authentic CME sites identified using the SVM classifiers for AP2 and clathrin was limited mobility. Measures for lateral movement (feature 3, the distance a spot moves over its lifetime) and vertical movement (feature 4, the average rate of change of the fluorescence signal) were both small for endocytic AP2 and clathrin spots. In contrast, false CME sites marked by clathrin are characterized by large degrees of lateral and vertical movement, confirming previous findings (Fig. S2B, panel vi) (Rappoport et al., 2003; Keyel et al., 2004). We next examined lateral spot mobility with higher precision by employing shorter-interval time-lapse imaging (5Hz), and by calculating the mean-squared displacement (MSD) (Fig. 4AB, Table 2). Mobility for spots containing both AP2 and clathrin (authentic CME sites) and for spots containing only AP2 or clathrin (false CME sites) were determined. When images were captured at a higher frame rate (5Hz), the length of the time lapse movies was limited to 30 seconds, which is shorter than the lifetimes of a substantial fraction of authentic CME sites. In order to compare the mobility of incipient CME sites with mobility of more mature CME sites, we determined MSD separately for spots containing both clathrin and AP2 (authentic CME sites) that first appeared during imaging, and for spots that already existed at the start of the movie.
Figure 4. Distinct dynamics of authentic and false CME sites.
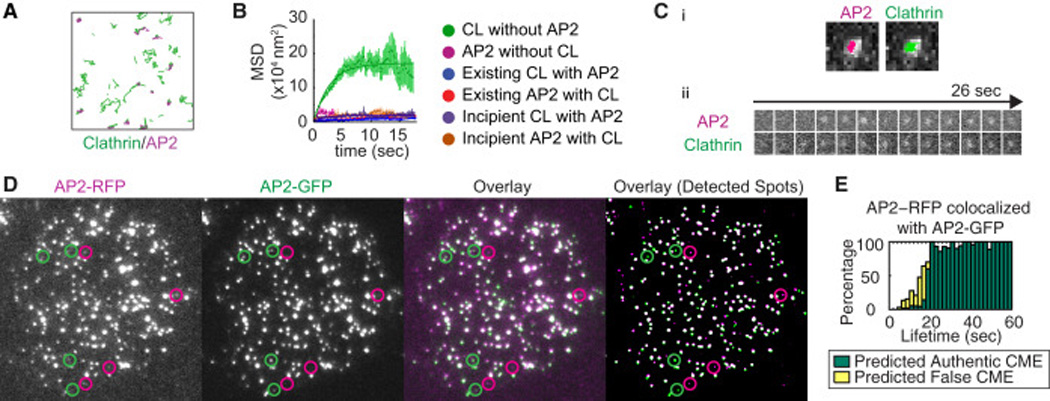
A) Clathrin and AP2 tracks obtained from 30s-long streaming images of AP2-RFP/clathrin-GFP cells. The area shown is 5.4×5.4µm2. B) MSD curves for sites containing both clathrin and AP2, and sites containing only clathrin or AP2. For sites containing both clathrin and AP2, the MSD for newly appearing sites and for pre-existing sites are shown separately. CL stands for clathrin. C) Example of an incipient CME site with colocalized AP2 and clathrin. The site shows very little movement. Ci) Tracking results overlaid with maximum-intensity projections of the TIRF images of a nascent CME site marked by AP2 (left) and clathrin (right). Cii) Montages of AP2 and clathrin for the same CME site. D) TIRF images of an MDA-MB-231 cell genome-edited to express AP2-GFP and AP2-RFP simultaneously. From the left, each panel shows the original RFP TIRF image, the original GFP TIRF image, a false-colored overlay of the two original TIRF images, and a false-colored overlay of the binary image showing the spot detection in each channel. The spots were detected using the ICY spot detection module (Chenouard et al., 2013). Circles in each panel show the position of the RFP or GFP spots that did not colocalize with a spot in the other color. E) Bar graphs showing the fraction of AP2-RFP spots containing AP2-GFP signal as a function of the lifetime. The height encompassing both yellow and green bars shows percentage of the AP2-RFP spots colocalized with AP2-GFP as a function of their lifetimes (18 cells, 4 experiments). The green bars represent predicted CME sites and the yellow bars represent predicted false CME sites.
Table 2.
Mean squared displacement
| Cell line | Classification | MSD(x104nm2) |
|---|---|---|
| AP2-RFP & Clathrin-GFP | Clathrin without AP2 | 18.06 ± 1.17 |
| AP2 without clathrin | 2.76 ± 0.54 | |
| Existing clathrin with AP2 | 1.04 ± 0.13 | |
| Existing AP2 with clathrin | 1.43 ± 0.15 | |
| Incipient clathrin with AP2 | 1.89 ± 0.16 | |
| Incipient AP2 with clathrin | 2.28 ± 0.18 | |
| AP2-GFP | AP2 with lifetimes < 20s | 2.14 ± 0.67 |
| Clathrin-GFP | Clathrin with lifetimes < 20s | 18.53 ± 1.07 |
Simultaneous tracking of clathrin and AP2 confirmed that authentic CME sites that contain both clathrin and AP2 have limited mobility, while clathrin spots representing false CME sites have higher mobility (Fig. 4A, Movie S3). Accordingly, the MSD for false CME sites marked by clathrin (without AP2) was dramatically higher than the MSD for authentic CME sites containing both AP2 and clathrin, and for false CME sites containing only AP2 (Fig. 4B, Table 2). Intriguingly, the MSD plateau values were similar for newly appearing and pre-existing CME sites, demonstrating that CME sites have the same degree of limited mobility from the beginning (Fig. 4B, C, Table 2). Movement of authentic CME sites is confined within an area on a length scale of ~100nm throughout the lifetime. Thus, from the time of their formation, authentic CME sites contain both AP2 and clathrin (Fig. 4C, (Cocucci et al., 2012)) and they have same degree of limited mobility (Fig. 4B, Table 2)
False CME sites marked by clathrin are highly mobile and short-lived, suggesting a cytoplasmic origin
Our SVM analysis showed that false CME sites marked by clathrin have short lifetimes, high fluorescence intensity and a large degree of movement (Fig. 2, S2). This population of clathrin spots could correspond to the non-CME clathrin population proposed previously (Rappoport et al., 2003; Keyel et al., 2004). We quantitatively determined the dynamics of the false CME sites marked by clathrin to shed light on their nature. Imaging at a higher frame rate (5Hz) revealed that clathrin spots without associated AP2 were extremely mobile compared to spots in other categories (colocalized clathrin/AP2 spots and AP2 spots without clathrin) (Fig. 4AB, Movie S3). The MSD curve is linear for the first ~5 s, and then plateaus at 18.06±1.17×10⁴nm2 (Fig. 4B, Table 2). These data indicate that false CME sites marked by clathrin diffuse within a space of ~500nm length scale. Considering that these clathrin spots are unlikely to be associated with the PM, however, this confinement radius should be interpreted as the area these clathrin spots explore while they are in close proximity to the PM. By fitting the linear line to the MSD curve for small t, the diffusion coefficient D can be calculated (MSD=6Dt+constant). The diffusion coefficient for these spots was D=4.3±1.5×10⁻³um2/s, (99% confidence interval). This diffusion coefficient is orders of magnitude (103–104) smaller than that of YFP molecules in cytoplasm (Kühn et al., 2011). These clathrin spots near the PM are likely to be multimolecular complexes (Keyel et al., 2004; Zhao and Keen, 2008; Brodsky, 2012). The larger mass of the clathrin complex compared to YFP molecules may partially account for the smaller diffusion coefficient. Also, the observed MSD is a 2 dimensional projection of motion in 3 dimensional space, which reduces the MSD. In addition, possible interactions with other components at or near the PM may contribute to the smaller diffusion coefficient.
The distinct dynamic characteristics of these clathrin spots are consistent with the possibility that they have a cytoplasmic origin. We determined whether any clathrin spots colocalized with the adaptor proteins AP1 and AP3. AP1 is found on CCVs trafficking from the TGN to early endosomes, while AP3 is found on CCVs trafficking from tubular endosomes to other cytoplasmic compartments, including late endosomes and lysosomes (Boehm and Bonifacino, 2001; Robinson and Bonifacino, 2001; Hirst et al., 2011). We transiently overexpressed GFP tagged σ1 or σ3a in an MDA-MB-231 cell line wherein clathrin is tagged with RFP by genome editing (Fig. S5AB). Both AP1 and AP3 spots were highly mobile (Movies S5 and S6). Many of these spots appeared transiently (Table S3) while some showed directed motion interspersed by stationary periods (Rappoport et al., 2003; Keyel et al., 2004). We found that a large fraction of AP1 and AP3 spots detected by TIRF microscopy colocalized with clathrin tracks (84.2% for AP1 and 41.4% for AP3, Fig. S5CD, Table S3). The track lifetimes for AP1 and AP3 that colocalized with clathrin were generally less than 5 seconds (Table S3). Colocalization of AP1 and AP3 with clathrin spots, and their short lifetimes, suggests that the false CME sites marked by clathrin include cytoplasmically derived CCVs visiting the TIRF field.
Dynamics of most AP2 molecules suggest they are stabilized through interactions with the plasma membrane
To determine the nature of AP2 molecules that appear not to represent authentic CME sites, we further investigated AP2 dynamics by creating an MDA-MB-231 cell line wherein the different alleles of the AP2M1 gene express RFP and GFP fusions (Fig. 4D). All of the AP2 µ subunits were tagged with either RFP or GFP (Fig. S5E). A single molecule of AP2 will appear only green or red, while multi-molecular complexes of AP2 molecules are expected to mostly appear as spots with both colors (Fig. 4D). We obtained TIRF images from the AP2-RFP/GFP cells and analyzed the dynamics of AP2-RFP and AP2-GFP spots. The fraction of the AP2-RFP spots with AP2-GFP signal increased steadily as a function of lifetime (Fig. 4E). Surprisingly, some of the observed AP2-RFP spots persist without accompanied AP2-GFP for tens of seconds. 24.8% of the spots with only an AP2-RFP signal had lifetimes longer than 10 sec (n=230). Although we cannot rule out the possibility that some of the AP2-GFP spots failed to be detected by our imaging system, the long lifetimes of AP2-RFP spots without AP2-GFP suggest that they are unlikely to be cytoplasmic single molecules. A plausible explanation is that the AP2-RFP spots without AP2-GFP are single molecules of AP2-RFP bound to the PM.
To predict whether AP2-RFP spots extracted from AP2-RFP/AP2-GFP dual color images represented authentic CME sites, we applied the SVM classifier for authentic endocytic AP2 sites determined from dual color images of AP2-RFP and clathrin-GFP. 63.3% of the AP2-RFP tracks observed in cells expressing AP2-RFP and AP2-GFP (n=626) had colocalized AP2-GFP tracks, and almost all of the AP2-RFP tracks predicted to represent authentic CME sites had an associated AP2-GFP signal (95.2±3.7%, n=375). We determined the fraction of AP2-RFP and AP2-GFP that colocalized as a function of their lifetimes (Fig. 4E). The predicted false CME sites disappear by 20 s even if the spot has both RFP and GFP signals (Fig. 4E).
Discussion
An accurate understanding of the dynamic process of CME requires that authentic CME sites be distinguishable from false CME sites. CME sites have been proposed to disassemble when they are not stabilized by cargos or by other endocytic proteins. Of all clathrin and AP2 spots that disappear without detected scission events, however, the fraction corresponding to authentic CME sites was not previously known. Here, we developed a robust tool to identify authentic CME sites and performed a detailed quantitative analysis of their dynamics. Based on a large body of previous research, we identified authentic CME sites as those that contain both clathrin and AP2, and we therefore edited human cells to express fluorescent fusion proteins of AP2 and clathrin. The characteristic dynamics that constitute a signature for authentic CME sites were identified using machine learning. When we excluded all of the false CME sites from our analyses based on machine learning, we concluded that the vast majority (~90%) of authentic CME sites recruit dynamin, signifying vesicle formation. Authentic CME sites recruit AP2 and clathrin simultaneously, and they show similarly limited mobility throughout their lifetimes.
Several previous studies attempted to distinguish different dynamic populations of clathrin sites at the PM (Loerke et al., 2009; Mettlen et al., 2009; Aguet et al., 2013). One study proposed that CME events could be divided into early abortive, late abortive and productive populations by imposing Bayesian information criteria on the lifetime distribution for single-color imaging data (Loerke et al., 2009). This study proposed that if the sum of a minimal number of model functions can fit the lifetime distribution, then each model function corresponds to a biologically distinct class of events. Subsequently, another study proposed that clathrin spots be classified as either authentic CCPs or transient clathrin structures (CSs) by applying filters to fluorescent intensity and dynamics data for clathrin alone (Aguet et al., 2013). This study proposed that the transient CSs go through single-step assembly and disassembly, which accounts for the first 6 seconds of all observed clathrin spots including both authentic CCPs and transient CS. Authentic CCPs mature beyond 6 seconds through additional steps of assembly. Thus, clathrin fluorescence intensity for the first 6 seconds was used as a threshold for distinguishing transient CSs from authentic CCPs. Also, this study excluded clathrin tracks whose brightness increased suddenly because the fast vertical movement of clathrin-coated visitors would result in such behavior. These previous studies advanced the field by suggesting possible roles for endocytic proteins and cargo in regulation of CME productivity, however the classification scheme was based on assumptions about mathematical and dynamic features of only one endocytic protein, clathrin or AP2 (Loerke et al., 2009; Mettlen et al., 2010; Aguet et al., 2013).
In order to improve the ability to identify authentic CME sites in a biologically meaningful manner, we simultaneously imaged two landmark CME proteins: AP2 and clathrin. By utilizing SVM, we identified in an unbiased and quantitative manner distinguishing dynamic features of authentic CME sites, defined as those containing both AP2 and clathrin. The authentic CME sites appear to partially overlap with the authentic CCP population defined in (Aguet et al., 2013). However, the AP2 spots that we predicted to be associated with authentic CME sites almost always recruited dynamin, whereas authentic CCPs defined in (Aguet et al., 2013) recruited dynamin only half of the time. Our use of genome-edited cells provides a possible explanation for this discrepancy. Overexpression of a fluorescent fusion protein on top of expression of the endogenous protein can render endocytosis less efficient (Doyon et al., 2011; Mettlen and Danuser, 2014). This discrepancy could also be explained if our approach combining two-color imaging and machine learning is more effective at identification of authentic CME sites than approaches taken previously (Aguet et al., 2013).
The false CME sites we identified that were marked by clathrin, but which lack AP2, likely to correspond to the transient CSs defined in (Aguet et al., 2013). The lifetime distribution of our false CME sites marked by clathrin followed a quasi-exponential decay (Fig. 1D), similar to the transient CSs in (Aguet et al., 2013). The highly variable dynamics of these clathrin spots are consistent with the filtering criteria previously established by (Aguet et al., 2013) for transient CSs.
Here, we used AP2 to represent adaptor proteins. We reasoned that majority of the CME sites should contain AP2 under normal physiological conditions. However, evidence suggests that clathrin-associated sorting proteins (CLASPs) can substitute for AP2 when AP2 is not available (Traub, 2009, 2011). In the future, it will be important to further investigate roles of CLASPs in the dynamics of authentic CME sites. Our SVM classifiers can identify authentic and productive CME sites in single-color images of AP2 and clathrin. Our SVM classifiers will allow investigation the dynamics of CLAPSs in authentic CME by simply visualizing a CLASP along with AP2 or clathrin.
Highly motile and short-lived clathrin spots often have cytoplasmic origins (Rappoport et al., 2003; Keyel et al., 2004; Zhao and Keen, 2008). We found that a subset of clathrin spots with short lifetimes colocalize with AP1 and AP3, adaptors for cytoplasmic trafficking (Fig. S5A–D), corroborating the previous findings. Gyrating clathrin (G-clathrin) are clathrin structures that contain GGA1 (Golgi-localized, gamma-ear-containing, ARF-binding protein 1) and the cation-dependent mannose-6-phosphate receptor (Zhao and Keen, 2008). They are proposed to contribute to rapid recycling (Zhao and Keen, 2008). G-clathrin structures are characterized by extremely high mobility, thus they can be robustly observed only when the exposure time is shorter than 50ms (Zhao and Keen, 2008). Our exposure time was 200ms as the expression levels of fluorescent fusion proteins is generally lower in our genome-edited cell lines than in cells in which a fusion protein is overexpressed. The abundant clathrin spots with short lifetimes that we observed may partially correspond to G-clathrin (Fig. 1D). G-clathrin are not part of CME pathway, and do not colocalize with AP2 (Zhao and Keen, 2008). Consistently, the clathrin spots we observed with extremely short lifetimes do not have AP2 signals, and they were identified as false CME sites by our application of SVM.
False CME sites marked by AP2-RFP did not colocalize with clathrin, dynamin or AP2-GFP, suggesting that these spots are likely to be single AP2 molecules. A significant fraction of them (~25%), however, have lifetimes longer than 10 seconds, and they are not very mobile. These AP2 spots are confined within an area of ~100nm (Fig. 4B, Table 2). It is unlikely that a freely diffusing single molecule in the cytoplasm is confined in such a small space over tens of seconds. A more plausible explanation is that these AP2 spots are associated with the PM. (Kelly et al., 2014) proposed that upon associating with PIP2 on the PM, AP2 autoinhibition is relieved, allowing its association with clathrin. Single PM-bound AP2 molecules might disassociate from the PM if they are not joined by clathrin in a timely manner.
We propose that CME sites are initiated when PM-bound AP2 is joined by clathrin, which triggers further recruitment of additional AP2, clathrin and other endocytic proteins. Once this pathway is initiated, the CME sites almost always proceed to CCV formation (Fig. 5). Other clathrin spots seen by TIRF microscopy likely include cytoplasmicly derived CCVs and single triskelia (Fig. 5). AP2 spots that are not associated with authentic CME sites are likely to be single molecules that associate with the PM, but then disassociate when they are not stabilized by other endocytic proteins (Fig. 5).
Figure 5. Models for authentic and false CME sites at the plasma membrane.
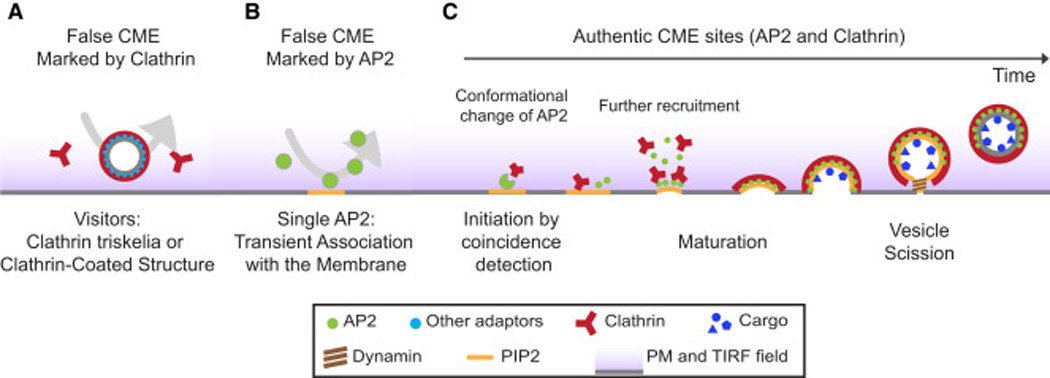
A) The false CME clathrin population includes single triskelia and cytoplasmically derived CCVs that visit the TIRF illumination field. B) The non-CME AP2 population consists of AP2 molecules that associate with the PM but quickly dissociate because they are not stabilized by other endocytic proteins. C) Authentic CME sites are initiated when clathrin joins AP2 on a PIP2-enriched part of the PM. Authentic CME sites develop as stable loci containing both AP2 and clathrin, and they mature into larger sites over time to produce CCVs (productive events). AP2 molecules are drawn as circles of different size in different panels for clarity.
Experimental procedures
Generation of genome-edited cell lines
TALENs and donors were designed to cut the AP2M1 gene locus at a site corresponding to residue 236 of the AP2 µ subunit and to insert TagGFP2 or TagRFP.t flanked by linkers. TALENs were constructed following the protocol in (Sanjana et al., 2012). For a detailed protocol for donor design, see (Dambournet et al., 2014). Plasmids expressing TALENs or ZFNs, and donor plasmids were electroporated into cells. After transfection, cells were grown at 37°C and 5% CO2 for recovery and proliferation for 5–7 days. Cells were then trypsinized and sorted for RFP-positive and/or GFP-positive signals as single cells directly into 96-well plates. Each clonal population was tested by fluorescence microscopy, genotyping and western blotting to identify true positive clones.
Total internal reflection fluorescence (TIRF) microscopy and live-cell imaging
24–48 hours prior to imaging, cells were seeded onto uncoated glass coverslips. For transient overexpression of σ1-GFP (Anitei et al., 2010) and σ3a-GFP (Kural et al., 2012), 1 day after seeding onto coverslips, the cells were transfected with 1µg of plasmid DNA. TIRF microscopy images were acquired using MetaMorph software on an Olympus IX-81 microscope. The system was maintained at 37°C during imaging. A DV2 image splitter (MAG Biosystems, Santa Fe, NM, USA) to separate GFP and RFP emission signals were used for simultaneous two-color imaging. Time-lapse movies were obtained with 200ms exposure times, 2s intervals and 4 min duration. For MSD analysis, 30s-long movies with 200ms interval and 200ms exposure were used.
Image analysis
The fluorescent spots in each fluorescent channel were tracked using Imaris (Bitplane Scientific, Zurich, Switzerland) software. Corresponding GFP and RFP tracks were associated by iterative search using a custom-built Matlab program (Fig. S1D). Tracking results that had low signal to noise ratio or that were interfered with by tracks in the vicinity were automatically excluded from further analyses.
Machine learning-based classification of authentic endocytic tracks
Lifetime, maximum intensity, displacement and the average rate of change in brightness of a spot were calculated and used as features for SVM-based classification. Half of the AP2-RFP and clathrin-GFP spots were used as training sets for SVM classifiers. The rest was used to determine the prediction accuracies of the classifiers.
For Extended Experimental Procedures, see Supplemental Information.
Supplementary Material
Acknowledgements
This work was supported by National Institutes of Health (NIH) grant R01 GM65462 to DGD. CLC was supported by NIH postdoctoral fellowship F32 GM097876. Overexpression vectors for σ1-GFP and σ3-GFP were kindly provided by Dr. Thomas Kirchhausen. We thank Daphné Dambournet, Alexandre Grassart, Jessica Marks, Julian Hassinger, and Jaewon Yang for academic discussions and critical reading of the manuscript.
Footnotes
Publisher's Disclaimer: This is a PDF file of an unedited manuscript that has been accepted for publication. As a service to our customers we are providing this early version of the manuscript. The manuscript will undergo copyediting, typesetting, and review of the resulting proof before it is published in its final citable form. Please note that during the production process errors may be discovered which could affect the content, and all legal disclaimers that apply to the journal pertain.
References
- Aguet F, Antonescu CN, Mettlen M, Schmid SL, Danuser G. Advances in analysis of low signal-to-noise images link dynamin and AP2 to the functions of an endocytic checkpoint. Dev. Cell. 2013;26:279–291. doi: 10.1016/j.devcel.2013.06.019. [DOI] [PMC free article] [PubMed] [Google Scholar]
- Anitei M, Stange C, Parshina I, Baust T, Schenck A, Raposo G, Kirchhausen T, Hoflack B. Protein complexes containing CYFIP/Sra/PIR121 coordinate Arf1 and Rac1 signalling during clathrin-AP-1-coated carrier biogenesis at the TGN. Nat. Cell Biol. 2010;12:330–340. doi: 10.1038/ncb2034. [DOI] [PMC free article] [PubMed] [Google Scholar]
- Boehm M, Bonifacino JS. Adaptins: the final recount. Mol. Biol. Cell. 2001;12:2907–2920. doi: 10.1091/mbc.12.10.2907. [DOI] [PMC free article] [PubMed] [Google Scholar]
- Boucrot E, Saffarian S, Zhang R, Kirchhausen T. Roles of AP-2 in clathrin-mediated endocytosis. PLoS One. 2010:5. doi: 10.1371/journal.pone.0010597. [DOI] [PMC free article] [PubMed] [Google Scholar]
- Brodsky FM. Diversity of clathrin function: new tricks for an old protein. Annu. Rev. Cell Dev. Biol. 2012;28:309–336. doi: 10.1146/annurev-cellbio-101011-155716. [DOI] [PubMed] [Google Scholar]
- Chenouard N, Bloch I, Olivo-Marin J-C. Multiple Hypothesis Tracking for Cluttered Biological Image Sequences. IEEE Trans. Pattern Anal. Mach. Intell. 2013 doi: 10.1109/TPAMI.2013.97. [DOI] [PubMed] [Google Scholar]
- Cocucci E, Aguet F, Boulant S, Kirchhausen T. The first five seconds in the life of a clathrin-coated pit. Cell. 2012;150:495–507. doi: 10.1016/j.cell.2012.05.047. [DOI] [PMC free article] [PubMed] [Google Scholar]
- Dambournet D, Hong SH, Grassart A, Drubin DG. Tagging Endogenous Loci for Live-Cell Fluorescence Imaging and Molecule Counting Using ZFNs, TALENs, and Cas9. Methods Enzymol. 2014;546:139–160. doi: 10.1016/B978-0-12-801185-0.00007-6. [DOI] [PubMed] [Google Scholar]
- Doherty GJ, McMahon HT. Mechanisms of endocytosis. Annu. Rev. Biochem. 2009;78:857–902. doi: 10.1146/annurev.biochem.78.081307.110540. [DOI] [PubMed] [Google Scholar]
- Doyon JB, et al. Rapid and efficient clathrin-mediated endocytosis revealed in genome-edited mammalian cells. Nat. Cell Biol. 2011;13:331–337. doi: 10.1038/ncb2175. [DOI] [PMC free article] [PubMed] [Google Scholar]
- Ehrlich M, Boll W, Van Oijen A, Hariharan R, Chandran K, Nibert ML, Kirchhausen T. Endocytosis by random initiation and stabilization of clathrin-coated pits. Cell. 2004;118:591–605. doi: 10.1016/j.cell.2004.08.017. [DOI] [PubMed] [Google Scholar]
- Grassart A, Cheng AT, Hong SH, Zhang F, Zenzer N, Feng Y, Briner DM, Davis GD, Malkov D, Drubin DG. Actin and dynamin2 dynamics and interplay during clathrin-mediated endocytosis. J. Cell Biol. 2014;205:721–735. doi: 10.1083/jcb.201403041. [DOI] [PMC free article] [PubMed] [Google Scholar]
- Hinrichsen L, Harborth J, Andrees L, Weber K, Ungewickell EJ. Effect of Clathrin Heavy Chain- and α-Adaptin-specific Small Inhibitory RNAs on Endocytic Accessory Proteins and Receptor Trafficking in HeLa Cells. J. Biol. Chem. 2003;278:45160–45170. doi: 10.1074/jbc.M307290200. [DOI] [PubMed] [Google Scholar]
- Hirst J, Barlow LD, Francisco GC, Sahlender DA, Seaman MNJ, Dacks JB, Robinson MS. The fifth adaptor protein complex. PLoS Biol. 2011;9:e1001170. doi: 10.1371/journal.pbio.1001170. [DOI] [PMC free article] [PubMed] [Google Scholar]
- Kelly BT, Graham SC, Liska N, Dannhauser PN, Höning S, Ungewickell EJ, Owen DJ. Clathrin adaptors. AP2 controls clathrin polymerization with a membrane-activated switch. Science. 2014;345:459–463. doi: 10.1126/science.1254836. [DOI] [PMC free article] [PubMed] [Google Scholar]
- Keyel PA, Mishra SK, Roth R, Heuser JE, Watkins SC, Traub LM. A single common portal for clathrin-mediated endocytosis of distinct cargo governed by cargo-selective adaptors. Mol. Biol. Cell. 2006;17:4300–4317. doi: 10.1091/mbc.E06-05-0421. [DOI] [PMC free article] [PubMed] [Google Scholar]
- Keyel PA, Watkins SC, Traub LM. Endocytic Adaptor Molecules Reveal an Endosomal Population of Clathrin by Total Internal Reflection Fluorescence Microscopy. J. Biol. Chem. 2004;279:13190–13204. doi: 10.1074/jbc.M312717200. [DOI] [PubMed] [Google Scholar]
- Kühn T, Ihalainen TO, Hyväluoma J, Dross N, Willman SF, Langowski J, Vihinen-Ranta M, Timonen J. Protein diffusion in mammalian cell cytoplasm. PLoS One. 2011:6. doi: 10.1371/journal.pone.0022962. [DOI] [PMC free article] [PubMed] [Google Scholar]
- Kural C, Tacheva-Grigorova SK, Boulant S, Cocucci E, Baust T, Duarte D, Kirchhausen T. Dynamics of intracellular clathrin/AP1- and clathrin/AP3-containing carriers. Cell Rep. 2012;2:1111–1119. doi: 10.1016/j.celrep.2012.09.025. [DOI] [PMC free article] [PubMed] [Google Scholar]
- Loerke D, Mettlen M, Schmid SL, Danuser G. Measuring the hierarchy of molecular events during clathrin-mediated endocytosis. Traffic. 2011;12:815–825. doi: 10.1111/j.1600-0854.2011.01197.x. [DOI] [PMC free article] [PubMed] [Google Scholar]
- Loerke D, Mettlen M, Yarar D, Jaqaman K, Jaqaman H, Danuser G, Schmid SL. Cargo and dynamin regulate clathrin-coated pit maturation. PLoS Biol. 2009;7:e57. doi: 10.1371/journal.pbio.1000057. [DOI] [PMC free article] [PubMed] [Google Scholar]
- McMahon HT, Boucrot E. Molecular mechanism and physiological functions of clathrin-mediated endocytosis. Nat. Rev. Mol. Cell Biol. 2011;12:517–533. doi: 10.1038/nrm3151. [DOI] [PubMed] [Google Scholar]
- Mettlen M, Danuser G. Imaging and Modeling the Dynamics of Clathrin-Mediated Endocytosis. Cold Spring Harb. Perspect. Biol. 2014;6:a017038–a017038. doi: 10.1101/cshperspect.a017038. [DOI] [PMC free article] [PubMed] [Google Scholar]
- Mettlen M, Loerke D, Yarar D, Danuser G, Schmid SL. Cargo- and adaptor-specific mechanisms regulate clathrin-mediated endocytosis. J. Cell Biol. 2010;188:919–933. doi: 10.1083/jcb.200908078. [DOI] [PMC free article] [PubMed] [Google Scholar]
- Mettlen M, Stoeber M, Loerke D, Antonescu CN, Danuser G, Schmid SL. Endocytic Accessory Proteins Are Functionally Distinguished by Their Differential Effects on the Maturation of Clathrin-coated Pits. 2009;20:3251–3260. doi: 10.1091/mbc.E09-03-0256. [DOI] [PMC free article] [PubMed] [Google Scholar]
- Motley AM, Berg N, Taylor MJ, Sahlender DA, Hirst J, Owen DJ, Robinson MS. Functional analysis of AP-2 alpha and mu2 subunits. Mol. Biol. Cell. 2006;17:5298–5308. doi: 10.1091/mbc.E06-05-0452. [DOI] [PMC free article] [PubMed] [Google Scholar]
- Rappoport JZ, Taha BW, Simon SM. Movement of plasma-membrane-associated clathrin spots along the microtubule cytoskeleton. Traffic. 2003;4:460–467. doi: 10.1034/j.1600-0854.2003.00100.x. [DOI] [PubMed] [Google Scholar]
- Robinson MS, Bonifacino JS. Adaptor-related proteins. Curr. Opin. Cell Biol. 2001;13:444–453. doi: 10.1016/s0955-0674(00)00235-0. [DOI] [PubMed] [Google Scholar]
- Saffarian S, Kirchhausen T. Differential evanescence nanometry: live-cell fluorescence measurements with 10-nm axial resolution on the plasma membrane. Biophys. J. 2008;94:2333–2342. doi: 10.1529/biophysj.107.117234. [DOI] [PMC free article] [PubMed] [Google Scholar]
- Sanjana NE, Cong L, Zhou Y, Cunniff MM, Feng G, Zhang F. A transcription activator-like effector toolbox for genome engineering. Nat. Protoc. 2012;7:171–192. doi: 10.1038/nprot.2011.431. [DOI] [PMC free article] [PubMed] [Google Scholar]
- Schmid EM, McMahon HT. Integrating molecular and network biology to decode endocytosis. Nature. 2007;448:883–888. doi: 10.1038/nature06031. [DOI] [PubMed] [Google Scholar]
- Siegel AP, Baird MA, Davidson MW, Day RN. Strengths and weaknesses of recently engineered red fluorescent proteins evaluated in live cells using fluorescence correlation spectroscopy. Int. J. Mol. Sci. 2013;14:20340–20358. doi: 10.3390/ijms141020340. [DOI] [PMC free article] [PubMed] [Google Scholar]
- Taylor MJ, Lampe M, Merrifield CJ. A feedback loop between dynamin and actin recruitment during clathrin-mediated endocytosis. PLoS Biol. 2012;10:e1001302. doi: 10.1371/journal.pbio.1001302. [DOI] [PMC free article] [PubMed] [Google Scholar]
- Taylor MJ, Perrais D, Merrifield CJ. A high precision survey of the molecular dynamics of mammalian clathrin-mediated endocytosis. PLoS Biol. 2011;9:e1000604. doi: 10.1371/journal.pbio.1000604. [DOI] [PMC free article] [PubMed] [Google Scholar]
- Traub LM. Tickets to ride: selecting cargo for clathrin-regulated internalization. Nat. Rev. Mol. Cell Biol. 2009;10:583–596. doi: 10.1038/nrm2751. [DOI] [PubMed] [Google Scholar]
- Traub LM. Regarding the amazing choreography of clathrin coats. PLoS Biol. 2011;9:e1001037. doi: 10.1371/journal.pbio.1001037. [DOI] [PMC free article] [PubMed] [Google Scholar]
- Zhao Y, Keen JH. Gyrating clathrin: Highly dynamic clathrin structures involved in rapid receptor recycling. Traffic. 2008;9:2253–2264. doi: 10.1111/j.1600-0854.2008.00819.x. [DOI] [PMC free article] [PubMed] [Google Scholar]
Associated Data
This section collects any data citations, data availability statements, or supplementary materials included in this article.