Abstract
Chronic elevation of plasma free fatty acid (FFA) levels is commonly associated with obesity, type 2 diabetes, cardiovascular disease and some cancers. Experimental evidence indicates FFA and their metabolites contribute to disease development through lipotoxicity. Previously, we identified a specific fatty acid transport inhibitor CB16.2, a.k.a. Lipofermata, using high throughput screening methods. In this study, efficacy of transport inhibition was measured in four cell lines that are models for myocytes (mmC2C12), pancreatic ß-cells (rnINS-1E), intestinal epithelial cells (hsCaco-2), and hepatocytes (hsHepG2), as well as primary human adipocytes. The compound was effective in inhibiting uptake with IC50s between 3 and 6 µM for all cell lines except human adipocytes (39 µM). Inhibition was specific for long and very long chain fatty acids but had no effect on medium chain fatty acids (C6-C10), which are transported by passive diffusion. Derivatives of Lipofermata were evaluated to understand structural contributions to activity. Lipofermata prevented palmitate-mediated oxidative stress, induction of BiP and CHOP, and cell death in a dose-dependent manner in hsHepG2 and rnINS-1E cells, suggesting it will prevent induction of fatty acid-mediated cell death pathways and lipotoxic disease by channeling excess fatty acids to adipose tissue and away from liver and pancreas. Importantly, mice dosed orally with Lipofermata were not able to absorb 13C-oleate demonstrating utility as an inhibitor of fatty acid absorption from the gut.
Keywords: FATP2 Inhibitor, Lipotoxicity, Lipid Droplet, Fatty acid transport
1. Introduction
Long-chain fatty acids (LCFAs) are vital dietary components and contribute to normal metabolic homeostasis including, for example, energy generation and storage, plasma membrane synthesis, and protein anchoring. Excess free fatty acids (FFA) are esterified and stored as triglycerides in lipid droplets in various cell types. These subcellular compartments are dynamic and stored fatty acids can be mobilized by the actions of cellular lipases in a process regulated by hormones and by proteins associated with the droplets. Apart from adipocytes, most cells have a limited capacity for lipid storage and when this capacity is exceeded, cell death may result from a process called lipotoxicity [1–3]. Current evidence indicates free fatty acids and/or their metabolites mediate cell death [2, 4, 5]. Chronic imbalances in lipid flux and metabolism often cause a variety of metabolic abnormalities and pathologies, including hyperlipidemia, type 2 diabetes mellitus (T2D), nonalcoholic fatty liver disease (NAFLD), heart disease, and some cancers [6–8]. Obesity is a common initiating condition for these diseases due to chronic hyperlipidemia and elevated free fatty acids. Lipid overload in pancreatic [β-cells may lead to dysregulated insulin secretion and apoptotic cell death, both of which may contribute to the genesis of the diabetic state [9, 10]. Lipoapoptosis is also observed in the heart and contributes to the development of heart failure [11–13]. In liver, chronically elevated fat results in a condition called non-alcoholic fatty liver disease (NAFLD) that can lead to steatohepatitis (NASH) and eventually to nonreversible cirrhosis [14, 15]. Therefore, there is much interest in preventing lipotoxicity that leads to metabolic dysfunction and disease.
The uptake of unesterified LCFAs into mammalian cells may occur either through passive diffusion or protein-mediated mechanisms [16–18]. Passive diffusion is operable in all cell types and is limited by the membrane composition, the ability of the fatty acid to flip from one side of the membrane to the other, and the presence of intracellular proteins that bind and extract the fatty acid from the membrane (e.g. FABP or acyl-CoA synthetase (Acs)). Cells and organs that are specialized in lipid metabolic processes also express proteins involved in transport of long- and very-long chain fatty acids, which are diffusion limited. Most information on protein-mediated fatty acid transport has been acquired for adipose tissue [19, 20], intestine [21], liver [22, 23], and heart [24, 25]. Specific membrane proteins that increase the uptake of LCFAs when overexpressed in cultured mammalian cells have been identified. The most prominent and best characterized of these are fatty acid translocase (FAT)/CD36 [22], the fatty acid transport proteins (FATPs) [26, 27] and long-chain fatty acyl-coenzyme A synthetase (Acsl) [16, 28, 29].
The FATPs are bifunctional proteins, which transport long chain fatty acids (LCFA) into cells and activate very long chain fatty acids (VLCFA) by esterification with coenzyme A [30]. The recent characterizations of FATP deletion (KO) and transgenic mouse strains, as well as data gained from human subjects have clearly demonstrated that FATPs are important determinants of lipid distribution among different organs and can dynamically change LCFA uptake in response to altered nutrient availability [24, 31–33]. Recently, several FATP-specific fatty acid transport inhibitors were selected in a high throughput screen against human FATP2b, a splice variant that is deficient in VLCFA activation but that retains LCFA transport activity [34]. Among the hits, CB16.2 (5’-bromo-5-phenyl- spiro[3H-1,3,4-thiadiazole-2,3’-indoline]-2’-one) now called Lipofermata was identified as a compound that specifically blocked human FATP2-mediated fatty acid uptake without impacting other cellular functions [34]. Lipofermata inhibits fatty acid uptake into HepG2 and Caco-2 cells (models for human hepatocytes and enterocytes, respectively) with high specificity and affinity [34]. Both cell lines express FATP2. In contrast, inhibition of fatty acid uptake by Lipofermata into murine 3T3L1 adipocytes, which do not express FATP2 to a significant extent, is at least 10-times less effective. This suggests Lipofermata may be a tractable tool to determine the underlying mechanistic features of FATP-dependent transport to specifically differentiate between effects on different cell types and organ systems susceptible to lipotoxicity.
In the present study, we assessed the potency of Lipofermata to inhibit fatty acid transport across the intestine in mice and in cell lines that are models for pancreatic ß cells and myocytes, as well as primary human adipocytes. The compound acts as a non-competitive inhibitor specific for long and very long chain fatty acids. However, it is ineffective in inhibiting the uptake of medium chain fatty acids (C6-C10). In mice, the compound inhibited absorption of oleate labeled with 13C. Importantly, we demonstrate that Lipofermata specifically prevents cellular dysfunction and death caused by exposure to saturated fatty acids.
2. Materials and Methods
2.1 Chemicals, reagents, and analytical methods
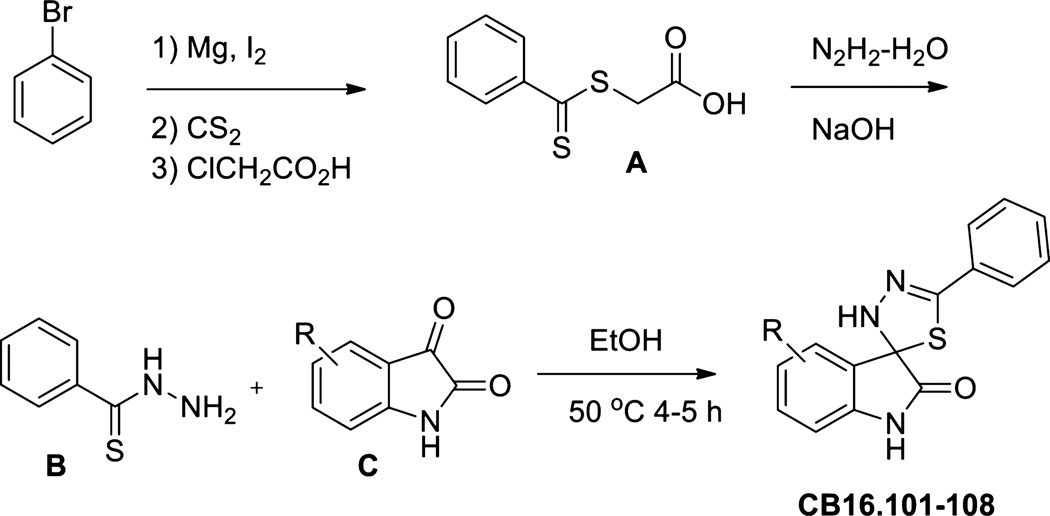
Lipofermata/CB16.2 (5-Bromo-5'-phenyl-3'H-spiro [indole-3,2'-[1,3,4] thiadiazol]-2(1H)-one) and structurally related compounds were either purchased from ChemBridge Corporation (San Diego, CA, USA) or was synthesized by the Vanderbilt Specialty Chemistry Center (Nashville, TN, USA) according to the scheme in Fig. 1. C1-BODIPY-C12 (4,4-difluoro-5-methyl-4-bora-3a,4a-diaza-s-indacene-3-dodecanoic acid), BODIPY-FL-C5 (4,4-Difluoro-5,7-Dimethyl-4-Bora-3a,4a-Diaza-s-Indacene-3-Pentanoic Acid) and BODIPY-FL-C16 (4,4-Difluoro-5,7-Dimethyl-4-Bora-3a,4a-Diaza-s-Indacene-3-Hexadecanoic Acid) were purchased from Molecular Probes/Invitrogen (Eugene, OR, USA). Tyloxapol and 13C-oleate (uniformly labeled) were obtained from Sigma-Aldrich Chemical (St. Louis, MO, USA).
Fig. 1.
Synthesis scheme for Lipofermata and structural derivatives. For details, see section 2.2.
For analytical characterization of synthesized compounds, low resolution mass spectra were obtained on an Agilent 1200 series 6130 mass spectrometer. Analytical thin layer chromatography was performed on Analtech silica gel GF 250 micron plates (Spectrum Chemical Mfg. Corp., New Brunswick, NJ). Analytical HPLC was performed on an Agilent HP1100 (Agilent Technologies, Inc., Santa Clara, CA, USA) with both UV detection at 214 and 254 nm and ELSD followed by LC/MS (J-Sphere80-C18, 3.0 × 50 mm using a 4.1 min gradient of 5%[0.05%TFA/acetonitrile]:95%[0.05%TFA/H2O] to 100%[0.05%TFA/acetonitrile]. Preparative RP-HPLC purification was performed on a Gilson preparative UV-based system (Gilson, Inc., Middleton, WI, USA) using a Phenomenex Luna C18 column (50 × 30 mm I.D., 5 µm) (Phenomenex, Torrance, CA., USA) with an acetonitrile (unmodified)-water (0.1% TFA) custom gradient. Normal-phase silica gel preparative purification was performed using an automated Combi-flash companion from ISCO (Louisville, KY, USA). Solvents for extraction, washing and chromatography were HPLC grade. All reagents were purchased from Sigma-Aldrich Chemical Co. (St. Louis, MO, USA) and were used without purification.
2.2 Synthesis of Lipofermata analogues and characterization of synthesized compounds
The synthetic route used to prepare CB16.2 (5-Bromo-5'-phenyl-3'H-spiro [indole-3,2'-[1,3,4] thiadiazol]-2(1H)-one) analogues is presented in Fig. 1. Briefly, benzothiohydrazide, B, was prepared according to literature ([35, 36] and references therein) starting from bromobenzene in a four step two-pot procedure. Initial phenylmagnesium bromide formation followed by treatment with carbon disulfide and alkylation with chloroacetic acid afforded S-(thiobenzoyl)-thioglycolic acid intermediate A in good overall yield as described [36]. Preparation of thiobenzhydrazide B: To a 1 M NaOH (20 mL, 1 equiv) solution of A (4.0 g, 18.8 mmol) was added water (20 mL) and the orange solution cooled in an ice bath. Hydrazine hydrate (3.4 g, 55%, 3.3 mL, 37.6 mmol) was added dropwise and the reaction mixture was stirred for 1.5 h. Dilute HCl was added to bring the reaction pH to 5–6 and was allowed to stir for 1 h while cooled in an ice bath. The product was collected by vacuum filtration, washed with chilled water, and air-dried. The crude product was subsequently recrystallized from ethyl acetate/hexane to yield pure benzothiohydrazide B as white crystals (1.45 g, 51%). For the preparation of spiro-thiadiazoloindolinones CB16.101, CB16.104, CB16.106, CB16.107, and CB16.108, a 1 dram vial containing respective isatin C (0.22 mmol) and benzothiohydrazide B (40 mg, 0.26 mmol) was added EtOH (2 mL). The mixture was sealed and heated for 4 hr at 50°C, cooled to room temperature, concentrated, and purified by RP-HPLC to yield final compounds (yields 10–45%, HPLC purity >98%): LC/MS (215 nm >98%) CB16.101 m/z = 296.1 [M+H]; CB16.104 m/z = 282.1 [M+H]; CB16.106 m/z = 366.1 [M+H]; CB16.107 m/z = 312.1 [M+H]; CB16.108 m/z = 298.1 [M+H].
2.3 Cell culture and reagents
Caco-2 cells (ATCC, HTB- 37) were maintained in Earl’s minimal essential medium (MEM) with 20% FBS in a 95% air 5% CO2 atmosphere at 37°C. For growth and differentiation, the BD Biosciences Intestinal Epithelium Differentiation Media Pack (BD Biosciences, Franklin Lakes, NJ, USA) was used. Cells were plated in basal seeding medium at a density of 8 × 10⁴ cells/well on a collagen-coated black/clear 96-well plate (BD Biosciences). After 72 h in culture, the basal seeding medium was removed and Entero-STIM medium (Thermo Fisher Scientific, Inc., New York, NY, USA) was added to each well. Both media contained mito-serum extender. To estimate final cell number for Caco-2 cells and all cell lines listed below, DNA was stained with Hoechst dye and results compared to a standard curve generated for each line as detailed in the BioTek® application note FL600 (BioTek, Winooski, VT, USA).
HepG2 cells (ATCC, HB- 8065) were obtained from the American Type Culture Collection and were cultured according to the supplier’s protocols. The cells were seeded in 96-well plates at a seeding density of 8 × 10⁴ cells/well.
INS-1E cells (generously provided by Pierre Maechler, Ph.D., University Medical Center of Geneva 4, Switzerland) were cultured at 37°C in a humidified atmosphere containing 5% CO2 in complete medium composed of RPMI 1640 (Thermo Fisher Scientific, Inc.) supplemented with 5% heat-inactivated fetal calf serum, 1 mM sodium pyruvate, 50 µM, 2-mercaptoethanol and 10 mM HEPES as described [37]. The maintenance culture was passaged once a week by gentle trypsinization, and cells were seeded in 96-well black/clear plates at a density of 0.2 × 10⁶ cells/well and used for experimentation after 96h.
De-identified human adipocytes (generously provided by Susan K. Fried, Ph.D., Boston University, School of Medicine) were seeded in 96-well black/clear plates at a density of 1.5 × 10⁴ cells/well and then maintained in modified MEM, Alpha Modification, with L-Glutamine, Ribo/Deoxyribonucleosides (HyClone Laboratories, GE Healthcare Life Sciences, Logan, UT, USA) and 10% FBS. For differentiation into adipocytes, cells were treated with 0.54 mM 3-isobutyl-1-methylxanthine (IBMX), 0.1µM dexamethasone, 0.5 µM human insulin, 10mg/ml transferrin, 33 µM biotin, 17 µM pantothenate, 2 nm T3 and 1 µM rosiglitazone in DMEM and 10% FBS for 48 h as detailed [38]. After 48 h incubation with differentiation medium, cells were treated with DMEM/F12 1:1, with L-Glutamine without HEPES (HyClone Laboratories) and 10% FBS supplemented with IBMX and rosiglitazone alone for 4 days, then the media was changed to differentiation media without IBMX and rosiglitazone until lipid droplets were obvious upon microscopic examination (up to 6 days).
C2C12 cells (ATCC, CRL-1772) were maintained in Dulbecco modified Eagle medium (DMEM) containing 10% fetal bovine serum (FBS) and 2 mM of L-glutamine at 37°C in a humidified atmosphere of 5% CO2 in air. For differentiation, cells were plated in differentiation medium (DMEM containing 10% horse serum) at a density of 8 × 10⁴ cells/well on a black/clear 96-well plate (BD Biosciences) for 96h.
2.4 Measurement of fatty acid uptake in selected cell lines and expression of FATP
For each cell type, fatty acid transport kinetics were evaluated according to the method described in Arias-Barrau, et al. [39]. A range of C1-BODIPY-C12 concentrations, as specified in Fig. 2, were used in a 5 min assay conducted in kinetic mode on a BioTek Synergy plate reader using Gen5.2 software. Uptake was measured every 5 sec for 5 min and rates were determined from the linear portion of the curve between 30 and 90 sec. The substrate was presented to the cells as a complex with fatty acid-free BSA to give BODIPY-FA to BSA ratios of 0.1:1 to 4:1 (2.5–100 µM C1-BODIPY-C12 and 5µM BSA). Non-cell associated fluorescence was quenched with trypan blue as described [40]. Uptake was measured at 485 nm excitation and 528 nm emission. The level of C1-BODIPY-C12 transported into the cell was calculated by conversion of the relative fluorescence units (RFU) to concentration of C1-BODIPY-C12 calculated from a standard curve generated for each lot of ligand. These experiments allowed the apparent KT and maximal rate (Vmax) of C1-BODIPY-C12 transport to be defined. The experiments were repeated three times in triplicate for each cell type and then the data was analyzed using Prism® 5.0 software. Kinetics of transport for BODIPY-FL-C5 and BODIPY-FL-C16 were defined in a similar manner.
Fig. 2.
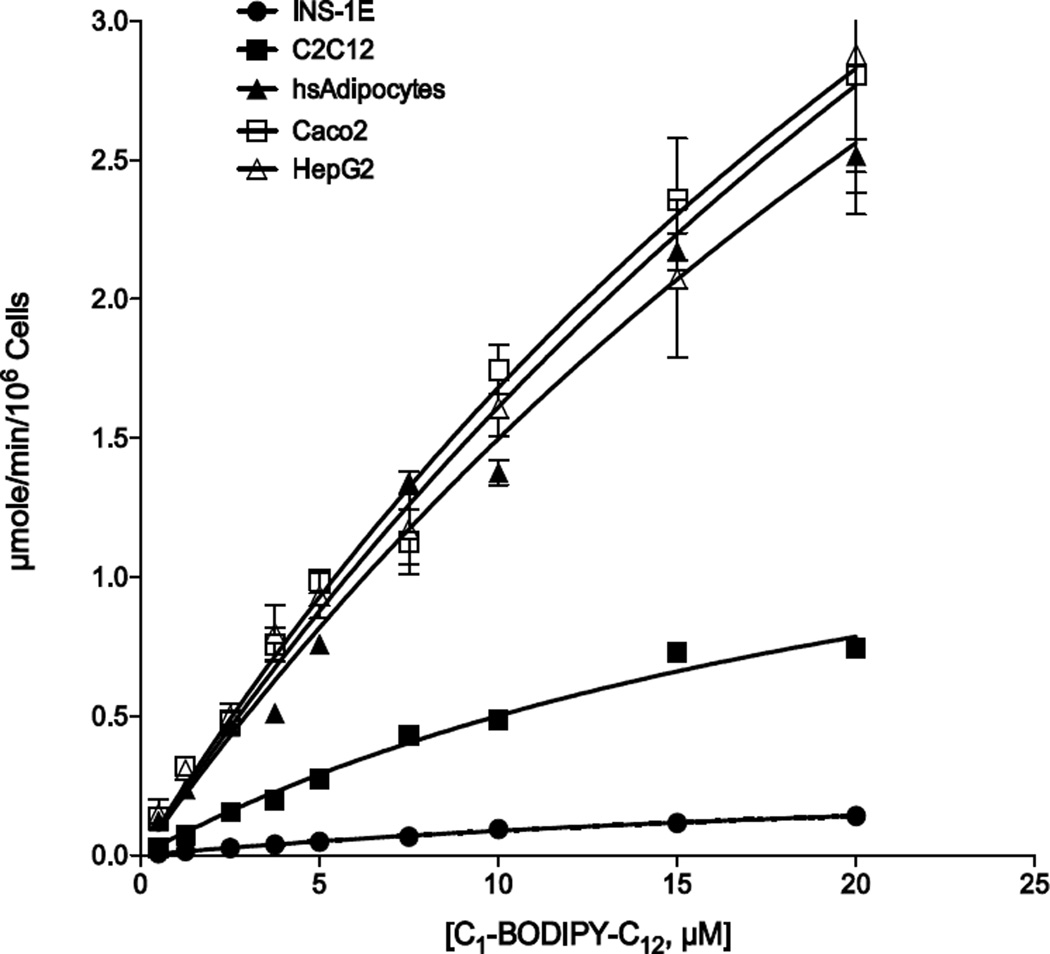
Kinetics of C1-BODIPY-C12 uptake in targeted cell lines. Fatty acid transport was measured in real-time using C1-BODIPY-C12 at 5 sec intervals for 5 min. The linear rate of uptake for each concentration of fluorescent fatty acid was determined using initial values from 30 to 90 sec and plotted as µmole/min/106 cells as indicated. The error bars represent the standard error of the mean from three independent experiments.
To assess expression of FATP1, FATP2 and FATP4, the major FATPs involved in fatty acid transport, we employed western blotting using commercial antibodies coupled with the appropriate secondary antibodies for detection using a LiCor Odyssey system (LI-COR Biosciences, Lincoln, NE, USA). Cells were grown in T25 flasks, scraped and lysed in protein extraction buffer (containing 150 mM NaCl, 50 mM Tris, 5 mM EDTA, 30 mM Na2H2P2O7, 50 mM NaF, 1% Triton X-100, 1 mM PMSF, 1% Na3VO4 and 1X complete EDTA free protease inhibitor) at 4°C with shaking for 30 min. To detect the FATP of interest, 30 µg protein from a cleared lysate was separated by sodium dodecyl sulfate-polyacrylamide electrophoresis (SDS-PAGE), transferred to nitrocellulose membrane and then incubated simultaneously with primary antibodies against β-actin (Sigma-Aldrich, St. Louis, MO, USA) and the appropriate FATP antibody. Anti-FATP2 was purchased from Abcam (Cambridge, MA, USA). FATP1 and FATP4 antibodies were from Santa Cruz Biotechnologies (Santa Cruz, CA, USA). Protein quantification was performed with the Odyssey system software.
2.5 Evaluation of Fatty Acid Transport Inhibition in Selected Cell Lines
Caco-2 cells were plated in basal seeding medium and differentiated as detailed above. HepG2 cells were cultured in EMEM (Eagle’s minimum essential media) and INS-1E cells in RPMI 1640. Differentiated adipocytes were maintained in modified DMEM (Dulbecco's Modified Eagle Medium) and 10% FBS. C2C12 cells were differentiated as detailed above. After another 24 h, cells were serum-starved for 1 h in MEM (minimum essential media) without phenol red prior to performing the BODIPY-FA transport assays [34]. In a standard reaction, serum-free MEM was removed from the wells and 50 µL of the test compound in MEM (MEM alone for controls) were added to each well and incubation was continued for 1 h. Then 50 µL of BODIPY-FA mixture (final concentrations 5µM BODIPY-FA; 5µM FFA BSA; 1.97mM Trypan blue) were added to each well and the uptake was allowed to take place for 15 min. The cell-associated fluorescence was measured in arbitrary units using filter sets of 485nm excitation and 528 nm emission as detailed above. The inhibition of fatty acid uptake activity using different chain lengths of BODIPY-FA was assessed using different concentrations of selected compounds ranging from 0.001 to 500 µM. Ligand competition curves were fit by nonlinear least-squares regression using one-site competition and dose–response models in Prism software® (GraphPad Software, Inc., San Diego, CA) in order to determine the compound concentration that reduced BODIPY fluorescence readout by 50% (IC50). KT values were determined as above. RFU were converted to concentration of BODIPY-FA in µM using a standard curve.
To evaluate the mechanism of Lipofermata inhibition of fatty acid uptake, we determined the kinetics of inhibition using 4 concentrations of C1-BODIPY-C12 (2.5 to 10.0 µM) and 11 concentrations of Lipofermata (1.25 – 20 µM). For these experiments, a BioTek Synergy Plate reader equipped with microinjectors was used to distribute the Lipofermata at the appropriate concentration and then the substrate C1-BODIPY-C12 was added to determine initial rates of uptake over 90 seconds. The resulting rates were analyzed using the enzyme kinetics module of SigmaPlot® 12.0 (Systat Software, Inc., San jose, CA, USA) to determine the best fit model of inhibition.
2.6 Evaluation of lipid droplets and nuclear integrity after palmitate treatment
To assess fatty acid-mediated cell death, palmitic acid (PA) was added to cells after conjugation with fatty acid free BSA to give the desired concentration of PA. Briefly, palmitate was dissolved in absolute ethanol at a stock concentration of 50 mM and diluted with the appropriate concentration of serum free BSA to maintain a ratio of 2.5:1 fatty acid:BSA upon dilution in culture medium. For PA treatment HepG2 cells were routinely seeded in 96-well plates at a density of 8 × 10⁴ cells/well. After overnight attachment of the cells, the culture medium was replaced by fresh MEM with 10% FBS with or without various concentrations of PA-BSA alone or with Lipofermata at the desired concentration for 24h then total intracellular lipid content was evaluated by Nile Red staining and the extent of apoptosis by DAPI staining (detailed below). Similarly, INS-1E cells were seeded in 96-well black/clear plates at a density of 2 × 10⁵ cells/well and then incubated for 96 h prior to PA and/or Lipofermata treatment for 24h.
To visualize intracellular lipid droplets, the HepG2 cells or INS-1E cells were stained with 30 µg/ml Nile Red (NR) in DMSO in the dark for 30 min at 37°C, 5% CO2. Fluorescent microscopic images (40×) were acquired using an Olympus IX-81 microscope. For quantification, cell-associated fluorescence after Nile red staining was recorded with excitation at 485/20 nm and emission at 590/35 nm spectral filter using the BioTek Synergy Plate reader. Data was expressed as relative fluorescence units (RFU) per 1 × 10⁶ cells and presented as the mean of three experiments assayed in triplicate.
To assess nuclear integrity live cells were stained with 5 µg/ml DAPI (4’,6-diamidino-2-phenylindole dihydrochloride (Sigma-Aldrich, St. Louis, MO, USA) for 30 min at 37°C , 5% CO2 and imaged at 40× magnification using an Olympus IX 81 fluorescence microscope [41, 42]. Apoptosis was quantified by measuring in arbitrary units the cell-associated DAPI fluorescence with filter sets of 360 nm excitation and 460 nm emission in the BioTek Synergy Plate reader. Data were expressed as RFU per 1 × 10⁶ cells and given as the mean of three experiments assayed in triplicate.
2.7 Assessment of ROS production, ER stress and apoptotic protein expression
The ROS-Glo™ Assay (Promega Inc. Madison, WI, USA) was used to measure the level of hydrogen peroxide (H2O2) directly in cell culture according to the manufacturer’s recommendations. Glutathione (GSH) depletion was evaluated using the GSH Glo™ Glutathione Assay (Promega, Madison, WI, USA) according to manufacturer’s protocol.
BiP, CHOP or caspase 3 expression was assessed by western blotting as described above for the FATPs (section 2.4). To detect BIP or caspase 3, 30 µg protein from a cleared lysate was separated by sodium dodecyl sulfate-polyacrylamide electrophoresis (SDS-PAGE), transferred to nitrocellulose membrane and then incubated simultaneously with primary antibodies against β-actin (Sigma-Aldrich, St. Louis, MO, USA) and the antibody of interest. In the case of CHOP, 60 µg lysate protein was used per sample. The rabbit polyclonal antibody against caspase 3, BIP or the mouse polyclonal antibody against CHOP protein were purchased from Cell Signaling Technology (Beverly, MA, USA). Protein quantification was performed with the Odyssey system software.
2.8 Assessment of uptake inhibition in mice
C57BL/6 male mice (11 weeks of age) were obtained from Jackson Laboratories 1 week prior to experimentation. Animals were housed in the AAALAC approved facility at the University of Nebraska – Lincoln (UNL) in ventilated cages at 22° C with a 14/10 h day/night cycle and were allowed free access to water and standard laboratory chow (2016 Teklad Global 16% Protein Rodent Diet (Harlan Laboratories, Indianapolis, IN, USA)). All animal studies were reviewed and approved by the Institutional Animal Care and Use Committee of UNL.
To assess inhibition of fatty acid uptake, groups of mice (4 mice per treatment per time point per experiment, 8 total) were fasted 12 h and then treated with 300mg/kg of lipofermata in flaxseed oil. Controls received a vehicle consisted of flaxseed oil alone. To inhibit lipoprotein lipase-dependent systemic fatty acid uptake, mice were injected with 500mg/kg of tyloxapol in PBS by intraperitoneal injection prior to gavage with either Lipofermata or vehicle. One hour after lipofermata administration, mice were given a bolus of flaxseed oil containing 500mg/kg of 13C18-oleate (Sigma-Aldrich, St. Louis, MO, USA). At the desired times after oleate administration (0.5, 2 and 6 h), animals were sacrificed, blood was collected via cardiac puncture in EDTA-treated tubes, and plasma was prepared.
To assess absorption of 13C18-oleate, plasma (25 µl) was extracted by the method of F olch et al [43] in the presence of 0.05% butylated hydroxytoluene. Nonadecanoic acid (10 µg) was added as an internal standard. Methyl ester formation was carried out using 1% sulfuric acid in methanol and toluene at 50°C overnight. Samples were analyzed using an Agilent 7890A gas chromatography unit linked to an Agilent 5975C VL MSD (mass selective detector) (Agilent, Palo Alto, CA, USA) using electron impact ionization. GC was performed using an Agilent CP7421 Select FAME column, 200 m × 275 m × 0.25 m. Samples (1 µl) were injected in a splitless mode with selective ion monitoring (SIM) of m/z 296 for the methyl ester of endogenous 12C oleate and m/z 314 for the methyl ester of 13C18 oleate, using 100ms dwell time per ion.
To assess absorption of Lipofermata, 40 µl of acetonitrile containing 11 ng of an internal standard (a closely related compound analogue) was mixed with 20 µl plasma. The sample was mixed, 40 µl 0.1% trifluoroacetic acid (TFA) in water was added, and the sample was gently vortexed for 5min. The samples were then centrifuged at 13,000 rpm for 5 min to remove protein and the supernatants were analyzed using LC/MS-MS. For HPLC analysis, two mobile phases used were mobile phase A containing 5/95/0.1 acetonitrile/deionized water/formic acid (vol/vol) and mobile phase B containing 95/5/0.1 (vol/vol) acetonitrile/deionized water/formic acid. Compounds were separated on a Phenomenex Gemini C18 2.1 × 50 mm, 5 µm column (Phenomenex, Torrance, CA., USA) at 40° C with a linear gradient at 0.35 mL/min, and a 5 µl injection volume. The mobile phase was held at 20% B for 1 min, increased linearly to 95% B over 3 min., held at 95% B for 2 min., and then re-equilibrated at 20% B for 4 min. For all compounds the time, entrance potential, and cell exit potential were set to 200 msec, 6 and 6 respectively. For CB16.2, q1 and q3 were set to 359.96 and 121.1 respectively while the declustering potential (dp) and collision energy (ce) were set to 47 and 34 respectively. For the internal standard, q1 and q3 were set to 287.19 and 120.87 respectively while the dp and ce were set to 35 and 26 respectively. The amount of lipofermata present in the blood was determined using a standard curve obtained using known concentrations of lipofermata and the internal standard (0.09 to 3.3ng/µl).
2.9 Statistical analysis
A minimum of 3 experiments, each assayed in triplicate, were used for statistical comparison as stated within the legends to the figures. Data were compared using JMP v11 analysis software (SAS Inst., Inc., Cary, NC, USA). Significance of difference was determined using ANOVA, Student's paired t distribution, or bivariate fit Y by X. Values were considered statistically significant at p <0.05. TIBCO Spotfire version 5.5.0 software (TIBCO Spotfire, Boston, MA, USA) was used to study structural relatedness.
3. Results
3.1 Characterization of FA transport in INS-1E, C2C12 and Human Adipocytes
To assess the efficacy of fatty acid transport inhibition by Lipofermata we initially employed HepG2 and Caco-2 cells, which are models for liver and intestinal epithelia, respectively [34]. However, fatty acid trafficking between organs has at least three additional targets that contribute to metabolic homeostasis including skeletal muscle, pancreas and adipocytes. Therefore, we selected three cell lines to model these organs, including: murine C2C12 myocytes, which form tubules in culture characteristic of myoblasts and, which import and metabolize exogenous fatty acids [44, 45]; rat INS-1E cells, which are a clonal ß-cell line that release insulin in response to glucose and are known to be susceptible to fatty acid-mediated apoptosis [37, 46, 47]; and primary human adipocytes. For each of these cell lines a live cell assay was employed to monitor the transport of fatty acids in real-time over 5 minutes using the fluorescent long-chain fatty acid analogue C1- BODIPY-C12 as previously developed in our laboratory [39]. The transport of the fluorescent long-chain fatty acid C1-BODIPYC12 in these cells lines follows typical Michaelis–Menten kinetics (Fig. 2 and Table 1). INS-1E cells were the least efficient in fatty acid transport. The Vmax value was more than 32-fold lower than that defined for adipocytes, which had the highest rates of fatty acid transport. KT values were more similar between cell lines ranging from 18.1 µM for INS-1E cells to 43.7 µM for adipocytes, indicating the affinity of uptake between cell lines was more similar than the capacity to accumulate the lipid product.
TABLE 1.
Kinetic parameters of C1-BODIPY-C12 transport in different cell types
| Vmax | KT | |
|---|---|---|
| Cell Line | µmol/min/106 cells (SEa) | µM (SE) |
| INS-1E | 17.1 ± 1.5 | 18.1 ± 4.3 |
| C2C12 | 40.1 ± 1.9 | 20.9 ± 2.6 |
| HuAdipo | 559.2 ± 57.5 | 43.7 ± 9.7 |
| Caco-2 | 63.5 ± 5.8 | 32.8 ± 7.1 |
| HepG2 | 67.3 ± 6.6 | 40.1 ± 8.7 |
SD, Standard deviation of 3 experiments done in triplicate
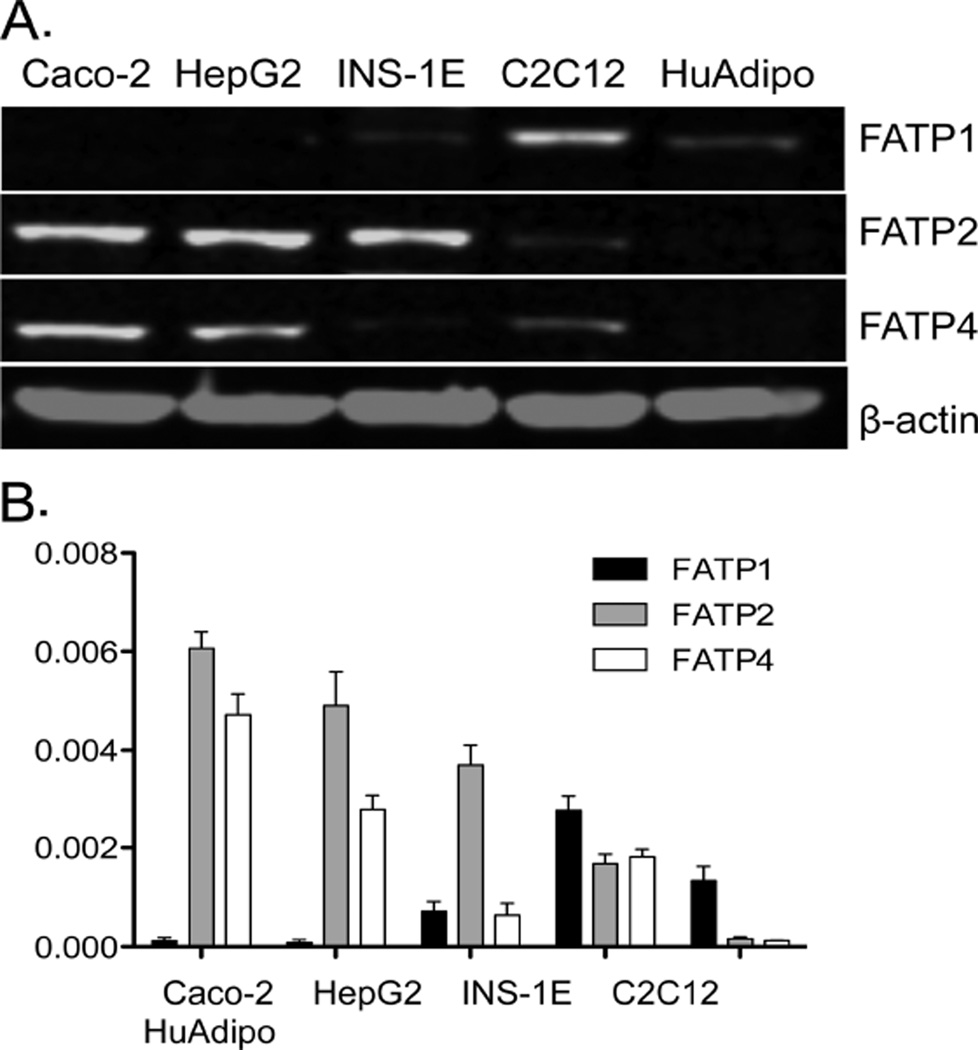
Since fatty acid transport activity has been attributed to FATP1, FATP2, and FATP4, we compared the expression level of each in the various cell lines using western blotting. As shown in Fig. 3, FATP2 and FATP4 are strongly expressed in Caco-2 and HepG2. INS-1E cells also strongly express FATP2, while FATP1 and 4 were not detected. In contrast, C2C12 myocytes primarily expressed FATP1 and, to a more minor extent, FATP2 and FATP4. Human adipocytes primarily express FATP1 and, as expected, were more resistant to the FATP2 inhibitor. These data are similar to our previous results that estimated gene expression in HepG2 and Caco-2 cells [19] and to information available in the human protein database for cells and tissues (http://www.proteinatlas.org/).
Fig. 3.
Expression of FATP proteins in various cell lines. Western blots employing antibodies against FATP1, 2 or 4 were used to measure the expression of each protein in the targeted cell lines as shown. (A) Representative western blots comparing expression of the relevant FATP compared with ß-actin used as a loading control. (B) Results were quantified using Odyssey imaging software (Li-COR, Lincoln, NE, USA). The bar height indicates the mean of three experiments assayed in triplicate. Error bars indicate standard deviation from the experimental mean.
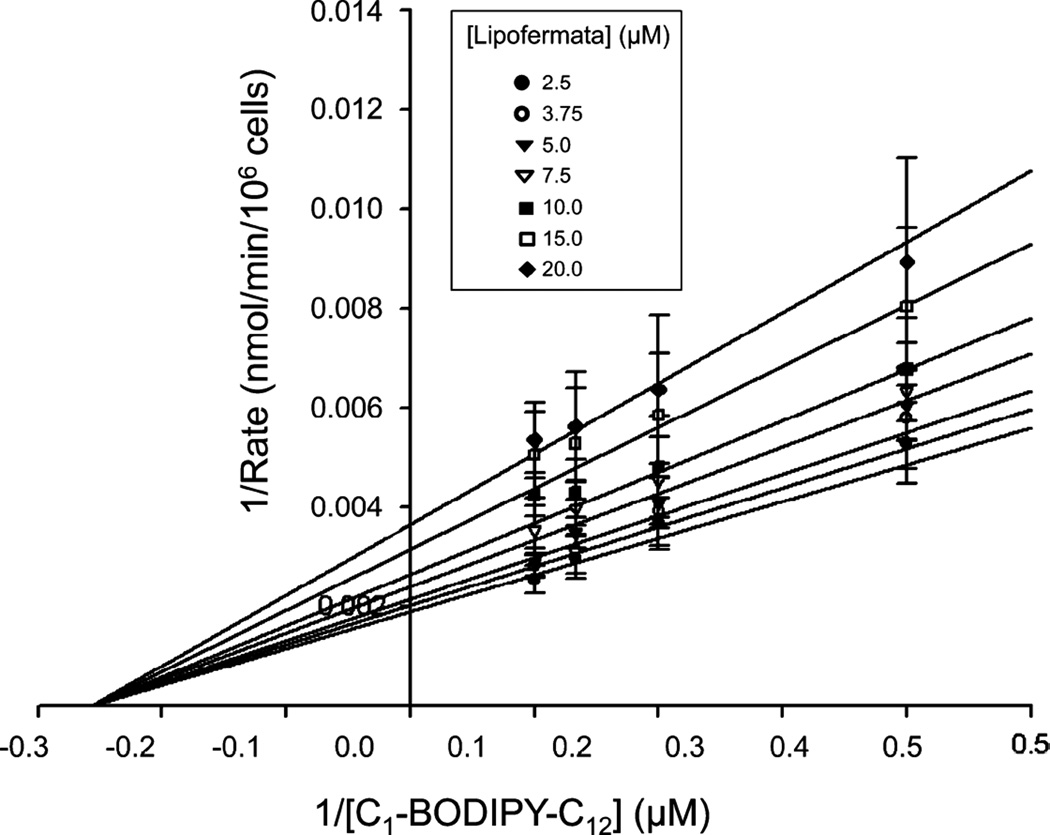
We further assessed Lipofermata-dependent inhibition of fatty acid uptake to determine the mechanism of inhibition using a standard kinetics approach. For these experiments we employed HepG2 cells and varied both C1-BODIPY-C12 and Lipofermata concentrations (Fig. 4). Since the structure of Lipofermata is very different from that of a long chain fatty acid, we expected the inhibition to be non-competitive and as seen in Fig. 4, this proved to be the case.
Fig. 4.
Kinetic assessment of Lipofermata inhibition of fatty acid uptake in HepG2 cells. The fatty acid analogue C1-BODIPY-C12 was used to evaluate the mechanism of Lipofermata inhibition of fatty acid transport. The inserted legend indicates the concentrations in µM of Lipofermata used to generate the lines. Data points are the mean and the error bars indicate the standard deviation. As shown, the data were best fit to a noncompetitive inhibition model. Analysis was performed using SigmaPlot 12 enzyme kinetics module.
3.2 Evaluation of the inhibition of fatty acid uptake by structural analogues of Lipofermata
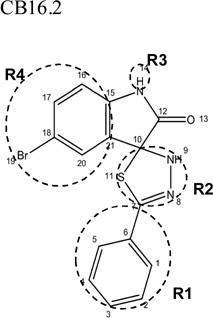
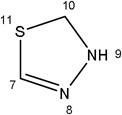
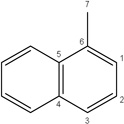
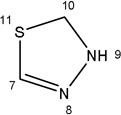
The CB16 family of compounds was identified as fatty acid transport inhibitors in a high throughput screening of humanized yeast expressing human FATP2 [34]. Only three structurally related molecules were examined in our initial report. Among these CB16.2 (5-bromo-5'-phenyl-3'H-spiro[indole-3,2'-[1,3,4]thiadiazol]-2(1H)-one) now called Lipofermata had the highest specificity and lowest IC50. In the present work, we examined additional analogues to assess structural features required for compound activity (Table 2). These analogues were evaluated in our set of five targeted cell lines to evaluate the effects of structural variations compared with the Lipofermata as the parent compound and to estimate the IC50 for transport inhibition.
Table 2.
Inhibition of fatty acid transport by Lipofermata/CB16.2 and related compounds
| Structural similarities and differences | Caco2 | HepG2 | Adipocytes | C2C12 | INS-1E | ||||
|---|---|---|---|---|---|---|---|---|---|
| Name/Designation | R1 | R2 | R3 | R4 | IC50 µM (SEM)a | ||||
 |
 |
 |
-H | 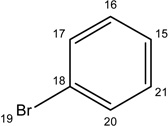 |
6.09±1.00 | 2.74±0.90 | 39.34±9.34 | 5.67±1.35 | 4.65±1.56 |
| CB16.3 | |||||||||
 |
 |
-H | 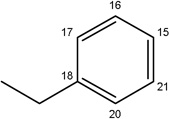 |
22.08±7.17 | 9.40±2.22 | 30.24±6.41 | 8.95±1.10 | 3.80±0.46 | |
 |
 |
-CH3 | 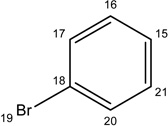 |
16.33±4.44 | 14.64±4.30 | 27.54±5.99 | 12.89±1.43 | 4.75±0.62 | |
| CB16.5 | |||||||||
 |
 |
-CH3 | 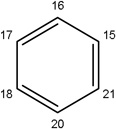 |
56.70±8.83 | 40.00±12.95 | 53.19±16.39 | 30.67±3.76 | 11.27±3.46 | |
| Missing | 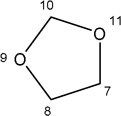 |
-H | 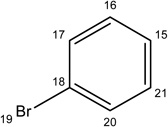 |
532.00±250 | 191.20±94 | Not effective | Not Effective |
Not Effective |
|
Data derived from log dose response curves analyzed using Prism 5.0. Values indicate the mean ± of three independent experiments.
Lipofermata inhibited C1-BODIPY-C12 transport into C2C12, INS-1E, Caco-2 and HepG2 cells at comparable levels yielding sigmoidal dose-response curves with IC50s in the low micromolar range (Table 2). Primary human adipocytes were more resistant to this compound and yielded IC50 values about 10-fold higher.
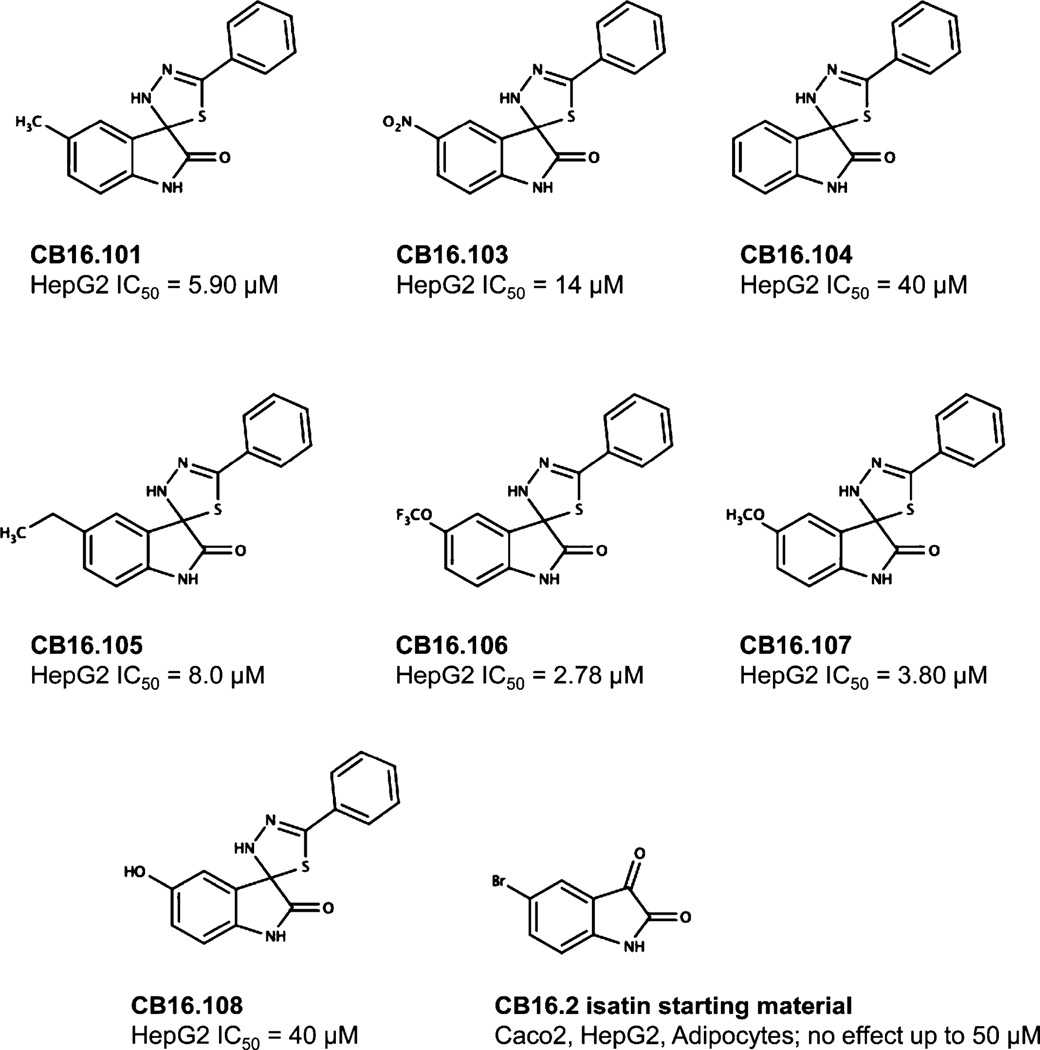
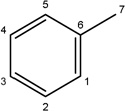
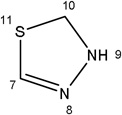
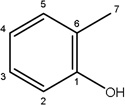
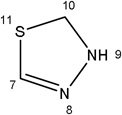
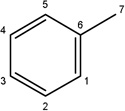
Additional analogues were tested that allowed us to assess the contribution of four different regions of the molecule to activity (Table 2). The simplest change was the addition of a methyl group to R3 on the nitrogen of the spiro-indole moiety to give CB16.4 (5-bromo-1-methyl-5'-phenyl-3'H-spiro[indole-3,2'-[1,3,4]thiadiazol]-2(1H)-one). This change caused a slight increase in the IC50 for Caco-2, HepG2 and C2C12 cells, but had no effect in adipocytes or INS-1E cells. In CB16.3 two changes in the core structure were effected to substitute an ethyl group in place of the bromine and a hydroxyl group on the phenyl ring to give 5-ethyl-5'-(2-hydroxyphenyl)-3'H-spiro [indole −3,2'- [1,3,4]thiadiazol]-2(1H)-one. Again, these changes increased the IC50s for Caco-2, HepG2 and C2C12 cells 2- to 3-fold but had no effect on the IC50 for adipocytes or INS-1E cells. Conversion of the phenyl group to a napthyl and removal of the bromine generated CB16.5 (1-methyl-5'-(1-naphthyl)-3'H-spiro[indole-3,2'-[1,3,4]thiadiazol]-2(1H)-one). These changes substantially increased the IC50 for Caco-2 (9.2-fold), HepG2 (14.8-fold), C2C12 (5.4-fold) and INS-1E (2.4 fold) cells but had a less severe effect on adipocytes, increasing the IC50 by about 35 percent. Removal of the phenyl ring (R1) and replacement of the spiro[indole-3,2'-[1,3,4]thiadiazol with spiro[1,3-dioxolane-2,3'-indol] generated CB16.6 (5'-bromo-7’-methylspiro[1,3-dioxolane-2,3'-indol]-2'(1’H)-one, a compound that was ineffective in adipocytes, C2C12 and INS-1E cells. An IC50 could be estimated for Caco-2 and HepG2 cells for this compound but was increased 87- and 70-fold respectively. Of the compounds tested in this structural class, Lipofermata remains the most effective in inhibiting long chain fatty acid transport as evaluated using the fluorescent analogue C1-BODIPY-C12. Recently, we prepared a small series of analogues to further interrogate the 5-position of the spiro-indolinone. Preliminary data in HepG2 cells indicate in some cases comparable inhibition activity. As shown in Fig.5, ether substituents such as CB16.106 bearing a trifluoromethoxy and CB16.107, containing a methoxy substituent had IC50 values below 5 µM. An analogue bearing an electron withdrawing nitro group (CB16.103) was less effective at this position (IC50 = 14 µM); however, both methyl and ethyl substituent (CB16.101 and CB16.105, respectively) had activity within two-three fold of parent CB16.2 in the HepG2 cells. Lack of a substituent at the C(5) position (CB16.104) or a simple hydroxy (CB16.108) were significantly deleterious on inhibitory activity (IC50 = 40 µM), thus highlighting the importance of this substituent as a key contributor to the overall pharmacore for inhibitory activity. Lastly, the isatin of CB16.2 was tested as a control to eliminate any potential contribution from trace starting material or hydrolytically derived by-product. Gratifyingly, in this experiment the CB16.2 isatin was found to have no effect in several cell lines, suggesting the inhibitory effects are specific to the 5'-phenyl-3'H-spiro[indoline-3,2'-[1,3,4]thiadiazol]-2-one core. Collectively, the robust SAR observed from C(5) bromine replacements, minimum pharmacophore/deletion studies, and control compounds further supports a specific interaction and role for CB16.2 in affecting long chain fatty acid transport.
Fig. 5.
Structure activity analysis of CB16.2 analogues. As shown, seven analogues and the isatin, starting material for compound synthesis, were tested for inhibition of fatty acid uptake in the standard assay employing C1-BODIPY-C12.
3.3 Assessment of transport and Lipofermata-dependent inhibition by fatty acid analogues with different chain lengths
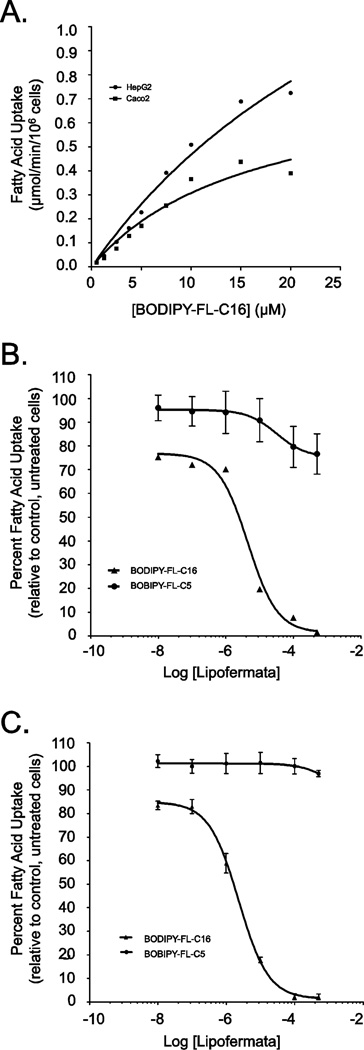
C1-BODIPY-C12 is a long chain fatty acid analogue and uptake of this compound is efficiently inhibited by Lipofermata ([34] and herein). To evaluate the effect of this compound on the transport of fatty acids with different chain lengths we employed the fluorescent medium chain fatty acid analogue BODIPY-FL-C5 and the very long chain fatty acid analogue BODIPY-FL-C16 in Caco-2 and HepG2 cells. The transport of the medium chain fatty acid analogue was not saturable and uptake was consistent with a protein-independent mechanism (data not shown). This was expected since medium chain fatty acids (C6-C10) traverse membranes by simple diffusion [48, 49]. By contrast the uptake of the very long chain fatty acid analogue BODIPY-FL-C16 was saturable, displayed typical Michaelis-Menten kinetics and yielded Vmax values of 0.81 ± 0.2 µmol/min/106 cells for Caco-2 and 2.2 ± 0.67 µmol/min/106 cells for HepG2. KT values for both cell lines were comparable (16.4 ± 7.1 µM and 37.41 ± 15.52 µM for Caco-2 and HepG2 cells, respectively) (Fig. 6A).
Fig. 6.
Kinetics of BODIPY-FL-C5 and -C16 uptake in HepG2 and Caco-2 cells and inhibition by Lipofermata. (A) Fatty acid transport rates were measured in real-time using BODIPY-FL C16 at 5 sec intervals for 5 min in HepG2 and Caco-2 cells as indicated. The linear rate of uptake was determined using initial values from 30 to 90 sec at each ligand concentration. The error bars represent the standard error of the mean from three independent experiments. Inhibition of BODIPY-FL C16 but not BODIPY- FL C5 uptake by Lipofermata occurred in a dose responsive manner in (B) HepG2 and (C) Caco-2 cells, respectively.
Lipofermata was also effective in inhibiting BODIPY-FL-C16 uptake in Caco-2 and HepG2 cells (Fig. 6B-6C), yielding IC50 values of 6 µM and 2.3 µM respectively. As expected, Lipofermata had no effect on the uptake of the medium-chain analogue BODIPY-FL-C5 in either cell type since medium chain fatty acid uptake occurs by simple diffusion (Fig. 6B-6C) [48, 49].
3.4 Lipofermata protects against palmitate induced lipid droplet accumulation and toxicity
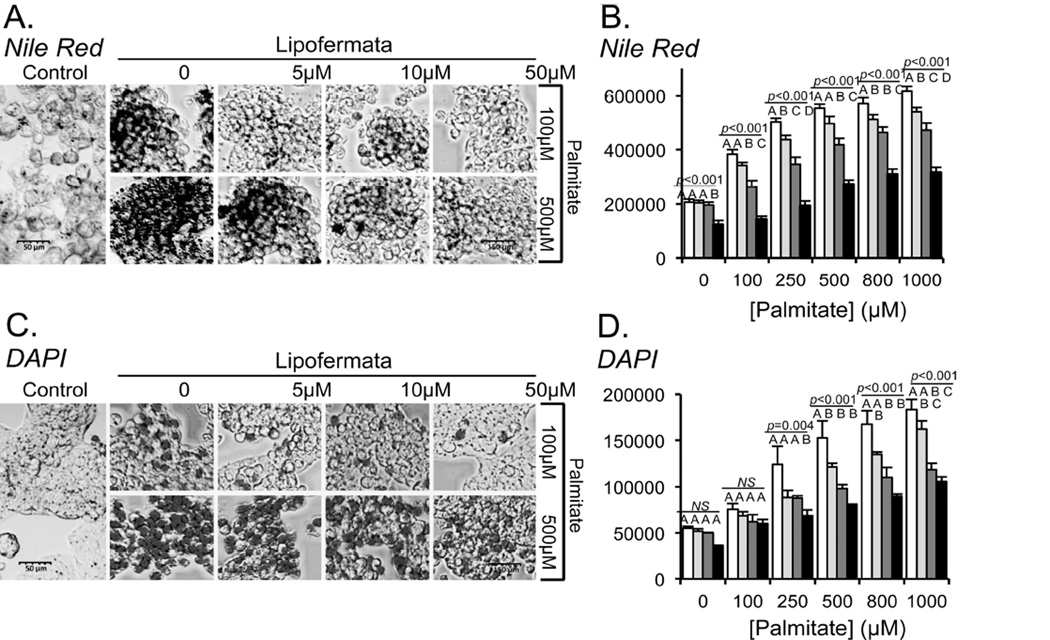
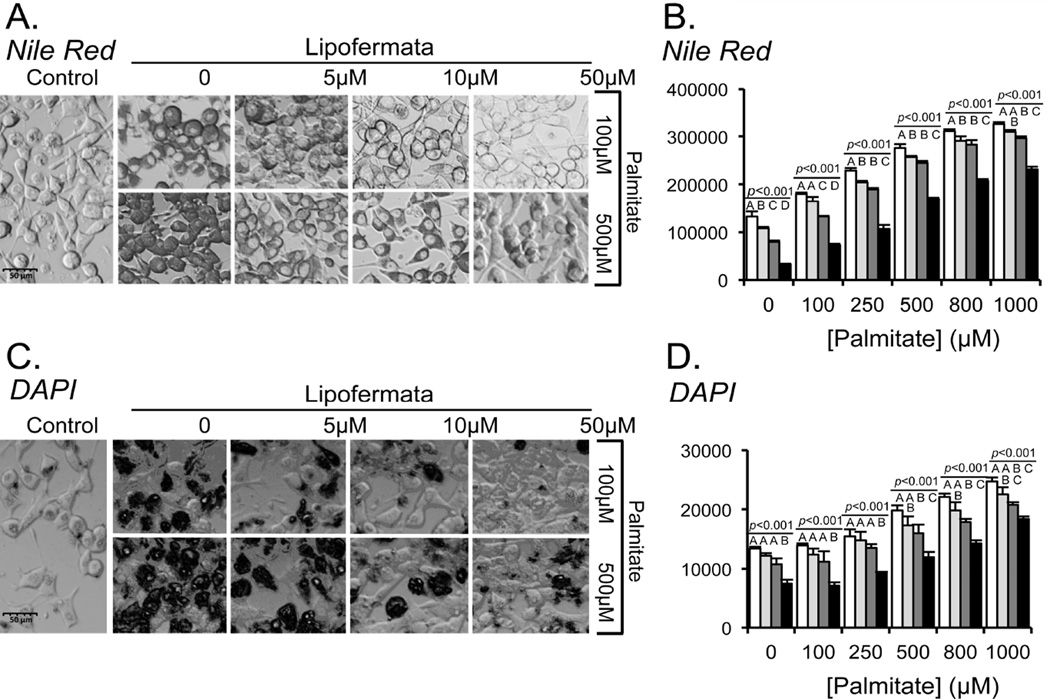
Lipotoxicity is a term used to describe the detrimental effects of lipids on cells in culture and obesity-associated organ dysfunction and failure [50, 51]. To investigate whether Lipofermata was effective in protecting against cellular toxicity caused by excessive fatty acid uptake and accumulation, we incubated HepG2 or INS-1E cells with the saturated fatty acid, palmitic acid (PA) in the absence or presence of Lipofermata. The cells were cultured with different concentrations of PA for 24h. As a control, cells were treated with equimolar concentrations of FFA-BSA alone. Lipid droplet accumulation was dependent upon the addition of PA in a dose-dependent manner as observed using confocal microscopic imaging (Figs. 7A for HepG2 and Fig. 8A for INS-1E cells, respectively) and quantitative fluorescence measurements of treated cells stained with the lipophilic dye Nile Red (Figs. 7B for HepG2 and Fig. 8B for INS-1E cells, respectively. Treatment of either cell type with PA and Lipofermata at concentrations ranging from 5–50 µM significantly attenuated lipid droplet accumulation.
Fig. 7.
Inhibition of lipid droplet accumulation and apoptosis by Lipofermata in HepG2 cells. HepG2 cells were incubated with 100 or 500 µM palmitate (PA) or with a combination of PA and Lipofermata at varying concentrations as indicated. After 24 hrs intracellular lipid droplets were evaluated using Nile Red staining and apoptosis was assessed by staining with DAPI (4’, 6-diamidino-2-phenylindole dihydrochloride). (A) and (C) Confocal microscopic images (40X magnification) shown are representative of Nile Red or DAPI stained cells, respectively. Quantification of fluorescence accumulation for (B) NR or (D) DAPI, expressed as RFU/106 cells (y-axis). Concentrations of PA were as indicated on the x-axis; white bars indicate no Lipofermata treatment, light gray bars 5µM, dark gray bars 10 µM and black bars 50 µM. The bar height indicates the mean of three experiments assayed in triplicate. Error bars indicate standard deviation from the experimental mean. The data was compared using ANOVA (JMP 11.0) for Lipofermata versus PA. Levels not connected by the same letter are significantly different.
Fig. 8.
Inhibition of lipid droplet accumulation and apoptosis by Lipofermata in INS-1E cells. INS-1E cells were treated in exactly the same manner as HepG2 cell as shown in Fig. 7 (see Fig. 7 legends for details).
To assess apoptosis of HepG2 or INS-1E cells following incubation with PA, nuclear integrity was assessed using DAPI staining of live cells. Increased DAPI staining is indicative of processes that lead to apoptotic cell death [41, 42]. The levels of apoptosis were not significantly different for those grown in the presence of ≤ 0.25 mM PA compared with control cells, while cells grown in the presence of 1 mM PA resulted in extensive loss of cell viability (Figs. 7C and 7D for HepG2 and Figs. 8C and 8D for INS-1E, respectively). Lipofermata attenuated the loss of nuclear integrity induced by PA in each cell line in a dose-dependent manner.
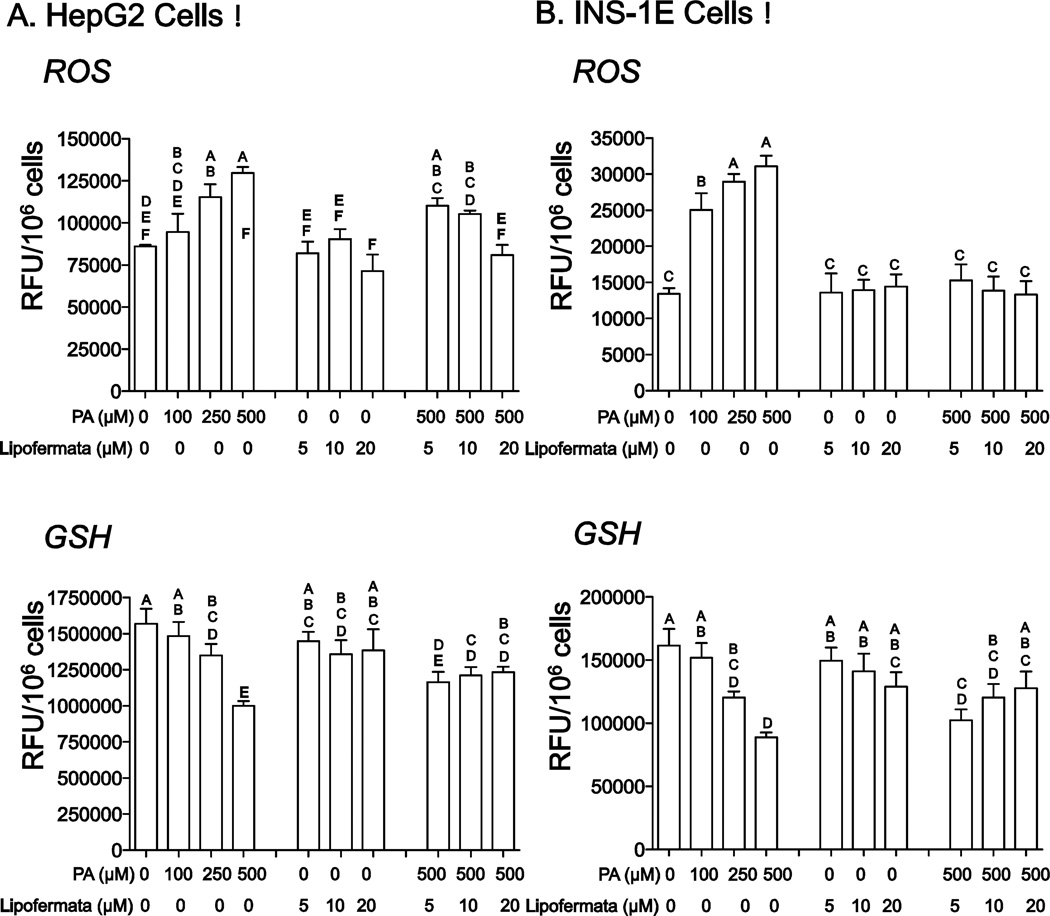
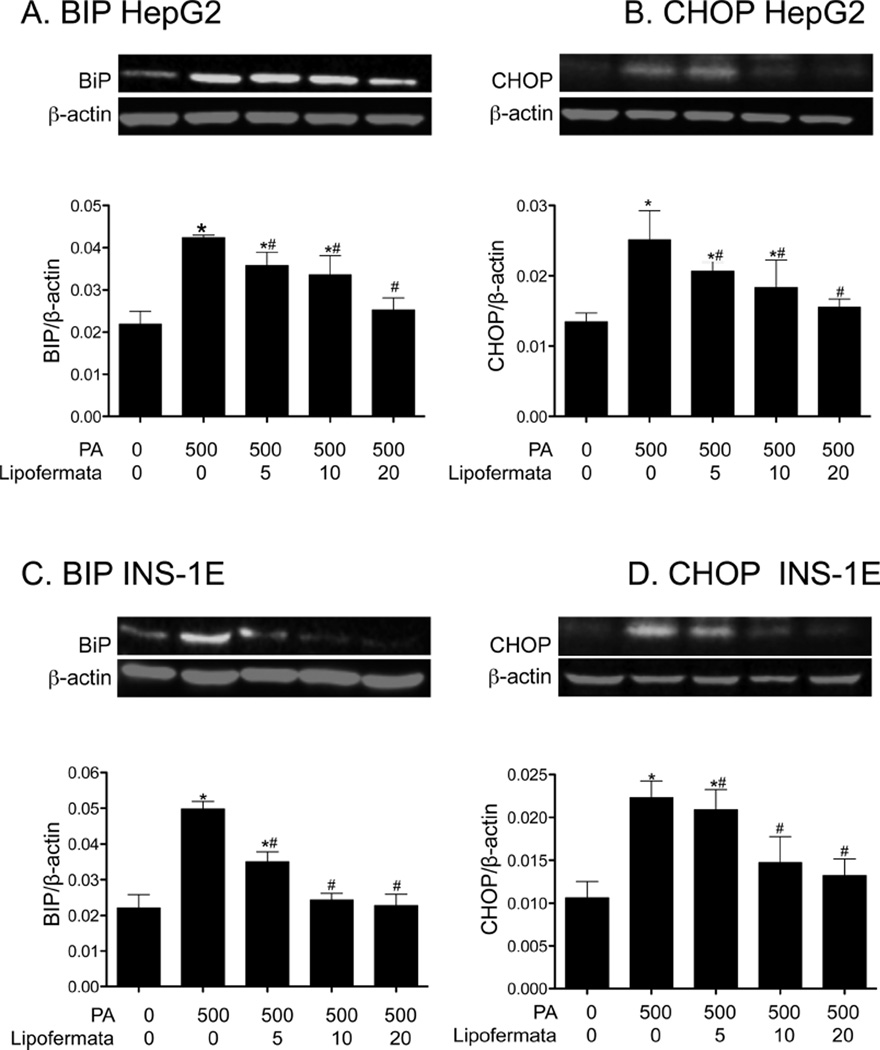
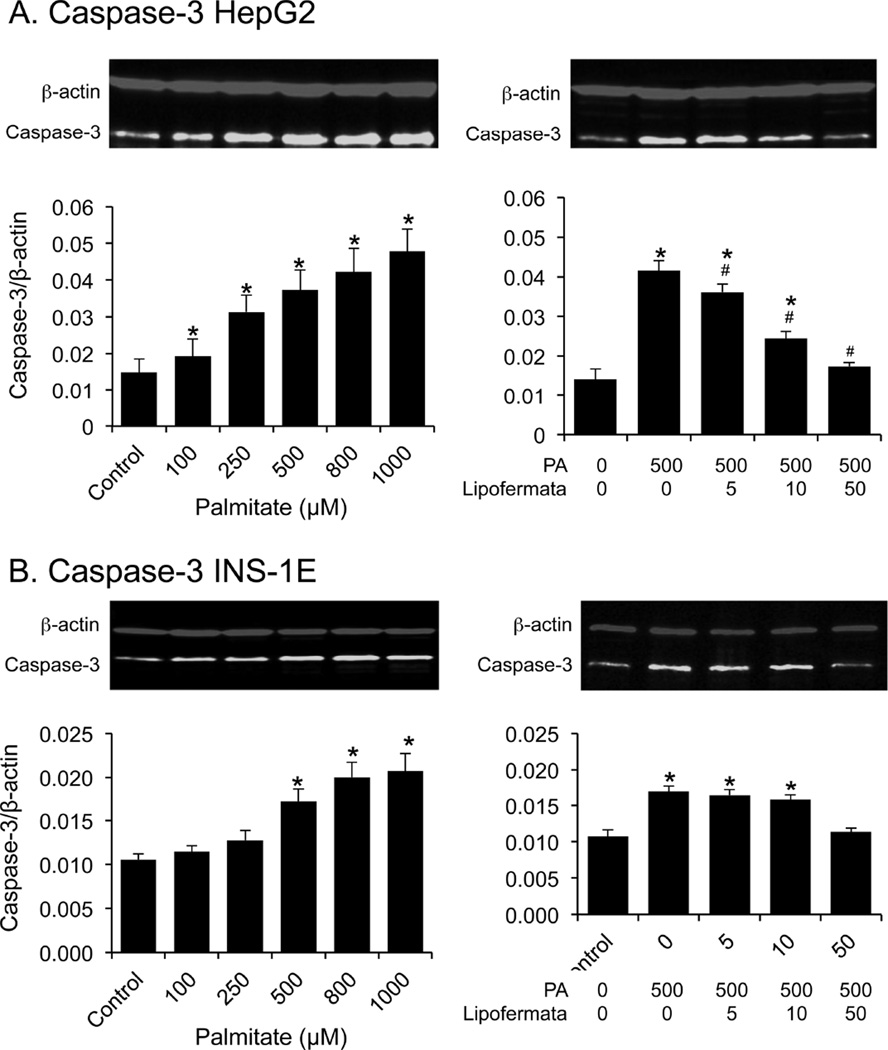
PA induced cellular toxicity is characterized by a series of events including increased oxidative stress, ER dysfunction and initiation of the apoptotic death program [3, 47, 52]. Since we predict Lipofermata protects against lipotoxicity by preventing fatty acid uptake, it should avert activation of these pathways leading to cell death. As shown in Figs. 9A and 9B, PA treatment increased the level of ROS and reduced the level of the antioxidant glutathione (GSH) in both HepG2 and INS-1E cells and, as expected, lipofermata was protective. Further, Lipofermata treatment prevented the PA-induced increase in expression of the ER chaperone BiP in both HepG2, fig 10A and INS-1E,fig 10C; limited the increase in expression of the cell death transcription factor CHOP (Figs. 10B and 10D, for HepG2 and INS-1E cells, respectively) and the caspase-3 cysteine protease (Figs. 11). Thus, Lipofermata effectively protects cells against lipotoxic cellular dysfunction at multiple levels.
Fig. 9.
Prevention of oxidative stress by Lipofermata. The levels of ROS and GSH were measured after treatment with PA with or without Lipofermata at the concentrations given. (A) HepG2 cells and (B) INS-1E cells. Bar height indicates the mean of 3 experiments. Data were compared using 2-way ANOVA. Levels not connected by the same letter are significantly different at p < 0.001 for each comparison, ROS or GSH versus PA.
Fig. 10.
Lipofermata prevents the induction of cell stress response proteins BiP and CHOP by PA treatment in HepG2 and INS-1E cells. The ER chaperone BiP and the transcription factor CHOP were quantified by western blotting. The colored figures are representative western blots. Bar height indicates the mean ± SEM for BiP or CHOP as indicated in each of the cell lines from 3 independent experiments. The expression levels were normalized to that of β-actin (red bands). *p < 0.05 for comparison to controls without palmitate or Lipofermata; #p < 0.05 for compound and palmitate treated cells compared with cells treated with 500 µM palmitate alone.
Fig. 11.
Lipofermata prevents induction of caspase-3 protein expression in HepG2 or INS-1E cells treated with palmitate. Cells were exposed to increasing concentrations of (A) palmitate, or (B) to a combination of palmitate and Lipofermata, as indicated. After 24 h of incubation, caspase-3 abundance was evaluated by Western blotting. The upper images are representative western blots. In the lower bar graphs, bar height indicates the mean ± SEM for caspase-3 of 3 experiments. The expression level of the caspase-3 (green bands) was normalized to that of β-actin (red bands). *p < 0.05 for comparison to controls without palmitate or Lipofermata; #p < 0.05 for compound and palmitate treated cells compared with cells treated with 500 µM palmitate alone.
3.5 Prevention of lipid absorption in vivo
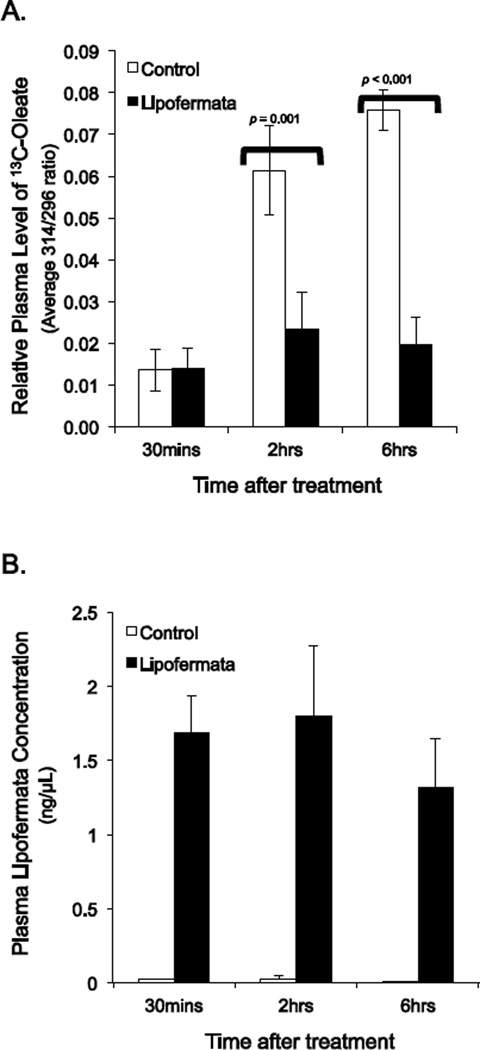
To evaluate whether Lipofermata [1] would prevent or attenuate fatty acid absorption in vivo, as predicted and [2] to estimate the compound’s absorption into the circulatory system, we conducted proof of concept tests in mice. A single dose of Lipofermata (300mg/kg) given by gavage reduced plasma levels of 13C-oleate by 57% 2 hours after oleate administration and by 74% 6 hours post-administration (Fig. 12A). The compound was absorbed to a significant extent and could be detected within 30 min of treatment (1.58 ± 0.03 ng/µl plasma; Fig. 12B). The plasma levels were stable at 2 hrs (1.52 ± 0.41 ng/µl plasma) but were reduced by about 50% at 6 hrs (0.94 ± 0.22 ng/µl plasma). These results confirm Lipofermata prevents fatty acid uptake across the intestinal epithelium and suggests it may enter the blood stream to confer inhibitory affects on fatty acid uptake in other tissues.
Fig. 12.
Inhibition of fatty acid absorption by Lipofermata in mice. Mice were dosed orally with 300 mg/kg Lipofermata for 1 h followed by 500mg/kg 13C-oleate and then plasma levels of A)13C-oleate and B) Lipofermata were measured. Bar height indicates the mean for 8 mice ± SE.
4. Discussion
In previous work, we identified several families of small molecules that attenuated the uptake of fatty acids into mammalian cells using a high throughput screening approach. Such inhibitors are of use in dissecting mechanistic information concerning FATP-dependent fatty acid transport and as attenuators of lipotoxic disease progression. While FATP1 and FATP4 inhibitors have also been reported, these were directed against the acyl-CoA synthetase activity of these FATPs and not the transport activity [53–55]. The compounds we identified were effective in disrupting FATP2-specific fatty acid transport in humanized yeast and also attenuated fatty acid uptake using cell lines that are models for hepatocytes, intestinal epithelial cells and adipocytes (murine) [34]. In the present work we focused on one compound, Lipofermata, previously called CB16.2, which had the highest efficacy, and several of its structural derivatives. Lipofermata is highly effective in inhibiting fatty acid uptake and extends our previous findings to demonstrate this compounds prevents lipid accumulation in cells that are models for myocytes (C2C12) and pancreatic ß-cells (INS-1E). The compound is less effective in inhibiting fatty acid uptake into human adipocytes, the preferred lipid storage site. Lipofermata prevents lipid droplet accumulation and the cytotoxic effects of fatty acids in HepG2 and INS-1E cells. These data support the conclusion that Lipofermata, in addition to attenuating fatty acid uptake, also has potential to protect cells from lipotoxic dysfunction and death.
Lipofermata inhibits long chain fatty acid uptake into cells [34]. The fluorescent fatty acid analogue C1-BODIPY-C12 is a useful surrogate for native fatty acids that is easily assayed, imported in a FATP-dependent manner, and is metabolized by cells and becomes integrated into complex lipids [39]. Related fluorescent fatty analogues are surrogates for medium chain fatty acids, BODIPY-FL-C5, and very long chain fatty acids, BODIPY-FL-C16. Medium chain fatty acids enter cells largely by a diffusional process that does not require a protein transporter. The uptake of BODIPY-FL-C5 displayed characteristics of simple diffusion and thus is consistent with these earlier studies. Lipofermata had no effect in attenuating medium chain fatty acid uptake in the cell types tested showing this compound is ineffective for this class of fatty acids. In contrast, the very long chain fatty acid analogue BODIPY-FL-C16 was imported into HepG2 and Caco-2 cells yielding saturable dose response curves indicative of a protein mediated process in both HepG2 and Caco-2 cells. Lipofermata inhibited uptake of BODIPY-FL-C16 with IC50s in the micromolar range that are consistent with values obtained for C1-BODIPY-C12. We conclude Lipofermata functions as an effective inhibitor of uptake of long and very long chain fatty acids. These data correlate with our previous studies using FATP2 overexpressing and knock-down cell lines treated with fatty acids labeled with stable isotopes, which demonstrated this protein mediates fatty acid uptake by the process of vectorial acylation [56, 57].
Additional Lipofermata derivatives were tested to [1] determine whether they had increased efficacy and [2] to define structural features that contributed to its activity in attenuating fatty acid uptake. The inhibitory potency of Lipofermata was not increased in any of these structural derivatives. However, several changes in the molecule were informative regarding required components of the molecule. Substitution of the 1,3,4 thiadiazol with a 1,3 dioxolane ring essentially eliminated compound efficacy. While not as severe, substitution of a napthyl ring for the phenyl at R1 also substantially reduced compound activity. Additional derivatives of Lipofermata are currently being synthesized to define and improve efficacy of novel FATP2 inhibitors.
On the basis of these findings, we suspected Lipofermata would also be useful to attenuate cellular and organ lipotoxicity, which leads to disease. The saturated fatty acid PA is a major component of the western diet and high levels of dietary intake of this fatty acid are correlated with various life style diseases including Type 2 diabetes and NAFLD [11, 58–60]. Further, PA has been shown to induce apoptosis in pancreatic β-cell lines as well as in hepatocytes [61, 62]. HepG2 and INS-1E cells grown in the presence of PA develop intracellular lipid droplets and display characteristics of apoptotic cell death. Lipofermata treatment was effective in blocking both the accumulation of lipid droplets and apoptotic cell death in a dose-dependent manner. To confirm what we suspected was lipoapoptosis various markers of PA-induced cellular dysfunction were assessed (i.e. ROS, GSH, BiP, CHOP and caspase-3 levels). In every case Lipofermata was able to prevent toxicity and activation of the cell death program. Chronic exposure of both liver and ß-cells to high levels of saturated fatty acids has been shown to induce apoptosis and disrupt cellular function thereby contributing to the pathogenesis of fatty liver disease [4, 15, 63] and type 2 diabetes [64–66]. This work clearly demonstrates Lipofermata, at relatively low concentrations (5–50 µM), promotes survival of HepG2 and INS-1E cells and protects against PA-induced lipotoxicity. Further, these findings suggest that this compound may have therapeutic potential in protecting ß-cells against lipotoxicity caused by diets high in saturated fat.
These studies are consistent with FATP2 as the target for Lipofermata. This compound inhibits FATP2-specific long chain fatty acid transport in humanized yeast cells, and in HepG2 and INS-1E cells is protective against saturated fatty acid-induced lipotoxicity and apoptosis. In contrast the compound displayed poor efficacy in adipocytes, which by comparison with the other cell lines, poorly express FATP1 and 4 and do not express FATP2. The precise mechanism underlying the protective role of Lipofermata in the progression of lipotoxicity is not well understood. This work demonstrates it functions as a noncompetitive inhibitor of fatty acid uptake, the primary metabolic target of its activity. Attenuation of the uptake of saturated fatty acids by Lipofermata, clearly demonstrates its potential as a therapeutic to address lipotoxic disease.
One of the predicted uses of lipofermata is as an inhibitor of fatty acid absorption for use in mechanistic studies in animals and, perhaps eventually, as a therapeutic. In the early animal trials reported here, Lipofermata inhibited fatty acid uptake across the gut in a time dependent manner. The compound was detectable in plasma but from the methods employed we could not determine impact on tissue fatty acid trafficking due to co-treatment with Tyloxapol. To our knowledge, there are no other compounds that inhibit fatty acid absorption in the same manner. Orlistat is an approved drug for use in inhibiting fat absorption [67]. It functions by inhibiting pancreatic lipase and thus triglyceride breakdown [68]. In this case, since the fatty acids are not released from the complex lipid, they cannot be absorbed. We envision Lipofermata as a partner in this process, which will further inhibit free fatty acid uptake.
In summary, these results demonstrate that the treatment of five different cell line with physiologic concentrations of Lipofermata blocks fatty acid transport without impacting other cellular functions, supporting the proposed neutral properties of this compound. This fatty acid transport inhibitor is most effective in cell lines subject to the toxic effects of high levels of saturated fatty acids but is less effective in fat cells, which store fatty acids as triglycerides. These properties are expected to be useful to partition potentially toxic fatty acids away from cells where they may cause dysfunction leading to NAFLD, heart failure and insulin resistant diabetes.
ACKNOWLEDGEMENTS
This work was supported by National Institutes of Health grants DK071076 and GM056840 (CCD and PNB). Probe development was supported by U54MH084659 at the Vanderbilt University Specialized Chemistry Center within the Molecular Libraries Probe Production Center Network (MLPCN).
Abbreviations
- Acsl
long chain acyl-CoA synthetase
- BiP
binding immunoglobulin protein
- BSA
bovine serum albumin
- C1-BODIPY-C12
4,4-difluoro-5-methyl-4-bora-3a,4a-diaza-s-indacene-3-dodecanoic acid
- CHOP
CCAAT/-enhancer-binding protein homologous protein
- DAPI
4’,6-diamidino-2-phenylindole
- DMSO
dimethyl sulfoxide
- EDTA
ethylenediaminetetraacetic acid
- ELSD
evaporative light scattering detection
- FA
fatty acid
- FFA
free fatty acid
- FATP2
fatty acid transport protein 2, also known as Slc27a2
- GC/MS
gas chromatography/mass spectrometry
- GSH
glutathione
- HEPES
4-(2-hydroxyethyl)-1-piperazineethanesulfonic acid)
- HPLC
high performance liquid chromatography
- LCFA
long chain fatty acid
- LC/MS
liquid chromatography/mass spectrometry
- Lipofermata
CB16.2, 5'-bromo-5-phenyl-spiro[3H-1,3,4-thiadiazole-2,3'-indoline]-2'-one
- MEM
minimum essential media
- MUFA
monounsaturated fatty acid
- NAFLD
non-alcoholic fatty liver disease
- NR
Nile Red
- PA
palmitic acid
- PMSF
phenylmethylsulfonyl fluoride
- ROS
reactive oxygen species
- RFU
relative fluorescence units
- RP-HPLC
reverse phase high performance liquid chromatography
- SFA
saturated fatty acid
- T2D
type II diabetes mellitus
- TFA
trifluoroacetic acid
- UFA
unsaturated fatty acid
- VLCFA
very long chain fatty acid
Footnotes
Publisher's Disclaimer: This is a PDF file of an unedited manuscript that has been accepted for publication. As a service to our customers we are providing this early version of the manuscript. The manuscript will undergo copyediting, typesetting, and review of the resulting proof before it is published in its final citable form. Please note that during the production process errors may be discovered which could affect the content, and all legal disclaimers that apply to the journal pertain.
References
- 1.Listenberger LL, Han X, Lewis SE, Cases S, Farese RV, Ory DS, et al. Triglyceride accumulation protects against fatty acid-induced lipotoxicity. Proc. Natl. Acad. Sci. U. S. A. 2003;100:3077–3082. doi: 10.1073/pnas.0630588100. [DOI] [PMC free article] [PubMed] [Google Scholar]
- 2.Unger RH. Lipotoxicity in the pathogenesis of obesity-dependent NIDDM. Genetic and clinical implications. Diabetes. 1995;44:863–870. doi: 10.2337/diab.44.8.863. [DOI] [PubMed] [Google Scholar]
- 3.Unger RH, Clark GO, Scherer PE, Orci L. Lipid homeostasis, lipotoxicity and the metabolic syndrome. Biochim. Biophys. Acta. 2010;1801:209–214. doi: 10.1016/j.bbalip.2009.10.006. [DOI] [PubMed] [Google Scholar]
- 4.Leamy AK, Egnatchik RA, Young JD. Molecular mechanisms and the role of saturated fatty acids in the progression of non-alcoholic fatty liver disease. Prog.Lip. Res. 2013;52:165–174. doi: 10.1016/j.plipres.2012.10.004. [DOI] [PMC free article] [PubMed] [Google Scholar]
- 5.Lee JY, Cho HK, Kwon YH. Palmitate induces insulin resistance without significant intracellular triglyceride accumulation in HepG2 cells. Metabolism: clin. exp. 2010;59:927–934. doi: 10.1016/j.metabol.2009.10.012. [DOI] [PubMed] [Google Scholar]
- 6.Garbarino J, Sturley SL. Saturated with fat: new perspectives on lipotoxicity. Curr. Opin. Clin. Nutr. Metab. Care. 2009;12:110–116. doi: 10.1097/MCO.0b013e32832182ee. [DOI] [PubMed] [Google Scholar]
- 7.Murdolo G, Piroddi M, Luchetti F, Tortoioli C, Canonico B, Zerbinati C, et al. Oxidative stress and lipid peroxidation by-products at the crossroad between adipose organ dysregulation and obesity-linked insulin resistance. Biochimie. 2013;95:585–594. doi: 10.1016/j.biochi.2012.12.014. [DOI] [PubMed] [Google Scholar]
- 8.Unger RH, Scherer PE. Gluttony, sloth and the metabolic syndrome: a roadmap to lipotoxicity. Trends Endocrinol. Metab. 2010;21:345–352. doi: 10.1016/j.tem.2010.01.009. [DOI] [PMC free article] [PubMed] [Google Scholar]
- 9.Boden G, Shulman GI. Free fatty acids in obesity and type 2 diabetes: defining their role in the development of insulin resistance and beta cell dysfunction. Eur. J. Clin. Invest. 2002;32:14–23. doi: 10.1046/j.1365-2362.32.s3.3.x. [DOI] [PubMed] [Google Scholar]
- 10.Unger RH, Zhou YT. Lipotoxicity of beta-cells in obesity and in other causes of fatty acid spillover. Diabetes. 2001;50(Suppl 1):S118–S121. doi: 10.2337/diabetes.50.2007.s118. [DOI] [PubMed] [Google Scholar]
- 11.Drosatos K, Schulze PC. Cardiac lipotoxicity: molecular pathways and therapeutic implications. Curr. Heart Fail. Rep. 2013;10:109–121. doi: 10.1007/s11897-013-0133-0. [DOI] [PMC free article] [PubMed] [Google Scholar]
- 12.Zhou Y-T, Grayburn P, Karim A, Shimabukuro M, Higa M, Baetens D, et al. Lipotoxic heart disease in obese rats: implications for human obesity. Proc. Natl. Acad. Sci. U. S. A. 2000;97:1784–1789. doi: 10.1073/pnas.97.4.1784. [DOI] [PMC free article] [PubMed] [Google Scholar]
- 13.Chiu H-C, Kovacs A, Ford DA, Hsu F-F, Garcia R, Herrero P, et al. A novel mouse model of lipotoxic cardiomyopathy. J. Clin. Invest. 2001;107:813–822. doi: 10.1172/JCI10947. [DOI] [PMC free article] [PubMed] [Google Scholar]
- 14.Egnatchik RA, Leamy AK, Noguchi Y, Shiota M, Young JD. Palmitate-induced Activation of Mitochondrial Metabolism Promotes Oxidative Stress and Apoptosis in H4IIEC3 Rat Hepatocytes. Metabolism: clin. experim. 2014;63:283–295. doi: 10.1016/j.metabol.2013.10.009. [DOI] [PMC free article] [PubMed] [Google Scholar]
- 15.Schuppan D, Schattenberg JM. Non-alcoholic steatohepatitis: pathogenesis and novel therapeutic approaches. J. Gastroenterol. Hepatol. 2013;28(Suppl. 1):68–76. doi: 10.1111/jgh.12212. [DOI] [PubMed] [Google Scholar]
- 16.Black PN, DiRusso CC. Vectorial acylation: linking fatty acid transport and activation to metabolic trafficking. Novartis Found. Symp. 2007;286:127–138. doi: 10.1002/9780470985571.ch11. discussion 138–141, 162–123, 196–203. [DOI] [PubMed] [Google Scholar]
- 17.Listenberger LL, Schaffer JE. Mechanisms of lipoapoptosis: implications for human heart disease. Trends Cardiovasc. Med. 2002;12:134–138. doi: 10.1016/s1050-1738(02)00152-4. [DOI] [PubMed] [Google Scholar]
- 18.Kazantzis M, Stahl A. Fatty acid transport proteins, implications in physiology and disease. Biochim. Biophys. Acta. 2012;1821:852–857. doi: 10.1016/j.bbalip.2011.09.010. [DOI] [PMC free article] [PubMed] [Google Scholar]
- 19.Sandoval A, Fraisl P, Arias-Barrau E, DiRusso CC, Singer D, Sealls W, et al. Fatty acid transport and activation and the expression patterns of genes involved in fatty acid trafficking. Arch. Biochem. Biophys. 2008;477:363–371. doi: 10.1016/j.abb.2008.06.010. [DOI] [PubMed] [Google Scholar]
- 20.Wu Q, Ortegon AM, Tsang B, Doege H, Feingold KR, Stahl A. FATP1 is an insulin-sensitive fatty acid transporter involved in diet-induced obesity. Molec. Cell. Biol. 2006;26:3455–3467. doi: 10.1128/MCB.26.9.3455-3467.2006. [DOI] [PMC free article] [PubMed] [Google Scholar]
- 21.Stahl A, Hirsch DJ, Gimeno RE, Punreddy S, Ge P, Watson N, et al. Identification of the major intestinal fatty acid transport protein. Molecular Cell. 1999;4:299–308. doi: 10.1016/s1097-2765(00)80332-9. [DOI] [PubMed] [Google Scholar]
- 22.Coburn CT, Hajri T, Ibrahimi A, Abumrad NA. Role of CD36 in membrane transport and utilization of long-chain fatty acids by different tissues. J. molec. Neurosci. 2001;6:117–121. doi: 10.1385/JMN:16:2-3:117. [DOI] [PubMed] [Google Scholar]
- 23.Koonen DPY, Jacobs RL, Febbraio M, Young ME, Soltys CLM, Ong H, et al. Increased hepatic CD36 expression contributes to dyslipidemia associated with diet-induced obesity. Diabetes. 2007;56:2863–2871. doi: 10.2337/db07-0907. [DOI] [PubMed] [Google Scholar]
- 24.Gimeno RE, Hirsch DJ, Punreddy S, Sun Y, Ortegon AM, Wu H, et al. Targeted deletion of fatty acid transport protein-4 results in early embryonic lethality. J. Biol. Chem. 2003;278:49512–49516. doi: 10.1074/jbc.M309759200. [DOI] [PubMed] [Google Scholar]
- 25.Glatz JF, Angin Y, Steinbusch LK, Schwenk RW, Luiken JJ. CD36 as a target to prevent cardiac lipotoxicity and insulin resistance. Prost. Leukot. Essent. Fatty Acids. 2013;88:71–77. doi: 10.1016/j.plefa.2012.04.009. [DOI] [PubMed] [Google Scholar]
- 26.Hirsch D, Stahl A, Lodish HF. A family of fatty acid transporters conserved from mycobacterium to man. Proc. Natl. Acad. Sci. U. S. A. 1998;95:8625–8629. doi: 10.1073/pnas.95.15.8625. [DOI] [PMC free article] [PubMed] [Google Scholar]
- 27.Schaffer JE, Lodish HF. Expression cloning and characterization of a novel adipocyte long chain fatty acid transport protein. Cell. 1994;79:427–436. doi: 10.1016/0092-8674(94)90252-6. [DOI] [PubMed] [Google Scholar]
- 28.Faergeman NJ, DiRusso CC, Elberger A, Knudsen J, Black PN. Disruption of the Saccharomyces cerevisiae homologue to the murine fatty acid transport protein impairs uptake and growth on long-chain fatty acids. J. Biol. Chem. 1997;272:8531–8538. doi: 10.1074/jbc.272.13.8531. [DOI] [PubMed] [Google Scholar]
- 29.Tong F, Black PN, Coleman RA, DiRusso CC. Fatty acid transport by vectorial acylation in mammals: roles played by different isoforms of rat long-chain acyl-CoA synthetases. Arch. Biochem. Biophys. 2006;447:46–52. doi: 10.1016/j.abb.2006.01.005. [DOI] [PubMed] [Google Scholar]
- 30.Watkins PA, Pevsner J, Steinberg SJ. Human very long-chain acyl-CoA synthetase and two human homologs: initial characterization and relationship to fatty acid transport protein. Prost. Leukot. Essent. Fatty Acids. 1999;60:323–328. doi: 10.1016/s0952-3278(99)80007-6. [DOI] [PubMed] [Google Scholar]
- 31.Kim JK, Gimeno RE, Higashimori T, Kim HJ, Choi H, Punreddy S, et al. Inactivation of fatty acid transport protein 1 prevents fat-induced insulin resistance in skeletal muscle. J. Clin. Invest. 2004;113:756–763. doi: 10.1172/JCI18917. [DOI] [PMC free article] [PubMed] [Google Scholar]
- 32.Hubbard B, Doege H, Punreddy S, Wu H, Huang X, Kaushik VK, et al. Mice deleted for fatty acid transport protein 5 have defective bile acid conjugation and are protected from obesity. Gastroenterology. 2006;130:1259–1269. doi: 10.1053/j.gastro.2006.02.012. [DOI] [PubMed] [Google Scholar]
- 33.Wu Q, Kazantzis M, Doege H, Ortegon AM, Tsang B, Falcon A, et al. Fatty acid transport protein 1 is required for nonshivering thermogenesis in brown adipose tissue. Diabetes. 2006;55:3229–3237. doi: 10.2337/db06-0749. [DOI] [PubMed] [Google Scholar]
- 34.Sandoval A, Chokshi A, Jesch ED, Black PN, DiRusso CC. Identification and characterization of small compound inhibitors of human FATP2. Biochem. Pharmacol. 2010;79:990–999. doi: 10.1016/j.bcp.2009.11.008. [DOI] [PMC free article] [PubMed] [Google Scholar]
- 35.Kalinowski DS, Sharpe PC, Bernhardt PV, Richardson DR. Design, synthesis, and characterization of new iron chelators with anti-proliferative activity: structure-activity relationships of novel thiohydrazone analogues. J. Med. Chem. 2007;50:6212–6225. doi: 10.1021/jm070839q. [DOI] [PubMed] [Google Scholar]
- 36.Kurzer F, Lawson A. Thiobenzoylthioglycholic acid. Organic Syntheses. 1962;42:100–102. [Google Scholar]
- 37.Merglen A, Theander S, Rubi B, Chaffard G, Wollheim CB, Maechler P. Glucose sensitivity and metabolism-secretion coupling studied during two-year continuous culture in INS-1E insulinoma cells. Endocrinol. 2004;145:667–678. doi: 10.1210/en.2003-1099. [DOI] [PubMed] [Google Scholar]
- 38.Lee MJ, Wu Y, Fried SK. A modified protocol to maximize differentiation of human preadipocytes and improve metabolic phenotypes. Obesity. 2012;20:2334–2340. doi: 10.1038/oby.2012.116. [DOI] [PMC free article] [PubMed] [Google Scholar]
- 39.Arias-Barrau E, DiRusso CC, Black PN. Methods to monitor Fatty Acid transport proceeding through vectorial acylation. Meth. Molec. Biol. 2009;580:233–249. doi: 10.1007/978-1-60761-325-1_13. [DOI] [PubMed] [Google Scholar]
- 40.Li H, Black PN, DiRusso CC. A live-cell high-throughput screening assay for identification of fatty acid uptake inhibitors. Analyt. Biochem. 2005;336:11–19. doi: 10.1016/j.ab.2004.09.025. [DOI] [PubMed] [Google Scholar]
- 41.Akazawa Y, Cazanave S, Mott JL, Elmi N, Bronk SF, Kohno S, et al. Palmitoleate attenuates palmitate-induced Bim and PUMA up-regulation and hepatocyte lipoapoptosis. J. Hepatol. 2010;52:586–593. doi: 10.1016/j.jhep.2010.01.003. [DOI] [PMC free article] [PubMed] [Google Scholar]
- 42.Kakisaka K, Cazanave SC, Fingas CD, Guicciardi ME, Bronk SF, Werneburg NW, et al. Mechanisms of lysophosphatidylcholine-induced hepatocyte lipoapoptosis. Am. J. Physiol. Gastrointest. Liver Physiol. 2012;302:G77–G84. doi: 10.1152/ajpgi.00301.2011. [DOI] [PMC free article] [PubMed] [Google Scholar]
- 43.Folch J, Lees M, Sloane Stanley GH. A simple method for the isolation and purification of total lipides from animal tissues. J. Biol. Chem. 1957;226:497–509. [PubMed] [Google Scholar]
- 44.Bastie CC, Hajri T, Drover VA, Grimaldi PA, Abumrad NA. CD36 in myocytes channels fatty acids to a lipase-accessible triglyceride pool that is related to cell lipid and insulin responsiveness. Diabetes. 2004;53:2209–2216. doi: 10.2337/diabetes.53.9.2209. [DOI] [PubMed] [Google Scholar]
- 45.Bridges TM, Marlo JE, Niswender CM, Jones CK, Jadhav SB, Gentry PR, et al. Discovery of the first highly M5-preferring muscarinic acetylcholine receptor ligand, an M5 positive allosteric modulator derived from a series of 5-trifluoromethoxy N-benzyl isatins. J. Med. Chem. 2009;52:3445–3448. doi: 10.1021/jm900286j. [DOI] [PMC free article] [PubMed] [Google Scholar]
- 46.Kawai T, Hirose H, Seto Y, Fujita H, Saruta T. Chronic effects of different fatty acids and leptin in INS-1 cells. Diabetes Res. Clin. Pract. 2001;51:1–8. doi: 10.1016/s0168-8227(00)00201-1. [DOI] [PubMed] [Google Scholar]
- 47.Xiao J, Gregersen S, Pedersen SB, Hermansen K. Differential impact of acute and chronic lipotoxicity on gene expression in INS-1 cells. Metabolism. 2002;51:155–162. doi: 10.1053/meta.2002.29977. [DOI] [PubMed] [Google Scholar]
- 48.Potter B, Sorrentino D, Berk P. Mechanisms of cellular uptake of free fatty acids. Ann. Rev. Nutr. 1989;9:253–270. doi: 10.1146/annurev.nu.09.070189.001345. [DOI] [PubMed] [Google Scholar]
- 49.Hamilton JA, Kamp F. How are free fatty acids transported in membranes? Is it by proteins or by free diffusion through the lipids? Diabetes. 1999;48:2255–2269. doi: 10.2337/diabetes.48.12.2255. [DOI] [PubMed] [Google Scholar]
- 50.Schaffer JE. Lipotoxicity: when tissues overeat. Curr. Opin. Lipid. 2003;14:281. doi: 10.1097/00041433-200306000-00008. [DOI] [PubMed] [Google Scholar]
- 51.Shimabukuro M, Zhou Y-T, Levi M, Unger RH. Fatty acid-induced β cell apoptosis: a link between obesity and diabetes. Proc. Natl. Acad. Sci. U. S. A. 1998;95:2498–2502. doi: 10.1073/pnas.95.5.2498. [DOI] [PMC free article] [PubMed] [Google Scholar]
- 52.Cunha DA, Hekerman P, Ladriere L, Bazarra-Castro A, Ortis F, Wakeham MC, et al. Initiation and execution of lipotoxic ER stress in pancreatic beta-cells. J. Cell Sci. 2008;121:2308–2318. doi: 10.1242/jcs.026062. [DOI] [PMC free article] [PubMed] [Google Scholar]
- 53.Blackburn C, Guan B, Brown J, Cullis C, Condon SM, Jenkins TJ, et al. Identification and characterization of 4-aryl-3,4-dihydropyrimidin-2(1H)-ones as inhibitors of the fatty acid transporter FATP4. Bioorg. Med. Chem. Lett. 2006;16:3504–3509. doi: 10.1016/j.bmcl.2006.03.102. [DOI] [PubMed] [Google Scholar]
- 54.Matsufuji T, Ikeda M, Naito A, Hirouchi M, Kanda S, Izumi M, et al. Arylpiperazines as fatty acid transport protein 1 (FATP1) inhibitors with improved potency and pharmacokinetic properties. Bioorg. Med. Chem. Lett. 2013;23:2560–2565. doi: 10.1016/j.bmcl.2013.02.116. [DOI] [PubMed] [Google Scholar]
- 55.Matsufuji T, Ikeda M, Naito A, Hirouchi M, Takakusa H, Kanda S, et al. Discovery and optimization of novel fatty acid transport protein 1 (FATP1) inhibitors. Bioorg Med Chem Lett. 2012;22:5067–5070. doi: 10.1016/j.bmcl.2012.05.130. [DOI] [PubMed] [Google Scholar]
- 56.Melton EM, Cerny RL, DiRusso CC, Black PN. Overexpression of human fatty acid transport protein 2/very long chain acyl-CoA synthetase 1 (FATP2/Acsvl1) reveals distinct patterns of trafficking of exogenous fatty acids. Biochem. Biophys. Res. Commun. 2013;440:743–748. doi: 10.1016/j.bbrc.2013.09.137. [DOI] [PMC free article] [PubMed] [Google Scholar]
- 57.Melton EM, Cerny RL, Watkins PA, DiRusso CC, Black PN. Human fatty acid transport protein 2a/very long chain acyl-CoA synthetase 1 (FATP2a/Acsvl1) has a preference in mediating the channeling of exogenous n-3 fatty acids into phosphatidylinositol. J. Biol. Chem. 2011;286:30670–30679. doi: 10.1074/jbc.M111.226316. [DOI] [PMC free article] [PubMed] [Google Scholar]
- 58.Kahn SE, Cooper ME, Del Prato S. Pathophysiology and treatment of type 2 diabetes: perspectives on the past, present, and future. Lancet. 2014;383:1068–1083. doi: 10.1016/S0140-6736(13)62154-6. [DOI] [PMC free article] [PubMed] [Google Scholar]
- 59.Makarem N, Chandran U, Bandera EV, Parekh N. Dietary fat in breast cancer survival. Annu. Rev. Nutr. 2013;33:319–348. doi: 10.1146/annurev-nutr-112912-095300. [DOI] [PMC free article] [PubMed] [Google Scholar]
- 60.Yasutake K, Kohjima M, Kotoh K, Nakashima M, Nakamuta M, Enjoji M. Dietary habits and behaviors associated with nonalcoholic fatty liver disease. World J. Gastroenterol. 2014;20:1756–1767. doi: 10.3748/wjg.v20.i7.1756. [DOI] [PMC free article] [PubMed] [Google Scholar]
- 61.Ricchi M, Odoardi MR, Carulli L, Anzivino C, Ballestri S, Pinetti A, et al. Differential effect of oleic and palmitic acid on lipid accumulation and apoptosis in cultured hepatocytes. J. Gastroent. Hepatol. 2009;24:830–840. doi: 10.1111/j.1440-1746.2008.05733.x. [DOI] [PubMed] [Google Scholar]
- 62.Zhang Y, Zhen W, Maechler P, Liu D. Small molecule kaempferol modulates PDX-1 protein expression and subsequently promotes pancreatic β-cell survival and function via CREB. J. Nutr. Biochem. 2013;24:638–646. doi: 10.1016/j.jnutbio.2012.03.008. [DOI] [PMC free article] [PubMed] [Google Scholar]
- 63.Alkhouri N, Dixon LJ, Feldstein AE. Lipotoxicity in nonalcoholic fatty liver disease: not all lipids are created equal. Exp. Rev. Gastroent. Hepatol. 2009;3:445. doi: 10.1586/egh.09.32. [DOI] [PMC free article] [PubMed] [Google Scholar]
- 64.Frigerio F, Brun T, Bartley C, Usardi A, Bosco D, Ravnskjaer K, et al. Peroxisome proliferator-activated receptor α (PPARα) protects against oleate-induced INS-1E beta cell dysfunction by preserving carbohydrate metabolism. Diabetologia. 2010;53:331–340. doi: 10.1007/s00125-009-1590-6. [DOI] [PubMed] [Google Scholar]
- 65.Zhou Y, Grill V. Long term exposure to fatty acids and ketones inhibits B-cell functions in human pancreatic islets of Langerhans. J. Clin. Endocrin. Metab. 1995;80:1584–1590. doi: 10.1210/jcem.80.5.7745004. [DOI] [PubMed] [Google Scholar]
- 66.Zhou Y-P, Grill VE. Long-term exposure of rat pancreatic islets to fatty acids inhibits glucose-induced insulin secretion and biosynthesis through a glucose fatty acid cycle. J. Clin. Invest. 1994;93:870. doi: 10.1172/JCI117042. [DOI] [PMC free article] [PubMed] [Google Scholar]
- 67.Boulghassoul-Pietrzykowska N, Franceschelli J, Still C. New medications for obesity management: changing the landscape of obesity treatment. Curr. Opin. Endocrinol. Diabetes Obes. 2013;20:407–411. doi: 10.1097/01.med.0000433059.78485.fa. [DOI] [PubMed] [Google Scholar]
- 68.Isler D, Moeglen C, Gains N, Meier MK. Effect of the lipase inhibitor orlistat and of dietary lipid on the absorption of radiolabelled triolein, tri-gamma-linolenin and tripalmitin in mice. Br. J. Nutr. 1995;73:851–862. doi: 10.1079/bjn19950090. [DOI] [PubMed] [Google Scholar]


