

Abstract
Background
Predictive models for hepatocellular carcinoma (HCC) have been limited by modest accuracy and lack of validation. Machine learning algorithms offer a novel methodology, which may improve HCC risk prognostication among patients with cirrhosis. Our study's aim was to develop and compare predictive models for HCC development among cirrhotic patients, using conventional regression analysis and machine learning algorithms.
Methods
We enrolled 442 patients with Child A or B cirrhosis at the University of Michigan between January 2004 and September 2006 (UM cohort) and prospectively followed them until HCC development, liver transplantation, death, or study termination. Regression analysis and machine learning algorithms were used to construct predictive models for HCC development, which were tested on an independent validation cohort from the Hepatitis C Antiviral Long-term Treatment against Cirrhosis (HALT-C) Trial. Both models were also compared to the previously published HALT-C model. Discrimination was assessed using receiver operating characteristic curve analysis and diagnostic accuracy was assessed with net reclassification improvement and integrated discrimination improvement statistics.
Results
After a median follow-up of 3.5 years, 41 patients developed HCC. The UM regression model had a c-statistic of 0.61 (95%CI 0.56-0.67), whereas the machine learning algorithm had a c-statistic of 0.64 (95%CI 0.60–0.69) in the validation cohort. The machine learning algorithm had significantly better diagnostic accuracy as assessed by net reclassification improvement (p<0.001) and integrated discrimination improvement (p=0.04). The HALT-C model had a c-statistic of 0.60 (95%CI 0.50-0.70) in the validation cohort and was outperformed by the machine learning algorithm (p=0.047).
Conclusion
Machine learning algorithms improve the accuracy of risk stratifying patients with cirrhosis and can be used to accurately identify patients at high-risk for developing HCC.
Keywords: liver cancer, risk stratification, cirrhosis, prognosis, risk score
Introduction
Hepatocellular carcinoma (HCC) is the third leading cause of cancer-related death worldwide and one of the leading causes of death among patients with cirrhosis. Its incidence in the United States is increasing due to the current epidemic of hepatitis C virus (HCV) infection and non-alcoholic fatty liver disease (NAFLD) (1). Prognosis for patients with HCC depends on tumor stage, with curative options available for patients diagnosed at an early stage (2). Patients with early HCC achieve 5-year survival rates of 70% with resection or transplantation, whereas those with advanced HCC have a median survival of less than one year (3, 4).
Surveillance using ultrasound with or without alpha fetoprotein (AFP) every 6 months strives to detect HCC at an early stage when it is amenable to curative therapy (5) and is recommended in high-risk populations (6). One of the central criteria for an effective surveillance program is the accurate identification of a high-risk target population. Patients with cirrhosis are at particularly high risk for developing HCC, with an annual risk of developing HCC between 2% and 7%, although this may not be uniform across all patients and etiologies of liver disease (7). Identification of other risk factors among patients with cirrhosis may define a subgroup of high-risk patients in whom surveillance could be targeted.
Retrospective case-control studies have identified risk factors for HCC among patients with cirrhosis, including older age, male gender, diabetes, and alcohol intake (7). Subsequent studies have developed predictive models for the development of HCC using several of these risk factors, although they are limited by moderate accuracy and none have been validated in independent cohorts. Machine learning is a novel form of artificial intelligence that has been previously used to predict behavior or outcomes in business, such as identifying consumer preferences for products based on prior purchasing history or web-surfers affinity to particular advertisements based on mouse-click history. Machine learning algorithms have several advantages over traditional statistical modeling, including the ability to recognize clinically important risk among patients with several marginal risk factors and continually incorporate new clinical data with minimal oversight (Supplemental Material) (8). It has been successfully used in medicine to identify factors associated with treatment response in HCV patients and response to resection among patients with HCC(9, 10), but its benefit in HCC risk estimation has yet to be fully explored. The aims of our study were to develop and compare predictive models using conventional regression analysis and machine learning algorithms.
Methods
University of Michigan Study Population (UM Cohort) and Follow-up
Between January 2004 and September 2006, consecutive patients with cirrhosis but no detectable HCC were prospectively identified and entered into a surveillance program using ultrasound and AFP, as has been previously described in detail (11). Patients were enrolled from Hepatology and Transplant Hepatology clinics at the University of Michigan if they had Child-Pugh class A or B cirrhosis and absence of known HCC at the time of initial evaluation. Patients diagnosed with HCC within the first six months of enrollment (i.e. 4 patients with prevalent cases) were excluded. Other exclusion criteria included clinical evidence of significant hepatic decompensation (refractory ascites, grade 3-4 encephalopathy, active variceal bleeding, or hepatorenal syndrome), co-morbid medical conditions with a life expectancy of less than one year, prior solid organ transplant, and a known extrahepatic primary tumor. This study protocol was approved by the Institutional Review Board at the University of Michigan, and informed consent was obtained in writing from each patient.
The following demographic and clinical data were collected at the time of enrollment: age, gender, race, body mass index (BMI), past medical history, lifetime alcohol use, and lifetime tobacco use. Data regarding their liver disease included the underlying etiology and presence of ascites, encephalopathy, or esophageal varices. Laboratory data of interest at the time of enrollment included: platelet count, aspartate aminotransferase (AST), alanine aminotransferase (ALT), alkaline phosphatase, bilirubin, albumin, international normalized ratio (INR), and AFP. Patients underwent prospective evaluation every 6 to 12 months by physical examination, ultrasound, and AFP. If an AFP level was greater than 20 ng/mL or any mass lesion was seen on ultrasound, triple-phase computed tomography (CT) or magnetic resonance imaging (MRI) was performed to further evaluate the presence of HCC. Patients were followed until the time of HCC diagnosis, liver transplantation, death, or until the study was terminated on July 31, 2010.
HCC was diagnosed using the American Association for the Study of Liver Disease (AASLD) guidelines at the time of the study, and the Barcelona Clinic Liver Cancer (BCLC) system was used for tumor staging (6). For tumors greater than 2 cm in size, the diagnosis was made by the presence of a typical vascular pattern on dynamic imaging (arterial enhancement and washout on delayed images) or an AFP > 200 ng/mL. For tumors with a maximum diameter of 1-2 cm, the diagnosis was made by the presence of a typical vascular pattern on two dynamic imaging studies or histology. All HCC diagnoses were adjudicated by two authors (A.S. and J.M.) to confirm that they met diagnostic criteria and to determine tumor stage at the time of diagnosis.
Development of Regression Model
We developed a predictive regression model for the development of HCC using the UM cohort. The relationship of patient factors to HCC development was assessed by Wilcoxon rank sum tests, chi square tests, and univariate Cox regression. All parameters with a p-value less than 0.10 in univariate analysis, as well as those determined to be clinically relevant a priori (age, gender, BMI, diabetes, viral etiology, and Child Pugh class), were selected for the multivariate Cox regression model, in which a p-value less than 0.05 was considered significant.
Development of Machine Learning Algorithm Models
We also used random forest analysis, a type of machine-learning algorithm that can build classification prediction models, to identify baseline risk factors associated with the development of HCC in the UM cohort. The random forest approach divides the initial cohort into two groups – “in-bag” and “out-of-bag” samples. The in-bag sample is created using random sampling with replacement from the initial cohort, creating a sample equivalent in size to the initial cohort. The out-of-bag sample is composed of the unsampled data from the initial cohort, and typically includes about one-third of the initial cohort. This process is repeated 500 times to create multiple pairings of in-bag and out-of-bag samples. For each pairing, a decision tree (Supplemental Figure) is constructed on the in-bag sample, using a random set of potential candidate variables for each split, and then validated using the out-of-bag sample. As each tree is built, only a random subset of the predictor variables is considered as possible splitters for each binary partitioning. The predictions from each tree are used as “votes”, and the outcome with the most votes is considered the dichotomous outcome prediction for that sample. Using this method, multiple decision trees are constructed to create the final classification prediction model and determine overall variable importance. Accuracies and error rates are computed for each observation using the out-of-bag predictions, and then averaged over all observations. Because the out-of-bag observations were not used in the fitting of the trees, the out-of-bag estimates serve as cross-validated accuracy estimates. Variable importance identifies the most important variables based on their contribution to the predictive accuracy of the model (12). The most important variables are identified as those that most frequently result in early splitting of the decision trees. The final algorithms, consisting of 500 trees each, are not presented here for the sake of brevity.
HALT-C Trial Study Population (HALT-C cohort) and Follow-up
The regression model and machine learning algorithm were externally validated using data from the Hepatitis C Antiviral Long-term Treatment against Cirrhosis (HALT-C) Trial. The design of HALT-C, including the surveillance protocol, has been previously described in detail(13-15). In brief, patients were included if they had chronic HCV infection with advanced fibrosis or cirrhosis (Ishak score ≥3) without decompensation and had failed to achieve sustained virologic response (SVR) after previous interferon treatment. After 24 weeks of pegylated interferon (PEG-IFN) and ribavirin (RBV), those who remained viremic at week 20 were randomized to PEG-IFN maintenance therapy or no further therapy for the next 3.5 years. After the initial 3.5 years of follow-up, patients were invited to extend study participation without treatment, until study termination in October 2009. Patients were excluded if they had an AFP >200 ng/mL or a suspicious mass on any abdominal imaging at the time of enrollment. Patients underwent prospective evaluation every 6 to 12 months by physical examination, ultrasound, and AFP. Patients with an elevated or rising AFP and those with new lesions on ultrasound were evaluated with CT or MRI. Definite HCC was defined by a) imaging demonstrating a mass with AFP levels >1,000 ng/mL or b) histologic confirmation. In the absence of histology or AFP <1,000 ng/mL, presumed HCC was defined as a new mass on ultrasound with one of the following characteristics: a) two imaging studies with characteristic findings of HCC, b) progressively enlarging lesion on ultrasound leading to patient death, c) one imaging study demonstrating an enlarging mass with characteristics of HCC, or d) one imaging study demonstrating a mass and increasing AFP levels. An Outcomes Review Panel, comprised of a rotating panel with three trial investigators, adjudicated all diagnoses of presumed and definite HCC. At the time of the initial HALT-C model development (median follow-up of 4.6 years), 48 patients had developed HCC (14). At the time of this study (median follow-up 5.7 years), an additional 40 patients had developed HCC (13).
Assessing and Comparing Model Performance
We compared the performance of the machine learning algorithm and UM regression model to that of the previously published model from the HALT-C Trial (14): Age*0.049 + black race*0.712 + alkaline phosphatase*0.006 + esophageal varices*0.777 + ever smoked*0.749 -platelets*0.011. The UM regression model was validated using data from the HALT-C cohort, and the HALT-C model was validated using the UM cohort data. Machine learning algorithms do not need cross-validation or a separate validation set to get an unbiased estimate of error for machine learning algorithms, as it is estimated internally using the out-of-bag estimates (12). However, we penalized our analysis against the machine learning model by still performing both out-of-bag internal validation in the UM cohort as well as external validation in the HALT-C cohort. We used several complementary methods to assess different aspects of model performance. We first compared model discrimination for the regression models and machine learning algorithms using receiver operating characteristic (ROC) curve analysis. The gain in diagnostic accuracy was then assessed with the net reclassification improvement (NRI) statistic, using the Youden model, and the integrated discrimination improvement (IDI) statistic; risk thresholds in the machine learning algorithm model were obtained to maximize sensitivity in order to capture all patients with HCC. Using risk cut-offs to define a low-risk and high-risk group, we assessed the ability of each model to differentiate the risk of HCC development among low-risk and high-risk patients. Finally, we assessed the performance of each model using Brier scores and Hosmer-Lemeshow χ2 goodness-of-fit test (Supplemental Material). Analyses were conducted using STATA statistical software 11.2 (College Station, TX) and R statistical package 2.14.0.
Results
University of Michigan Study Population
The UM cohort consisted of 442 patients with cirrhosis but without prevalent HCC. Baseline characteristics of the patients are shown in Table 1. The median age of the patients was 52.8 years (range 23.6 – 82.4). More than 90% of the patients were Caucasian and 58.6% were men. The most common etiologies of cirrhosis were hepatitis C (47.3%), cryptogenic (19.2%), and alcohol-induced liver disease (14.5%). A total of 42.9% patients were Child Pugh class A and 52.5% were Child Pugh class B. Median Child Pugh and MELD scores at enrollment were 7 and 9 respectively. Median baseline AFP level was 5.9 ng/mL in patients who developed HCC, and 3.7 ng/mL in patients who did not develop HCC during follow-up (p<0.01). Median follow-up of the cohort was 3.5 years (range 0-6.6), with at least one year of follow-up in 392 (88.7%) patients. Over a 1454 person-year follow-up period, 41 patients developed HCC for an annual incidence of 2.8% (Figure 1). The cumulative 3- and 5-year probability of HCC development was 5.7% and 9.1%, respectively. Of the 41 patients with HCC, 4 (9.8%) tumors were classified as very early stage (BCLC stage 0) and 19 (46.3%) as BCLC stage A.
Table I.
Baseline Patient Characteristics
| Patient Characteristics | UM Cohort (n=442 patients) | HALT-C Cohort (n=1050 patients) |
|---|---|---|
| Number of HCC | 41 | 88 |
| Age | 53 (24 – 82) | 49(19 – 80) |
| Gender (% Male) | 259 (58.6%) | 717 (70.6%) |
| Race | ||
| Caucasian | 403 (93.3%) | 727 (71.6%) |
| Black | 13 (3.0%) | 188 (18.5%) |
| Hispanic | 8 (1.9%) | 78 (7.7%) |
| BMI | 28.8 (17.0–68.6) | 29.2 (17.5–58.4) |
| Etiology | ||
| Hepatitis C | 209 (47.3%) | 1050 (100%) |
| Hepatitis B | 18 (4.1%) | 0 (0%) |
| Alcohol | 64 (14.5%) | 0 (0%) |
| Cryptogenic | 85 (19.2%) | 0 (0%) |
| Other | 66 (14.9%) | 0 (0%) |
| Alcohol (% used) | 293 (66.3%) | 842 (83.0%) |
| Tobacco (% used) | 279 (63.1%) | 772 (76.1%) |
| Presence of esophageal varices | 268 (72.6%) | 261 (25.7%) |
| Presence of ascites | 268 (60.6%) | 0 (0%) |
| Presence of hepatic encephalopathy | 149 (33.7%) | 0 (0%) |
| Platelet count (* 1000/mm3) | 97 (20–426) | 158 (39–426) |
| AST (U/L) | 61 (17–855) | 71 (18–539) |
| ALT (U/L) | 50 (11–477) | 86 (15–772) |
| Alkaline phosphatase (U/L) | 128 (27–660) | 89 (20–478) |
| Bilirubin (mg/dL) | 1.2 (0.2–10.3) | 0.7 (0.1–3.8) |
| Albumin (g/dL) | 3.4 (1.5–5.2) | 3.9 (2.7–4.9) |
| INR | 1.2 (0.9–2.1) | 1.0 (0.8–1.9) |
| AFP (ng/mL) | 3.9 (0.6–238.3) | 8.5 (1–315) |
| Child Pugh score | 7 (5–11) | 5 (5–7) |
| Child Pugh | ||
| Child A | 189 (42.9%) | 1050 (100%) |
| Child B | 231 (52.5%) | 0 (0%) |
| Child C | 20 (4.6%) | 0 (0%) |
AFP – alpha fetoprotein; ALT – alanine aminotransferase; AST – aspartate aminotransferase; BMI – body mass index; HCC – hepatocellular carcinoma; INR – international normalized ratio; MELD – model for end stage liver disease
All continuous data expressed as median (range) unless otherwise specified
Figure 1.

Cumulative incidences of HCC Development
HALT-C Trial Study Population
The HALT-C cohort consisted of 1050 patients, with a mean age of 50 years and 71% being male. Cirrhosis was present at baseline in 41% of patients, with all cirrhotic patients having Child-Pugh A disease. The mean baseline platelet count was 159 *109/L, with 18% of patients having a platelet count below 100 *109/L. The mean baseline AFP level was 17 ng/mL, with 19% of patients having AFP levels >20 ng/mL. Over a 6120 person-year follow-up period, 88 patients developed HCC. Of those patients, 19 (21.1%) tumors were classified as TNM stage T1 and 47 (52.2%) as TNM stage T2.
UM Regression Model for HCC Development
In the UM cohort, the following baseline variables were shown to be associated with the development of HCC with p-values less than 0.10 on univariate analysis: AFP level (p<0.001), bilirubin (p=0.02), male gender (p=0.03), AST (p=0.03), ALT (p=0.03), Child Pugh score (p=0.05), and viral etiology (p=0.07). We also entered variables determined to be clinically relevant a priori into the multivariate regression model: patient age, BMI, and presence of diabetes. On multivariate analysis, baseline AFP level (HR 1.01, 95% CI 1.00 – 1.02) and male gender (HR 2.25, 95% CI 1.08 – 4.70) were independent predictors of HCC development.
Machine Learning Algorithm Models for HCC Development
Random forest algorithms using baseline variables including patient demographics, clinical data, and laboratory values were used to identify patients who developed HCC in the UM cohort. The proportional importance of each input variable in the random forest model is shown in Figure 2. The most important independent variables in differentiating patients who developed HCC and those without HCC were as follows: AST, ALT, the presence of ascites, bilirubin, baseline AFP level, and albumin.
Figure 2.
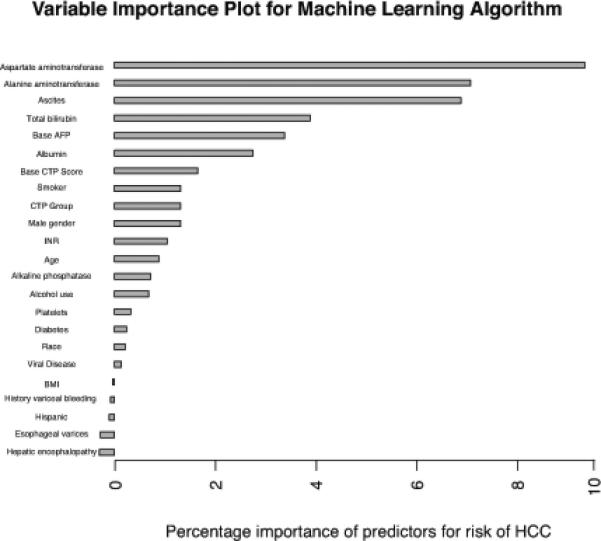
Variable Importance for Machine Learning Algorithm Model
Performance of Risk Stratification Models in the Derivation Cohorts
The machine learning algorithm and UM regression model were derived using data from the UM cohort, whereas the previously derived HALT-C model was assessed in the final HALT-C cohort. The performance characteristics of the models are detailed in Table 2. The HALT-C model had a c-statistic of 0.76 (95%CI 0.71–0.80) while the UM regression model had a c-statistic of 0.64 (95%CI 0.54–0.73). The machine learning algorithm had a c-statistic of 0.71 (95%CI 0.63-0.79) in the UM cohort. Brier scores and Hosmer-Lemeshow results are found in Supplemental Material.
Table II.
Summary Statistics for HCC Development Risk Stratification Models
| Derivation Cohorts | Validation Cohorts | |||
|---|---|---|---|---|
| Cohort | C-statistic | Cohort | C-statistic | |
| Machine Learning Algorithm | UM cohort | 0.71 (95%CI 0.63-0.79) | HALT-C cohort | 0.64 (95%CI 0.60-0.69) |
| UM Regression Model | UM cohort | 0.64 (95%CI 0.54-0.73) | HALT-C cohort | 0.61 (95%CI 0.56-0.67) |
| HALT-C Regression Model | HALT-C cohort | 0.76 (95%CI 0.71-0.80) | UM cohort | 0.60 (95%CI 0.50-0.70) |
Another critical issue for clinical application of a new algorithm is the proportion of patients correctly classified (Table 3). Using the previously published cut-off of 3.25 to identify high-risk patients, the HALT-C model had a sensitivity and specificity of 40.9% and 85.4% in the final HALT-C cohort. The UM regression model achieved a sensitivity and specificity of 53.7% and 66.6%, while the machine learning algorithm had a sensitivity and specificity of 80.5% and 57.9% in the UM cohort.
Table III.
Misclassification Table for HCC Development by Risk Stratification Models
| Cut-off | Derivation Cohorts† | Validation Cohorts† | |||||||
|---|---|---|---|---|---|---|---|---|---|
| Low Risk Group* | High Risk Group* | Low Risk Group* | High Risk Group* | ||||||
| False positive | True Negative | True Positive | False Negative | False positive | True Negative | True Positive | False Negative | ||
| Machine Learning Algorithm |
0.09 | 160/380 (42.1%) |
220/380 (57.9%) |
33/41 (80.5%) |
8/41 (19.5%) |
493/927 (53.2%) |
434/927 (46.8%) |
71/88 (80.7%) |
17/88 (19.3%) |
| Regression Model |
0.10 | 127/380 (33.4%) |
253/380 (66.6%) |
22/41 (53.7%) |
19/41 (46.3%) |
781/927 (84.3%) |
146/927 (15.7%) |
81/88 (92.0%) |
7/88 (8.0%) |
| HALT-C Regression Model |
3.25 | 135/927 (14.6%) |
792/927 (85.4%) |
36/88 (40.9%) |
52/88 (59.1%) |
222/380 (58.4%) |
158/380 (41.6%) |
29/41 (70.7%) |
12/41 (29.3%) |
Risk score cut-offs, derived to maximize overall model accuracy, were used to define a low-risk and high-risk group for each model. The machine learning algorithm used an out-of-bag sample from the derivation dataset to obtain the cut-off, whereas a cross-validation model was used to derive the cut-off for the UM regression model.
The machine learning algorithm and UM regression model were derived using data from the UM cohort, whereas the HALT-C model was derived in the HALT-C cohort. Validation of the machine learning algorithm and UM regression model was performed using the HALT-C cohort data, and HALT-C model using UM cohort data.
Performance of Risk Stratification Models in the Validation Cohorts
Validation of the HALT-C model was performed using data from the UM cohort, while the regression model and machine learning algorithm were validated using HALT-C cohort data. During validation, the initial HALT-C model had a c-statistic of only 0.60 (95%CI 0.50 – 0.70), and the UM regression model had a c-statistic of 0.61 (95% CI 0.56–0.67). The machine learning algorithm had a better c-statistic of 0.64 (95%CI 0.60-0.69) when compared to the UM regression model and the HALT-C model. Brier scores and Hosmer-Lemeshow results are found in Supplemental Material.
The HALT-C model had a sensitivity of 70.7% and specificity of 41.6% to identify HCC patients in the UM cohort, using the previously published cut-off of 3.25 for high-risk patients. The UM regression model was able to achieve a sensitivity of 92.0% but only had a specificity of 15.7% in the HALT-C cohort. The machine learning algorithm was able to achieve a high sensitivity, correctly identifying 71 (80.7%) of the 88 patients who developed HCC, while still maintaining a specificity of 46.8%. It also had significantly better diagnostic accuracy than the UM regression model and HALT-C model when validated (IDI=0.01, p=0.04; net reclassification improvement=0.39, p<0.001).
Discussion
HCC surveillance is currently recommended for all patients with cirrhosis, regardless of other risk factors, to detect tumors at a potentially curative stage and thereby reduce mortality. However, the risk of developing HCC is likely not uniform across all patients. We compared the predictive ability of three models, two using traditional regression techniques and the other using novel machine learning algorithms, to identify a subset of cirrhotic patients at high risk for HCC. The machine learning algorithm model outperformed both the UM regression model and the previously published HALT-C model, had the best predictive ability to identify patients at high risk for HCC, and may be used to risk stratify patients with regard to their risk of HCC development.
Although prior studies have developed predictive models for HCC, our study is the first to externally validate our predictive models. Validation is an important aspect of predictive model development, given the performance of regression models is generally substantially higher in derivation datasets than validation sets (16). The importance of validation is highlighted in our study, as the previously published HALT-C model performed better in the HALT-C cohort than the UM cohort. This difference in performance is likely driven by several key differences in study populations. The HALT-C cohort included only HCV patients and 59% of patients had advanced fibrosis without cirrhosis. In contrast, the UM cohort included patients of various etiologies (49% non-viral) and all had underlying cirrhosis, including 52% with Child Pugh B disease. Given the marked heterogeneity among at-risk populations in terms of etiologies of liver disease, degree of liver dysfunction, and prevalence of other risk factors (such as diabetes, smoking or alcohol use), validation of any predictive model for HCC development is crucial.
Our machine learning algorithm model demonstrated significantly better diagnostic accuracy compared to models derived using traditional regression techniques. Although there was only a trend toward a higher c-statistic, it was able to classify patients with significantly better accuracy, as demonstrated by the net reclassification improvement and integrated discrimination improvement statistics. ROC analysis alone is often insensitive for comparing predictive models (17, 18); therefore, methods including NRI and IDI have been proposed as better measures to compare risk stratification models (18, 19). ROC curves are helpful in diagnostic settings as the outcome is determined and can be compared to a gold standard; whereas in prognostic models, the outcome has not yet developed at the time of prediction so there is a component of randomness to the outcome. In predictive models, a c-statistic describes how well the model can rank order cases and non-cases but it is not a function of actual predicted probabilities or the probability of the individual being classified correctly. This makes it a less accurate measure of the prediction error. Our paper highlights the importance of using novel risk prediction performance measures to accurately provide risk predictions with little change in the c-statistic.
Machine learning algorithms also have several other advantages over traditional statistical modeling. Machine learning algorithms consider all potential interactions and lack a predefined hypothesis, making it less likely to overlook unexpected predictor variables (8). Predictive models using machine learning algorithms may therefore facilitate recognition of clinically important risk among patients with several marginal risk factors that may otherwise not raise clinical concerns. Furthermore, machine learning algorithms can easily incorporate new clinical data to continually update and optimize algorithms with minimal oversight (8). For example, a machine learning algorithm to predict response to thiopurines in patients with inflammatory bowel disease has been successfully used as a decision support tool after it was shown to outperform metabolite testing (20, 21). If further refined to have better accuracy, machine learning algorithms could be used as the basis for an electronic health record decision support tool to aid providers with real-time assessments of HCC risk and recommendations regarding HCC surveillance. Implementation of the predictive algorithm could be used to identify high-risk individual cases and transmit annotated data back to the provider, facilitating changes to their clinical assessment. If prospectively validated, machine learning algorithms could also form the basis for a publicly available online HCC risk calculator.
Accurate assessment of HCC risk among patients with cirrhosis may allow targeted application of HCC surveillance programs, given that HCC surveillance is only cost effective among those with an annual HCC risk of greater than 1.5% (22). Although low-risk patients still have some risk of developing HCC, the annual risk may be less than 1.5% and surveillance may not be cost-effective in this cohort. Similarly, patients in the high-risk cohort may benefit from a more intensive HCC surveillance regimen given the suboptimal effectiveness of ultrasound to find tumors at an early stage(11, 15). Although surveillance with cross sectional imaging is not recommended among all patients with cirrhosis, it is possible that this would be cost-effective among a subgroup of cirrhotic patients.
Although the machine learning algorithm outperformed traditional regression modeling, both models only have moderate accuracy for the prediction of HCC development. It is possible, if not likely, that readily available clinical variables, such as demographics and liver function, only partially account for HCC risk among patients with cirrhosis. The addition of biomarkers or genetic markers may be necessary to further improve HCC risk prognostication.
We identified variables associated with HCC development, including male gender and baseline AFP level. Since the release of the 2010 AASLD guidelines, there has been extensive debate regarding the utility of AFP in clinical practice(11, 15, 22-25). Our study highlights that AFP may be useful in risk stratification in patients with cirrhosis. Even though baseline AFP levels were low for both patients with and without HCC, we found that baseline AFP was one of the most important predictors for HCC in both the regression model and machine learning algorithm. Therefore, we believe that continued AFP testing could play an important role among patients with cirrhosis in terms of prognostication, if not actual screening, in clinical practice.
It is important to note that our study had several limitations. Our study was performed in a single tertiary care center and may not be generalized to other practice settings. Second, approximately 18% of the patients were lost to follow-up, although the median follow-up for these patients was 2.8 years and their survival status was verified through the social security death file. Furthermore, these patients had less advanced cirrhosis (lower Child Pugh class and MELD scores) and were less likely to develop hepatic decompensation, HCC, or death. Finally, our machine learning algorithm had suboptimal accuracy in the validation cohort. Although promising, further refinement of the machine learning algorithm is still necessary prior to routine use in clinical practice. Overall, we believe that the limitations of this study are outweighed by its notable strengths including its prospective enrollment with adjudication of HCC outcomes, its novel methodology, and the validation of our models in independent cohorts.
In conclusion, we present the first externally validated model for HCC risk prediction, which appears to outperform previously published models. The use of machine learning algorithms significantly improved predictive ability compared to traditional regression analysis; however the addition of novel biomarkers and/or longitudinal data may still allow further refinement. We found that predictive models using readily available clinical data can accurately identify cirrhotic patients at high risk for HCC development. Studies to determine whether these models could prospectively risk stratify patients with cirrhosis regarding their risk of HCC development should be performed.
Supplementary Material
WHAT IS CURRENT KNOWLEDGE
Patients with cirrhosis are at high risk for developing HCC, although this risk is not uniform among all patients.
Prior predictive models for HCC have been limited by modest accuracy and lack of validation.
Machine learning is a novel form of pattern recognition that can be used in prediction research, but its benefit in HCC risk estimation has not been explored.
WHAT IS NEW HERE
Machine learning algorithms outperformed conventional regression models in identifying patients at high risk for developing HCC.
Validation of predictive models for HCC, using a full set of complementary methods, is essential.
Acknowledgments
Financial Support: This project was supported, in part, by grants DK064909 and DK077707. Dr. Singal's research is funded by an ACG Junior Faculty Development Award and grant number KL2TR000453. Dr. Elmunzer's research is funded by grant number UL1RR024986 from the National Center for Research Resources. Dr. Waljee's research is funded by a VA HSR&D CDA-2 Career Development Award 1IK2HX000775-01. The content is solely the responsibility of the authors and does not necessarily represent the official views of UT-STAR, the University of Texas Southwestern Medical Center at Dallas and its affiliated academic and health care centers, the National Center for Advancing Translational Sciences, or the National Institutes of Health.
Abbreviations
- HCC
hepatocellular carcinoma
- HCV
hepatitis C virus
- NAFLD
nonalcoholic fatty liver disease
- AFP
alpha fetoprotein
- AST
aspartate aminotransferase
- ALT
alanine aminotransferase
- PT
prothrombin time
- INR
international normalized ratio
- CBC
complete blood count
- AASLD
American Association for the Study of Liver Diseases
- BCLC
Barcelona Clinic Liver Cancer
- ROC
receiver operating characteristic
- HALT-C
Hepatitis C Antiviral Long-term Treatment against Cirrhosis
- BMI
body mass index
- HR
hazard ratio
- CI
confidence interval
- VIF
variance inflation factor
- NRI
net reclassification improvement
- MELD
model for end stage liver disease
References
- 1.El-Serag HB, Rudolph KL. Hepatocellular carcinoma: epidemiology and molecular carcinogenesis. Gastroenterology. 2007;132:2557–76. doi: 10.1053/j.gastro.2007.04.061. [DOI] [PubMed] [Google Scholar]
- 2.Singal AG, Marrero JA. Recent advances in the treatment of hepatocellular carcinoma. Curr Opin Gastroenterol. 2010;26:189–95. doi: 10.1097/MOG.0b013e3283383ca5. [DOI] [PubMed] [Google Scholar]
- 3.Llovet JM, Bustamante J, Castells A, et al. Natural history of untreated nonsurgical hepatocellular carcinoma: rationale for the design and evaluation of therapeutic trials. Hepatology. 1999;29:62–7. doi: 10.1002/hep.510290145. [DOI] [PubMed] [Google Scholar]
- 4.Mazzaferro V, Regalia E, Doci R, et al. Liver transplantation for the treatment of small hepatocellular carcinomas in patients with cirrhosis. N Engl J Med. 1996;334:693–9. doi: 10.1056/NEJM199603143341104. [DOI] [PubMed] [Google Scholar]
- 5.Meissner HI, Smith RA, Rimer BK, et al. Promoting cancer screening: Learning from experience. Cancer. 2004;101:1107–17. doi: 10.1002/cncr.20507. [DOI] [PubMed] [Google Scholar]
- 6.Bruix J, Sherman M. Management of hepatocellular carcinoma. Hepatology. 2005;42:1208–36. doi: 10.1002/hep.20933. [DOI] [PubMed] [Google Scholar]
- 7.Fattovich G, Stroffolini T, Zagni I, et al. Hepatocellular carcinoma in cirrhosis: incidence and risk factors. Gastroenterology. 2004;127:S35–50. doi: 10.1053/j.gastro.2004.09.014. [DOI] [PubMed] [Google Scholar]
- 8.Waljee AK, Higgins PD. Machine learning in medicine: a primer for physicians. Am J Gastroenterol. 2010;105:1224–6. doi: 10.1038/ajg.2010.173. [DOI] [PubMed] [Google Scholar]
- 9.Ho WH, Lee KT, Chen HY, et al. Disease-free survival after hepatic resection in hepatocellular carcinoma patients: a prediction approach using artificial neural network. PLoS One. 2012;7:e29179. doi: 10.1371/journal.pone.0029179. [DOI] [PMC free article] [PubMed] [Google Scholar]
- 10.Maiellaro PA, Cozzolongo R, Marino P. Artificial neural networks for the prediction of response to interferon plus ribavirin treatment in patients with chronic hepatitis C. Curr Pharm Des. 2004;10:2101–9. doi: 10.2174/1381612043384240. [DOI] [PubMed] [Google Scholar]
- 11.Singal AG, Conjeevaram HS, Volk ML, et al. Effectiveness of Hepatocellular Carcinoma Surveillance in Patients with Cirrhosis. Cancer Epidemiol Biomarkers Prev. 2012;21:793–9. doi: 10.1158/1055-9965.EPI-11-1005. [DOI] [PMC free article] [PubMed] [Google Scholar]
- 12. Available from: http://www.stat.berkeley.edu/~breiman/RandomForests/cc_home.htm.
- 13.Di Bisceglie AM, Shiffman ML, Everson GT, et al. Prolonged therapy of advanced chronic hepatitis C with low-dose peginterferon. N Engl J Med. 2008;359:2429–41. doi: 10.1056/NEJMoa0707615. [DOI] [PMC free article] [PubMed] [Google Scholar]
- 14.Lok AS, Seeff LB, Morgan TR, et al. Incidence of hepatocellular carcinoma and associated risk factors in hepatitis C-related advanced liver disease. Gastroenterology. 2009;136:138–48. doi: 10.1053/j.gastro.2008.09.014. [DOI] [PMC free article] [PubMed] [Google Scholar]
- 15.Singal AG, Nehra M, Adams-Huet B, et al. Detection of hepatocellular carcinoma at advanced stages among patients in the HALT-C trial: where did surveillance fail? Am J Gastroenterol. 2013;108:425–32. doi: 10.1038/ajg.2012.449. [DOI] [PMC free article] [PubMed] [Google Scholar]
- 16.Toll DB, Janssen KJ, Vergouwe Y, et al. Validation, updating and impact of clinical prediction rules: a review. J Clin Epidemiol. 2008;61:1085–94. doi: 10.1016/j.jclinepi.2008.04.008. [DOI] [PubMed] [Google Scholar]
- 17.Steyerberg EW, Vickers AJ, Cook NR, et al. Assessing the performance of prediction models: a framework for traditional and novel measures. Epidemiology. 2010;21:128–38. doi: 10.1097/EDE.0b013e3181c30fb2. [DOI] [PMC free article] [PubMed] [Google Scholar]
- 18.Cook NR. Use and misuse of the receiver operating characteristic curve in risk prediction. Circulation. 2007;115:928–35. doi: 10.1161/CIRCULATIONAHA.106.672402. [DOI] [PubMed] [Google Scholar]
- 19.Pencina MJ, D'Agostino RB, Sr., D'Agostino RB, Jr., et al. Evaluating the added predictive ability of a new marker: from area under the ROC curve to reclassification and beyond. Stat Med. 2008;27:157–72. doi: 10.1002/sim.2929. discussion 207-12. [DOI] [PubMed] [Google Scholar]
- 20.Kurosaki M, Matsunaga K, Hirayama I, et al. A predictive model of response to peginterferon ribavirin in chronic hepatitis C using classification and regression tree analysis. Hepatol Res. 2010;40:251–60. doi: 10.1111/j.1872-034X.2009.00607.x. [DOI] [PubMed] [Google Scholar]
- 21.Waljee AK, Joyce JC, Wang S, et al. Algorithms outperform metabolite tests in predicting response of patients with inflammatory bowel disease to thiopurines. Clin Gastroenterol Hepatol. 2010;8:143–50. doi: 10.1016/j.cgh.2009.09.031. [DOI] [PubMed] [Google Scholar]
- 22.Bruix J, Sherman M. Management of Hepatocellular Carcinoma: An Update. Hepatology. 2010;53:1–35. doi: 10.1002/hep.24199. [DOI] [PMC free article] [PubMed] [Google Scholar]
- 23.Lee E, Edward S, Singal AG, et al. Improving screening for hepatocellular carcinoma by incorporating data on levels of alpha-fetoprotein, over time. Clin Gastroenterol Hepatol. 2013;11:437–40. doi: 10.1016/j.cgh.2012.11.029. [DOI] [PubMed] [Google Scholar]
- 24.Marrero JA, El-Serag HB. Alpha-fetoprotein should be included in the hepatocellular carcinoma surveillance guidelines of the American Association for the Study of Liver Diseases. Hepatology. 2011;53:1060–1. doi: 10.1002/hep.24033. author reply 1061-2. [DOI] [PubMed] [Google Scholar]
- 25.Singal A, Volk ML, Waljee A, et al. Meta-analysis: surveillance with ultrasound for early-stage hepatocellular carcinoma in patients with cirrhosis. Aliment Pharmacol Ther. 2009;30:37–47. doi: 10.1111/j.1365-2036.2009.04014.x. [DOI] [PMC free article] [PubMed] [Google Scholar]
Associated Data
This section collects any data citations, data availability statements, or supplementary materials included in this article.