Abstract
Background and Purpose:
Out-patient department is the gateway to almost all of the hospital services. Providing method of service in this place has an important role in the general impression of the patient of hospital sanitary and treatment services. This research was done with the purpose of studying the perception and expectations of out-patient service receivers of Imam Khomeini Hospital in Sari.
Materials and Methodology:
A cross-sectional study was conducted on those patients in the outpatient service department of Imam Khomeini Hospital who at least have the junior high school degree. 200 people were selected as sample size with Morgan’s table. Respondents answered the questionnaire two times. Once they expressed their perception of the provided services and once for their expectations. Therefore, the following expectation scores are obtained. To prove the significance of demographic variables with perception and expectations, the T and Tukey’s tests and also to compare different groups the variance analysis test are used.
Findings:
The mean of age was 25.68± 9.086 (The youngest participant was 16 and the oldest 67 years old). It was observed from the results of the T test there is no significant difference between sex and residential place. It was clear that in perception part; there was a significant difference, at the level of 0.05 significance, in all groups except for responding and behavior, while, in expectation level, no significance in the age of the dimensions except for access.
Conclusion:
Results showed that the satisfaction status of patients in Imam Hospital clinic in Sari is good. Many of the existing shortages can be improved by presenting an accurate and organized program. The present study shows that some service dimensions of patients require being promoted, the most important of which include behavior, accessibility and affordability, physical and responsiveness dimensions.
Keywords: Perception, Outpatients, Quality of Health Carem, Hospitals
1. INTRODUCTION
Hospitals are the most important organization of health care systems. Among other offices and organizations providing services, hospitals because of dealing with life of human beings have the special and important positions (1). Out-patient department (OPD) is the gateway to almost all of the hospital services. Globally, 80% of patients are attended at OPD. Outpatient Services are the Key to Health Gains for the Poor (2). Currently, the role of service quality is widely recognized as being a critical determinant for the success and survival of an organization in a competitive environment. One of the fastest growing in the service sector is the health care industry (3). Quality orientation is one of the main priorities of any progressive organization; quality evaluation in organizations providing services such as hospitals is one of the key challenges, because in this sector quality is determined by many intangible factors (4, 5).
Assessment of quality of services provided by the hospitals in these days has been a serious concern for hospitals and health care organizations owing to the excessive demands imposed on them by users, consumers, government and society at large. In addition to the quality of services, measurement of patient satisfaction also has been encouraged by growing consumer orientation in health care, especially since it yields information about consumer views in a form which can be used for comparison and monitoring (6).
The national sanitary system of England has defined health care quality as: “The quality of services is the degree of adapting provided services with the expectations of customers”, in reality, the quality of services is what satisfies the customers’ needs and what they accept it (1). Perception is related to the present condition in other word it refers to how services are presented. The distance between customers’ expectations and perception shows the level of the service quality (1). Quality is achieved when the service meets the customer’s needs and expectations (7). The expectations of consumers are related to their previous expectations, attitude and perception towards the competitive markets. Also, after providing services the organization managers must measure the amount of expectations that have been met (8, 9). Perceived service quality results from comparisons by customers of expectations with their perceptions of service delivered by the suppliers. If expectations are greater than performance, then perceived quality is less than satisfactory and hence customer dissatisfaction occurs (10). The perceptions and expectations of outpatients regarding the quality of medical care, general satisfaction and infrastructure are extremely important. A Hospital be it large or small, can demonstrate successful performance only when it satisfies the factors of quality and service a patient expects (11). Traditionally, quality of health care has been measured using professional standards and neglecting the importance of patient perception, but now Users’ perceptions are considered to be an important source of information on screen for problems and developing an effective plan of action for quality improvement in health care organization.
Generally, service quality gaps can be a major cause of customer dissatisfaction. Low service quality is represented by a wider gap between customer expectations of service quality (what the customer expects of a service prior to experiencing the service), and the perception of quality of service actually delivered (post-consumption judgment) (12). According to this fact that 80% of patients are attended at OPD, if the quality of outpatient services is improved a large part of health services in the country would be appreciated by many. In order to do that, it is important to establish and address factors which play a role in determining whether a patient’s judgment of the health care received is positive or negative. This would help health care providers and hospital management to focus their changes on these factors and hence improve health care delivery. The aim of this study was to identify users’ perceptions and expectations of quality of outpatient services at Imam Khomeini Hospital in Sari.
2. MATERIAL AND METHODS
This cross-sectional study was conducted on those patients in the outpatient service department of Imam Khomeini Hospital. 200 people were selected as sample size with Morgan’s table. Sampling was done in two stages, first one month of the first six months of the year (2014) was randomly selected and second samples were selected when they referred to Imam Hospital outpatient service department in Sari. Data collection was done through a questionnaire. This questionnaire included 42 questions in 6 dimensions; physical (6 questions), assurance (7 questions), ability (10 questions), responsiveness (7 questions), behavior (8 questions) and accessibility and affordability (4 questions). Respondents answered the questionnaire two times. Once they expressed their perception of the provided services to get perception scores. Another time, they express their expectation of the services to get expectation scores questionnaire are obtained according to the Cronbach’s Alpha. Statistical analysis was done through. SPSS software (IBM SPSS Statistics). To check the validity of the Cronbach’s alpha method was used. The degree of Cronbach’s alpha or structure inner similarity for perception was 0.944 and for expectation 0.945 which showed the level of suitability. To prove the significant relation of field variables and perception and expectation, the T and Turkey tests, and to compare different groups, the variance analysis tests were used.
3. FINDINGS
The mean of age was 25.68± 9.086 (The youngest participant was 16 and the oldest 67 years old). The number of male participants in this study was 57 (28.6%) and the female 140 (70.4%). 136 (68.3 %) participants were from urban and 52 (26.1%) from village. 6 ones had primary school degrees, 17 junior high, 78 high school and 89 had university degrees.
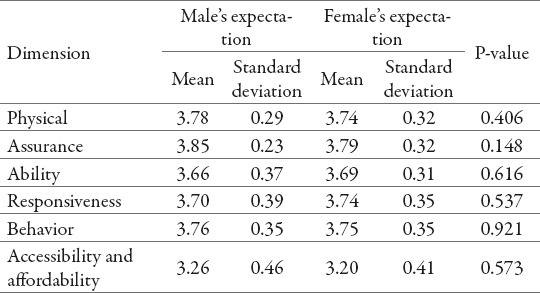
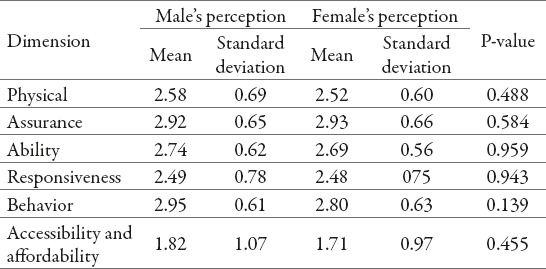
According to T test it was observed that there is no significant difference in any factors among any different gender groups.
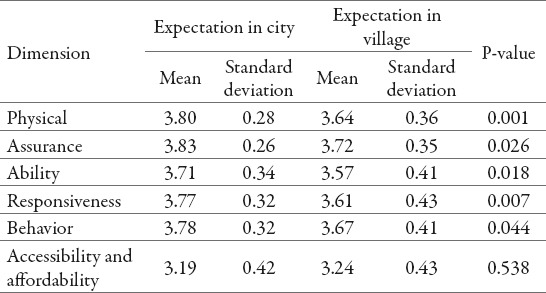
Based on the findings of the above table, it can be observed that there is a significant difference among different groups of residential place, physical, ability and responsiveness and there is not a significant difference between others.
Table 1.
Mean of expectation with gender classification

Table 2.
Mean of perception with gender classifications

Table 3.
Mean of expectation with residential place classification

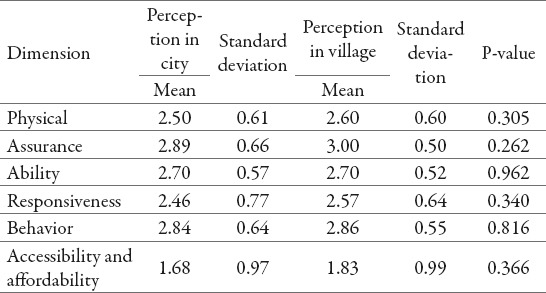
Table 4.
Mean of perception with residential place classification

It can be observed from the T test that there is not a significant difference between residential place and any other factors. Comparison of different educational groups after the variance analysis test, it was clear that in the perception part, at the level of 0.05, a significant difference in all groups was observed except for responding and behavior. Based on Turkey test in the physical and affordability dimension and the assurance dimension a significant difference at the certainty level of 0.05 between junior school and university education can be observed. Also, in the dimension of ability, a significant difference was observed between primary and junior high level. This means that there is a significant difference between the mean of these groups.
Comparison of different educational groups after the variance analysis test, it was clear that, at the level of expectations, at the significance level of 0.05, there was no significant difference except for the access dimension. In this dimension a significant difference was observed between junior high and university education. This means that the mean of the groups has significant difference. Means of other groups have no significant difference.
4. DISCUSSION
In this study, 70.4% of customers were female. The reason is that the percentage of diseases in females are more than males. They also more concern about their health more than males. Khamseh et al (2006) examined the level of patients’ showed that men had more satisfaction than women in most parts under question and satisfaction was more in the age level of 50 years than the others. Also, patients with the educational level of below diploma had more satisfaction than patients with higher educational degrees (4). In a research done in New Zealand on outpatient patients going to hospital clinics and general physicians’ offices, there was not a difference between the two groups in population characteristics except that males went to clinics more due to urgency issues (13).
In our study, the results of comparing the perception and expectation of people with different residential places show that there is no significant difference among different sex groups, but Based on DengJuin study results, women’s expectation score was higher than that of the men. The women’s higher expectations compared with the men had been reported in the previous studies (14, 15).
This study showed that the greatest gap was in behavior dimension. The reason for this can be the high number of patients during the day refers to this department and led to the tiredness in doctors and staffs that makes them to be care less about how to behave with patients. The service quality gaps indicated that the department was failing to meet the expectations of their customers. The results of this analysis provide evidence that service provider gaps must be reduced.
Ahmed and Samreen (2011) studied the private hospital in Karachi in Pakistan and found that the factors like reliability and responsiveness, feedback and guidance, and affordability greatly influence patients,satisfaction. They recommend focusing on the waiting time of the patients and making sure of the availability of the doctors at the appointed time (16).
Lim placed responsiveness, assurance and empathy after reliability in decreasing order of importance (17). On the other hand, In a study by Aghamolaei al, the most important dimension of the service quality was found to be assured, followed by responsiveness and empathy (18). According to Adrienne, assurance ranked highest and tangibles ranked lowest (19). In Kebriaie’s study, service recipients reported staff’s empathy to be the most important dimension, and tangibles and physical conditions to be the least important dimension of health care service. Dimensions of reliability, responsiveness, and assurance ranked second through fourth (20).
In all of domains of services in Caha study, patients’ expectations of the services provided were higher than their perceptions and the gaps between patients’ perceptions and their expectations were negative. The highest negative gap was in responsiveness dimension and the lowest negative gap was in assurance dimension. The negative gaps indicate that patients’ expectations of the services provided are higher than their perceptions (22).
Gap analysis between perception and expectation of recipients from the quality of Hemodialysis services in Abedi study showed that the quality of the offered services was less than expectation of respondents in all aspects. Hospitals have to obtain competent necessary service in all aspects, especially in Hemodialysis ward in order to approach the presentation of services compatible with the expectation of customers(23).
Among 481 Malaysian dental outpatients, John et al. found that responsiveness, assurance and empathy were the important determinants of quality. Dental patients had the widest quality gap for tangibles, reliability and assurance (p = .000) and the least gap was for empathy (p = .756) (24).
The results of comparing individuals’ perception and expectation with the classification of educational level shows that at the significant level of 0.05, there was a significant difference among all groups except for responsiveness and behavior. Turkey test results showed that there was a significant difference between junior high and university degrees in the physical and affordable level. This can be because people with junior high degrees had lower expectations than those with university degrees about the physical dimensions of a clinic. In the present study, 68% of customers are from city and 21.6% from the village. The reason for this difference can be the location of this clinic in the center of the city.
Results obtained from the above study shows the status of patients’ satisfaction in Imam Hospital in Sari. Many of the existing shortcomings can be improved by a rigid program. The present study shows that some dimensions of providing services to patients require promotion the most important of which are behavior, physical, responsiveness and accessibility and affordability, respectively. In this hospital, the highest level of patients’ expectation is in the dimension of behavior and the lowest level of patients’ expectation is in the dimension of accessibility which shows the necessity of paying attention to informing doctors and receptionists about following human ethics, self forgetting and humbleness and behaving well with patients.
This study was therefore able to highlight how important it is for an organization, to conduct a survey and consider the opinions of its customers and its employees in identifying areas for service quality improvements. It is therefore very important for them to know how customers evaluate service quality and what they can do to measure and improve service quality. Therefore, to exceed customer expectations, it is necessary to continually improve the quality of service provided to its customers.
Footnotes
CONFLICT OF INTEREST: NONE DECLARED.
REFERENCES
- 1.Khamseh E, Aghai R, Baradaran Moghadam H, Arabi A. Satisfaction of patients about the method of providing outpatient services in Firoozgar training-treating center of metabolism and endocrine glands clinics, Iran medical sciences university seasonal, sixth year, number one, winter. 2006:71–741. [Google Scholar]
- 2.World Health Organization. Geneva: 2004. Quality Improvement in Primary Health Care. [Google Scholar]
- 3.Zaim H, Bayyurt N, Zaim S. Service quality and determinants of customer satisfaction in hospitals: Turkish experience. The International Business & Economics Research Journal. 2010;9(5):51–58. [Google Scholar]
- 4.Nekoei-Moghadam M, Amiresmaili MR. Hospital service quality assessment: Hospitals of Kerman University of Medical Sciences, as a tangible example of a developing country. Int J Healthc Qual Assur. 2011;24:57–66. doi: 10.1108/09526861111098247. [DOI] [PubMed] [Google Scholar]
- 5.Ghassem A, Rostami F, Nadi A, Shirafkan F. Gap analysis of perceived services with patients expectations of outpatients services in Boali sina hospital in Sari. Baltica. 2014;27(1):213–219. [Google Scholar]
- 6.Francis Sudhakar K, Kameshwar Rao M, Rahul T. A study of gap analysis in hospitals and the relationship between patients’ satisfaction and quality of service in health care services. IJRIM. 2012;2(1):39–51. [Google Scholar]
- 7.Sadigh SM. Service quality in hospitals: more favorable than you might think. Manag Serv Qual. 2003;13(3):197–206. [Google Scholar]
- 8.Zarei A, Arab M, Rahimi Froushani A, Rashidian A, Ghazi Tabatabaei M. Service quality of private hospitals: the Iranian Patients’ perspective. BMC Health Serv Res. 2012;12:31. doi: 10.1186/1472-6963-12-31. [DOI] [PMC free article] [PubMed] [Google Scholar]
- 9.Kucukarslan SN, Nadkarni A. Evaluating medication-related services in a hospital setting using the disconfirmation of expectations model of satisfaction. Research in Social and Administrative Pharmacy. 2008;4:12–22. doi: 10.1016/j.sapharm.2007.01.001. [DOI] [PubMed] [Google Scholar]
- 10.Parasuraman A, Zeithaml VA, Berry LL. Servqual. A multipleitem scale for measuring customer perception quality. Journal of Retailing. 1988;64(1):12–40. [Google Scholar]
- 11.Gopal R, Satvinder S. Impact of hospital services on outpatients satisfaction. International Journal of Research in Business Management (IMPACT, IJRBM) 2014;2(4):37–44. [Google Scholar]
- 12.Parasuraman A, Zeithaml VA, Berry LL. MSI Report. Cambridge: Marketing Science Institute; 1990. An empirical examination of relationships in extended service quality model; pp. 90–122. [Google Scholar]
- 13.Youssef FN, Nel D, Bovaird T. Health care quality in NHS hospitals. Int J Health Care Qual. 1996;9:15–28. doi: 10.1108/09526869610109125. [DOI] [PubMed] [Google Scholar]
- 14.Dengjuin L, YaHsin L, JarYuan P, IngCheau S, Glen R, MingJen C. Chronic kidney-disease screening service quality: questionnaire survey research evidence from Taichung City. BMC Health Serv Res. 2009;9:239. doi: 10.1186/1472-6963-9-239. [DOI] [PMC free article] [PubMed] [Google Scholar]
- 15.Lin DJ, Sheu C, Pai JY, Bair A, Hung CY, Yeh YH, Chou MJ. Measuring patient’s expectation and the perception of quality in LASIK services. Health Qual Life Outcomes. 2009;7:63. doi: 10.1186/1477-7525-7-63. [DOI] [PMC free article] [PubMed] [Google Scholar]
- 16.Ahmed R, Samreen H. Assessing the Service quality of some selected hospitals in Karachi based on the SERVQUAL model. Pakistan Business Review. 2011:266–314. [Google Scholar]
- 17.Lim PC, Tang NKH. A study of patients expectations and satisfaction in Singapore hospitals. Int J Health Care Qual Assur. 2000;13(7):290–299. doi: 10.1108/09526860010378735. [DOI] [PubMed] [Google Scholar]
- 18.Aghamolaei T, Zare SH, Poudat A, Kebriyaei A. Customers perception and expectation of primary health care services quality in health centers of Bandar Abbas. Hormozgan Univ Med Sei J. 2007;3:173–179. [Persian] [Google Scholar]
- 19.Adrienne C, Emma S. Assessing the quality of physiotherapy services using SERVQUAL. Int J Health Qual Assur. 2002;15(5):197–205. [Google Scholar]
- 20.Kebriaei A, Akbari F, Hosseini M, et al. Survey on quality gap in primary health care in Kashan health centers. J Qazvin Univ Med Sci. 2004;31:82–88. (Persian) [Google Scholar]
- 21.Zarei A, Arab M, Rahimi Froushani A, Rashidian A, Ghazi Tabatabaei M. Service quality of private hospitals: the Iranian Patients’ perspective. BMC Health Serv Res. 2012;12:31. doi: 10.1186/1472-6963-12-31. [DOI] [PMC free article] [PubMed] [Google Scholar]
- 22.Caha H. Service quality in private hospitals in Turkey. J Econ Soc Res. 2007;9:55–59. [Google Scholar]
- 23.Abedi Gh, Nadi A, Rostami F, Ashari S. Gap analysis between perception and expectation of recipients from quality of Hemodialysis services in selected university hospitals in Sari. Baltica. 2014;27(1):240–246. [Google Scholar]
- 24.John J, Yatim FM, Mani SA. Measuring service quality of public dental health care facilities in Kelantan, Malaysia. Asia Pac Public health. 2011;23(15):742–753. doi: 10.1177/1010539509357341. doi. org/10.1177/1010539509357341. [DOI] [PubMed] [Google Scholar]


