FIG 1 .
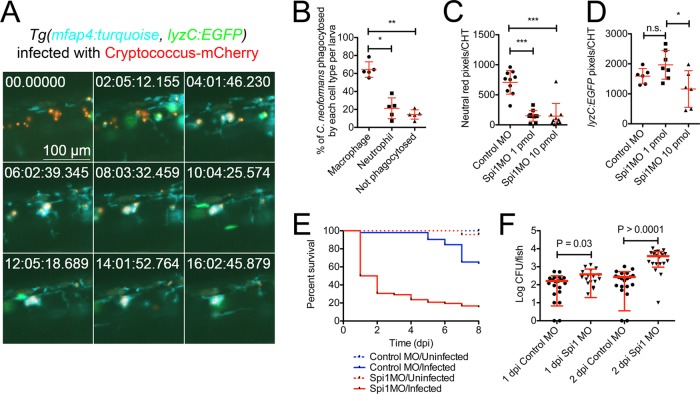
Macrophages are responsible for containing acute C. neoformans infection. (A) Still images spaced 2 h apart from time-lapse imaging from a Tg(lyzC:EGFPNZ117, mfap4:turquoisext27) larva infected with mCherry-expressing C. neoformans starting at 1 h postinfection (neutrophils in green, macrophages in blue, and Cryptococcus in red) (full video available as Movie S1 in the supplemental material). The field of view follows a single cluster of yeast cells that are phagocytosed by macrophages by the 4-h mark of the recording. (B) Quantification of the phagocytic fate of C. neoformans yeast cells at 13 h postinfection in Tg(lyzC:EGFPNZ117, mfap4:turquoisext27) larvae assessed by manual counting. Repeated-measures analysis of variance (ANOVA). The data represent counts from five individual larvae infected with 15 to 30 C. neoformans cells each. (C) Quantification of macrophage numbers by fluorescent pixel count in the caudal hematopoietic tissue (CHT) of uninfected 3-dpf larvae injected with a standard dose of 1 pmol and a high dose of 10 pmol Spi1 morpholino (MO) and soaked in neutral red. ANOVA with Tukey posttest. ***, P < 0.001. (D) Quantification of neutrophil numbers by fluorescent pixel count in the caudal hematopoietic tissue (CHT) of uninfected 3-dpf Tg(lyzC:EGFP) larvae injected with a standard dose of 1 pmol and high dose of 10 pmol Spi1 morpholino. ANOVA with Tukey posttest. *, P < 0.05. (E) Survival of Spi1 knockdown larvae following infection with 50 C. neoformans cells. Log-rank test between infected conditions. P < 0.0001. Data are representative of two experiments each with 15 to 20 larvae per experimental condition. (F) C. neoformans burden in Spi1 knockdown larvae at 1 and 2 days postinfection. t test. Data are pooled from two experiments each with 10 to 20 larvae per experimental condition.

