Abstract
The use of inertial sensors for the gait event detection during a long-distance walking, for example, on different surfaces and with different walking patterns, is important to evaluate the human locomotion. Previous studies demonstrated that gyroscopes on the shank or foot are more reliable than accelerometers and magnetometers for the event detection in case of normal walking. However, these studies did not link the events with the temporal parameters used in the clinical practice; furthermore, they did not clearly verify the optimal position for the sensors depending on walking patterns and surface conditions. The event detection quality of the sensors is compared with video, used as ground truth, according to the parameters proposed by the Gait and Clinical Movement Analysis Society. Additionally, the performance of the sensor on the foot is compared with the one on the shank. The comparison is performed considering both normal walking and deviations to the walking pattern, on different ground surfaces and with or without constraints on movements. The preliminary results show that the proposed methodology allows reliable detection of gait events, even in case of abnormal footfall and in slipping surface conditions, and that the optimal location to place the sensors is the shank.
Keywords: reliability, gait analysis, inertial systems, sensor placement
Keywords: reliability, step phase detection, inertial measurement units, inertial sensors, gait event detection, long-distance walking, human locomotion, abnormal footfall condition, slipping surface condition
1. Introduction
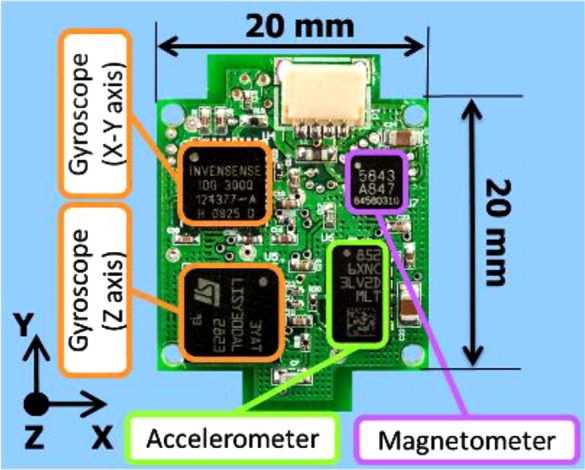
Most of the techniques for a fast evaluation of the human locomotion system status are based on visual observations [1, 2] and manual timing measurements by the physicians [3, 4]. This observational gait analysis is highly subjective and the physician cannot determine important gait phases, such as stance and swing durations, that are recommended in the practice by the Gait and Clinical Movement Analysis Society (GCMAS) [5]. In recent years, some hospitals started using optical motion capture systems such as Vicon [6] or Qualisys [7] for an objective measurement analysis. However, these systems are very expensive to purchase (about 100 000 USD) and maintain. The IMUs (inertial measurement units), such as our Waseda bioinstrumentation system No.3 IMU (WB-3 IMU) (Fig. 1), are a good alternative because they are economically affordable (this prototype cost around 400 USD for each module), wearable, and relatively maintenance-free. Usually, an IMU is composed of sensors able to reconstruct the motion, such as accelerometers and gyroscopes, eventually with additional magnetometers used to give the absolute heading of the unit. Jimenez et al. [8] embedded an IMU inside shoes and demonstrated that a step detection rate of 99.8% (999 steps of free walking) can be obtained using gyroscopes. The step detection was performed by means of thresholds using a separate accelerometer, gyroscope and magnetometer. The detection is a fundamental stage for the stride length estimation by using an inverse pendulum model for the gait [9] and zero velocity update (ZUPT) algorithm [10]. Mannini and Sabatini [11] identified foot strike, flat foot, heel off and toe off using a uni-axial gyroscope that measured the foot instep angular velocity in the sagittal plane. A classifier based on a hidden Markov model (HMM) was applied to a gait treadmill dataset for gait phase detection. However, it is harder to find the sensor signal pattern stability that is necessary for leverage of the generalisation capability shown by the HMM-based classifier. Therefore, the extension of their method to different gait patterns and different surfaces is not straightforward. Tong and Granat [12] used gyroscopes attached to the skin surface of the shank and thigh segments; they showed that the signals from the gyroscope on the shank (r = 0.94) had a higher correlation to the signals of an optical system, with respect to the gyroscope on the thigh (r = 0.91). A problem was noticed when performing a turn: the signals of segment inclination and knee angle drifted.
Figure 1.
WB-3 IMU
Two methods were used to solve this issue: automatic reset of the system to re-initialise the angle in each gait cycle, and high-pass filtering. Both methods successfully corrected the drift, but the first method requires the evaluation of the gait events, again highlighting the importance of event detection, while the second uses a cut-off frequency that is chosen heuristically. Jasiewicz et al. [13] measured the timing error on the initial contact (IC) and the end contact events using an accelerometer in the foot and gyroscopes on the foot and shank. They compared these results with footswitch sensors on able-bodied (978 steps) and spinal-cord injured individuals (1170 steps). They found that the event detection was performed without a relevant difference in the case of normal individuals, while the best results were obtained by the gyroscope and the accelerometer in the foot position for the abnormal footfall (error of 17–28 ms), while no relevant difference can be observed in the normal footfall. However, this research did not consider the possible effects of different surfaces on the event detection. The study of the event detections in slipping surfaces is particularly important because injuries and fractures sustained by pedestrians in winter on slippery walking surfaces covered by snow and ice is relevant, especially in elderly subjects [14]. Inertial sensors have been used for the fall detection [15] and proper gait event detection could give more insight on the walking pattern before the fall. The previous research clearly showed that event detection weakly depends on the sensor position in the case of normal walking. In the case of abnormal gait, the characteristic of walking strongly affects the performance of the event detection depending on the position of the sensors. However, a specific study on the optimal position depending on the walking surface and walking patterns with joint constrains has not been done yet. Therefore it is difficult to provide guidelines for the physicians for the best sensor placement meaning that they now mainly rely on their experience.
The objective of this Letter is to study the effect of the sensor position for the correct detection of the gait events in the cases of normal and abnormal gait patterns on different surfaces. In particular, we compared two different surfaces: (i) linoleum pavement; and (ii) synthetic snow, three centimetres deep, placed on polyethylene sheets firmly adherent to the linoleum pavement. We selected these conditions to verify if walking on slipping surfaces affected the event detection. We also compared three different walking patterns: natural walking (NW), walking with pathological simulator (WPS), WPS and orthosis (WPSO). We selected this setup to explore the event detection in asymmetric gait. The evaluation has been conducted using the time features that are normally used to determine the effect of aging on walking such as the step period (SP) and variability [16] or in the stance phase (ST) that is used to determine symmetry in gait [17, 18].
2. Material and methods
This Section presents the details of the proposed IMU-based measurement system, as well as the protocols for the experiments. The experimental research was carried out at the National Rehabilitation Center of Tokorozawa, Japan, with healthy adult volunteers. All the experiments were conducted with non-invasive devices, without risk for the health of the participants. The experiment was performed in accordance with the ethical standard defined by the committee of Waseda University and in accordance with the ethical standards laid down in the 1964 Declaration of Helsinki and its later amendments. In addition, the experiment was videoed. The right to privacy of the subjects has been fully respected; the subjects have been extensively informed and asked for the consent to the experiment, also taking into account their age and their health conditions, according to the existing national and international laws and regulations. The experimental data and all the personal information, whether electronic, written or oral, were anonymised and used only for statistical analysis.
2.1. Sensors for the movement recording
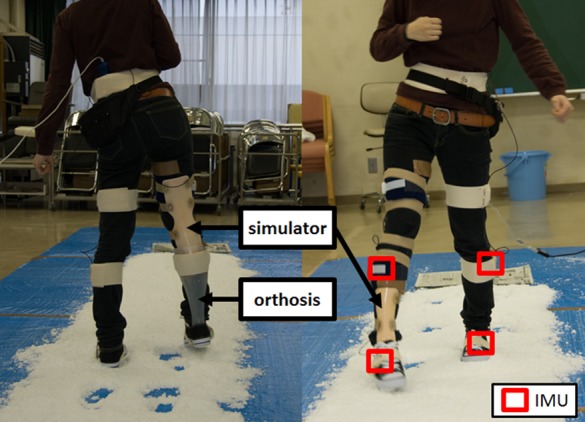
The WB-3 IMU is a nine-axis inertial sensor that incorporates a three-axis accelerometer, a three-axis gyroscope and a three-axis magnetometer. A customised design allowed a very compact and lightweight design that is very suitable for the application in rehabilitation. More details about the IMU hardware characteristics and performance evaluation are available in [19]. Four synchronised WB-3 IMUs acquired data at a sample rate of 100 Hz and were connected via CAN BUS at 1 Mbit/s with a standard personal computer for the continuous data logging. The total weight of the measurement system was only 600 g including IMUs, central board, cables, support bands and batteries. Two WB-3 IMUs on the shoes were fixed between the heel cap and an external quarter to avoid any walking obstruction. Bandages fastening two WB-3 IMUs to the lower leg, respectively, on the medial position of the tibia to avoid any walking obstruction and to reduce the errors due to motion artefacts as illustrated in Fig. 2 on the right side [20]. The timing errors for the IMUs are <20 ms on average, which is equivalent to the timing resolution of a video camera [11, 21]. Therefore a digital high resolution video camera (1440 × 1080 at 60 frames/s) was used to record the experiments. The video camera on a tripod shot in the direction of walking to visualise the entire path and clearly identify the gait events.
Figure 2.
Setup of experiment on snow
Back view (left) and frontal view (right)
2.2. Experiment protocol
Three female subjects (Table 1) were the healthy subjects that kindly agreed to participate to the experiments. All the subjects wore the same type of sneakers, canvas non-supportive shoes, and the subjects performed a 5 m straight line walking, repeating the experiments five times under different surface conditions and joint constraints. The first and last gait cycles were excluded from the analysis to avoid acceleration and deceleration phases and we could observe a total of 2460 steps. The experiments were divided into three different sessions: NW, WPS and WPSO. NW: the subjects were asked to walk at natural speed on a straight line. WPS: the subjects wore a pathological gait simulator (Fig. 2) that constrains the left ankle and knee joints and repeat the walking experiment under the two surface conditions. An expert doctor instructed the subjects to emulate the walking style of a patient with unilateral paralysis. Two free trials were performed before the actual experiment. WPSO: the subjects wore the pathological simulator and an ankle orthosis that is used in the rehabilitation practice to correct the gait of patients with hemiplegia. The subjects were asked to repeat the walking experiment under the two surface conditions and two free trials were performed before the actual experiment.
Table 1.
Characteristics of subjects
| Subject | Gender | Age | Height, cm | Weight, kg |
|---|---|---|---|---|
| 1 | F | 20 | 156 | 47 |
| 2 | F | 21 | 158 | 73 |
| 3 | F | 24 | 158 | 52 |
2.3. Data analysis and gait features
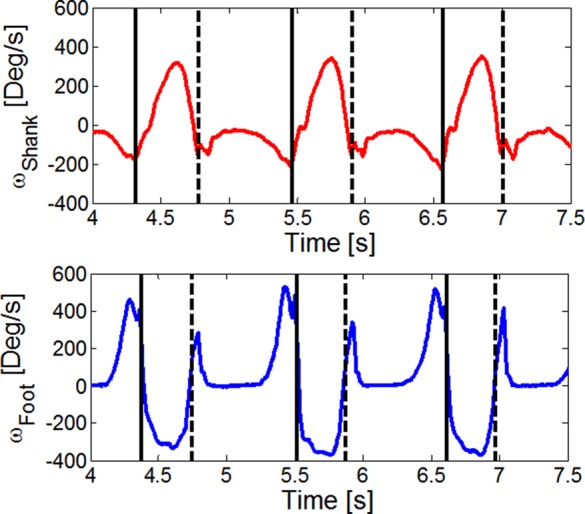
The video was manually segmented. We identified the IC and terminal contact (TC) of the left and right foot and we removed the events corresponding to the first and the last steps. The subjects in the natural walking always started with the right leg; therefore we identified them as right footed. We constrained the left side in the experiments with the simulator. We determined the IC and the TC from the sagittal velocity using the method described in [13]. In the case of the foot sensor, we identified the TC with an automatic algorithm that searched for the first zero crossing point after the maximum of the angular velocity as shown in the bottom part of Fig. 3 (black continuous lines). The following zero crossing point corresponds to the IC because the foot stops the dorsiflexion phase and then rapidly flexes, as shown in the bottom part of Fig. 3 (black dotted lines). The TC, automatically detected with the shank sensor, is the first minima of the sagittal angular velocity as shown in the top part of Fig. 3 (black continuous lines). The IC corresponds to the second minima after the peak of the sagittal angular velocity, as shown in the top part of Fig. 3 (black dotted line). We performed a manual comparison of the events detected with the video and the events detected by the IMUs on the foot and the shank.
Figure 3.
Sagittal angular velocities for foot (bottom), and shank (top)
3. Results
The correlation coefficients are evaluated for the whole experiment as a global parameter of the event detection quality. The analysis was conducted according to the parameter proposed by the GCMAS (stride period, SP, ST, swing phase (SW) and symmetry). A perfect synchronisation between the camera and sensors was not necessary because the evaluation was performed according to parameters that depend on interval of times and not the absolute time in which the event occurs.
3.1. Stride period or cycle time (CT)
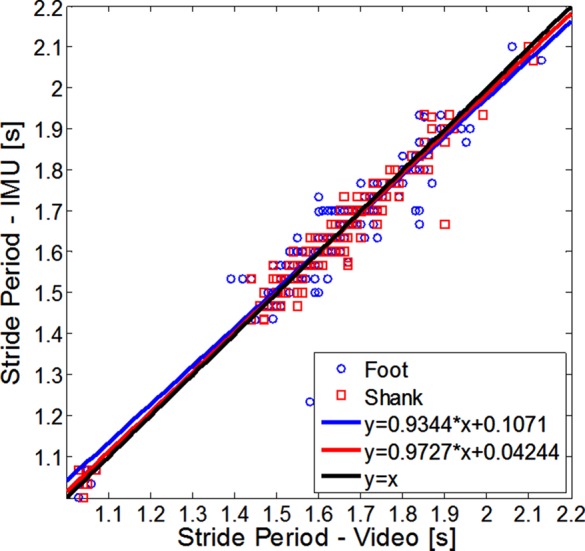
It is defined as the period of time from IC of one foot to the following IC of the same foot, expressed in seconds. We computed it as the time difference between two consecutive ICs on the same side. Figs. 4 and 5 show the scatter graphs of the stride period for the first subject of the left side (normal footfall) and right side (abnormal footfall), respectively. In the horizontal axis, the variable is estimated from the video, while in the vertical axis the variable is estimated with the IMU.
Figure 4.
Scatter graph for stride period of normal footfall (subject 1)
Figure 5.
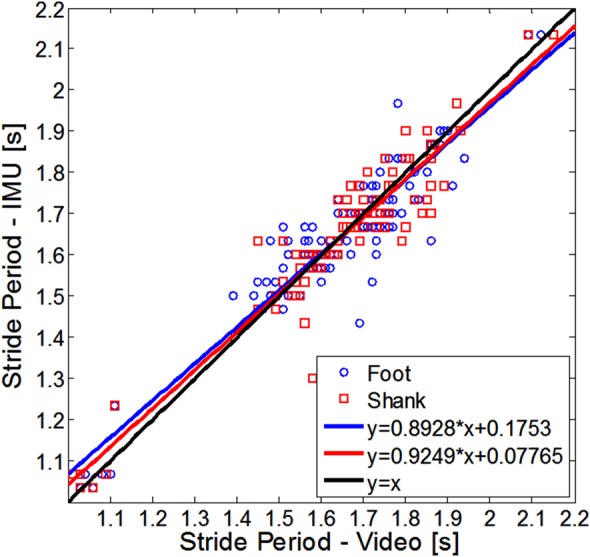
Scatter graph for stride period of abnormal footfall (subject 1)
The values estimated from the sensor on the shank are shown in red, whereas the values estimated from the sensor on the foot are shown in blue. The IMU on the shank identified the IC event better than the IMU on the foot (foot-video r = 0.9045, shank-video r = 0.9231). The high correlation values indicate that, if the IC is correctly identified, then the CT value is reliable. Furthermore, there is not substantial difference in the detection between normal footfall and abnormal footfall.
3.2. Step period
As defined by the Gait and Clinical Movement Analysis Society, the SP is the period of time taken for one step and is measured from an event of one foot to the following occurrence of the same event with the other foot, expressed in seconds. This definition does not specify which event must be selected. In order to verify the reliability of the SP calculation in respect to the events, we calculated the scatter graphs of the first subject for the SP evaluated by using two consecutive ICs (Fig. 6) or two consecutive TCs (Fig. 7). The cross-correlation coefficients related to the SP estimation based on the ICs (shank-video r = 0.7903, foot-video r = 0.8610) indicate that the ICs are robustly identified both in the foot and shank. In the case of the evaluation by using two consecutive TCs, the cross-correlation between the video and the sensor in the shank is still acceptable (r = 0.7181). However, the cross-correlation test fails for the sensor on the foot (r = 0.5429). In general, lower values of cross-correlations indicate that the TC is not determined with the same accuracy of the IC. Therefore the evaluation of the TC as first zero-crossing in the sagittal angular velocity seems to be more critical. This result is in accordance with [11], in which the heel off timing errors was higher than the foot strike timing errors.
Figure 6.
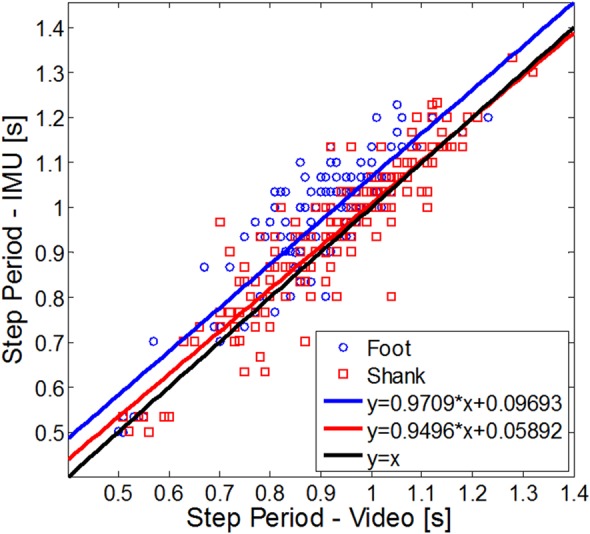
Scatter graph for SP evaluated using two consecutive ICs (subject 1)
Figure 7.
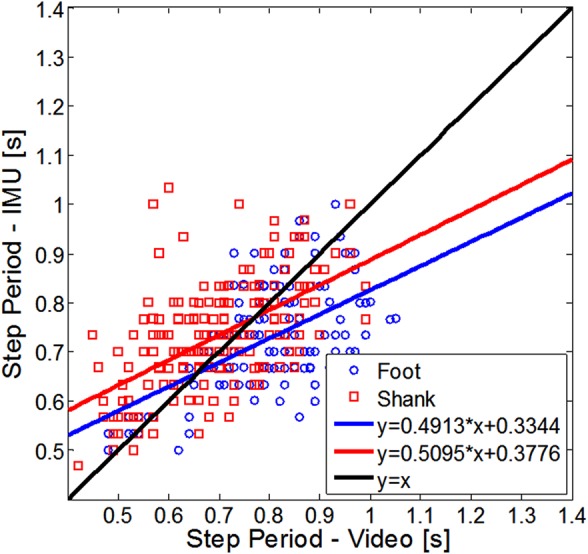
Scatter graph for SP evaluated using two consecutive TCs (subject 1)
3.3. Stance phase
The ST is the period of time when the foot is in contact with the ground, expressed in seconds. We computed the time difference between the TC and the previous IC detected on the same side.
Fig. 8 shows the scatter graph of the ST for the first subject. The cross-correlation coefficients (foot r = 0.7024, shank r = 0.8741) suggest also in this case that the sensor on the shank is more suitable for the evaluation of this parameter that is used to reset the linear velocity in the ZUPT algorithm for the estimation of the step length [22].
Figure 8.
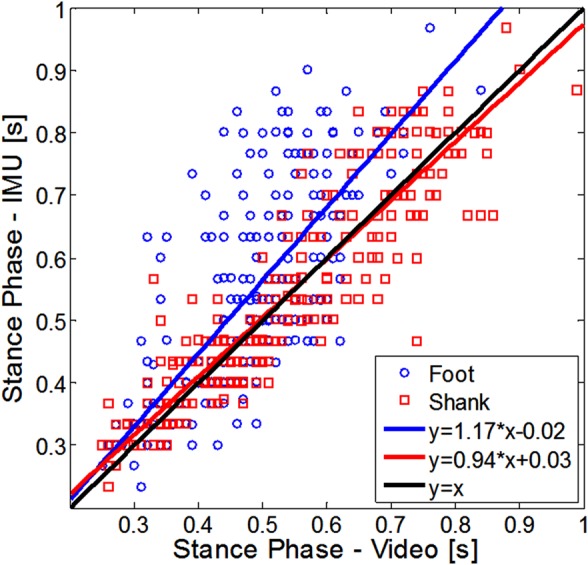
Scatter graph for ST (subject 1)
3.4. Swing phase
SW is the period of time when the foot is not in contact with the ground. In those cases where the foot never leaves the ground, it can be defined as the phase when all portions of the foot are in the forward motion. We computed the time difference between the IC and the previous TC detected on the same side. The SW determines the step length, therefore it is fundamental to estimate it precisely [22]. Fig. 9 shows the scatter graph of the SW for the first subject. The sensor on the shank identifies the swing more consistently than the sensor on the foot as it is possible to verify from the graph and the cross-correlation coefficients with the video (foot r = 0.8486, shank r = 0.9484).
Figure 9.
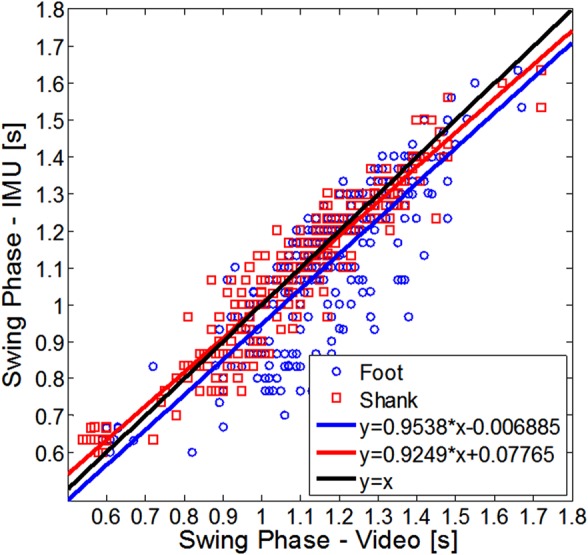
Scatter graph for SW (subject 1)
3.5. Symmetry
Symmetry is the ratio of the stance period to the swing period. This dimensionless variable is used to measure the symmetry of the gait, such as in the case of stroke patients [17]. Sometimes the symmetry is evaluated as the ratio between the swing times of two consecutive steps using the longer step (i.e. abnormal footfall against normal footfall as the denominator). In this study, we considered the first definition because it depends on a good evaluation of the swing and ST.
Fig. 10 shows the scatter graphs of the swing to stance ratio for the left side of the first subject (normal footfall). Fig. 11 shows the scatter graphs for the right side of the first subject (abnormal footfall). The IMU on the shank identifies the IC event better on the side that has not constrained the ranges of movements, normal footfall (r = 0.8079) than the constrained leg, abnormal footfall (r = 0.7199). Conversely, there is a substantial difference in the detection for the sensor on the foot (normal footfall r = 0.7493, abnormal footfall r = 0.3877).
Figure 10.
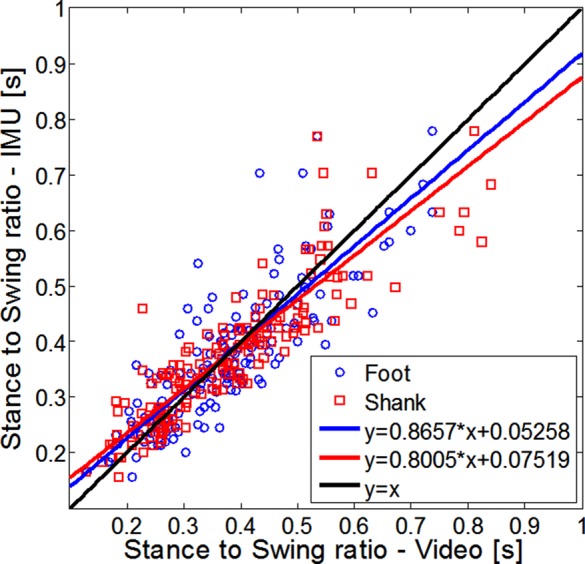
Scatter graph for stance to swing ratio of normal footfall (subject 1)
Figure 11.

Scatter graph for stance to swing ratio of abnormal footfall (subject 1)
3.6. Detection rate
The number of events detected for the left and right sides was the same. Table 2 shows that there were several misdetections for the sensor on the foot in snow surface both with the simulator and the simulator/orthosis. The reason is that the classical pattern of the angular velocity in the foot is not clearly visible in the abnormal footfall (Fig. 12 bottom). However, the pattern is identifiable for the shank, allowing the automatic event detection (Fig. 12 top).
Table 2.
Event detections
| Experiment | GT (Video) | Shank | % | Foot | % |
|---|---|---|---|---|---|
| natural walking – linoleum | 180 | 180 | 100 | 90 | 100 |
| natural walking-snow | 240 | 240 | 100 | 240 | 100 |
| simulator – linoleum | 420 | 420 | 100 | 420 | 100 |
| simulator – snow | 480 | 480 | 100 | 312 | 65 |
| simulator/orthosis – linoleum | 600 | 600 | 100 | 600 | 100 |
| simulator/orthosis – snow | 540 | 540 | 100 | 356 | 65.9 |
Figure 12.
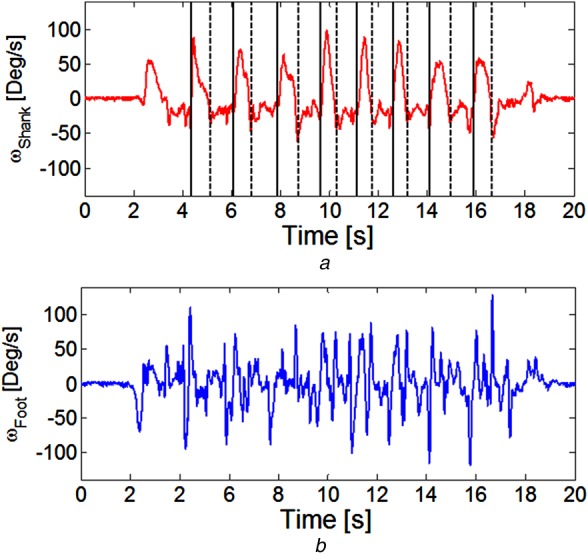
Angular speed of foot (bottom) and shank (top) for walking with simulator on snow
Black vertical lines represent the detections of IC (dotted lines) and TC (continuous lines)
4. Conclusions
In the field of gait analysis, the use of IMU events detection during walking brings advantages in term of cost and time. Different studies have already proposed to locate IMU on foot or shank; however, there was not a suggestion on the best position for the sensors, which makes it objectively difficult for physicians to practically use the suggested hardware and models. In addition, very few studies have compared normal and other walking conditions related to limit on the range of movements or different ground surfaces. In this Letter, we have used the correlations between data from IMU and videos to analyse the optimal location of the IMU sensors for the event detection; data have been processed into the standard recognised parameters proposed by the GCMAS. It is interesting to notice that for the CT, the cross-correlations, in case of sensors placement on foot and shank, were both over 0.9. Inversely, huge differences were found in case of IC and TC of the SP: the cross-correlations in case of shank and foot location were both acceptable for the IC, while the foot cross-correlation was in the order of 0.5 for the TC, making it unusable for this parameter estimation, against 0.71 in case of placement on the shank. Stance (foot r = 0.7024, shank r = 0.8741) and swing (foot r = 0.8486, shank r = 0.9484) phases both showed a higher value of cross-correlation of the shank against the foot location. We have analysed the values for normal and abnormal footfall of the symmetry. In this case, while in the normal footfall both locations presented acceptable cross-correlations, in the case of abnormal walking, the results were r-foot = 0.38 and r-shank = 0.72, making the information coming from the sensors placed on the foot unusable. Finally, we analysed the event detection in the case of abnormal walking, and also in this case the sensors placed on shank outperformed the ones on the foot. This pilot study shows an evident advantage on the use of the IMU on the shank for the gait detection in terms of reliability and precision of the detection. Further analysis is needed to confirm these findings, considering different trajectories, because misdetections and changes on the walking pattern might occur during changes of direction.
5. Acknowledgments
The authors express their gratitude to the Italian Ministry of Foreign Affairs, General Directorate for Cultural Promotion and Cooperation, for its support to RoboCasa. The authors also express their thanks to STMicroelectronics, Life Performance Research, Okino Industries LTD, Japan ROBOTECH LTD, SolidWorks Corp, Dyden, for their support to the research.
6. Funding and declaration of interests
Conflict of interest: none declared.
This research has been supported by the JSPS Scientific Research-C grant [24500616], the JSPS Grant-in-Aid for Young Scientists (Wakate B) [25750259], the Waseda University Grant for Special Research Projects (for new full-time faculty) [2014S-091], the Global COE Program ‘Global Robot Academia’, MEXT, Japan, and the Consolidated Research Institute for Advanced Science and Medical Care, Waseda University (ASMeW).
This work has been also partially supported by a grant from STMicroelectronics, which also provided the core sensors and the microcontroller.
7 References
- 1.Ferrarello F., Bianchi V.A.M., Baccini M., et al. : ‘Tools for observational gait analysis in patients with stroke: a systematic review’, Phys. Ther., 2013, 93, (12), pp. 1673–1685 (doi: ) [DOI] [PubMed] [Google Scholar]
- 2.Brunnekreef J.J., van Uden C.J., van Moorsel S., Kooloos J.G.: ‘Reliability of videotaped observational gait analysis in patients with orthopedic impairments’, BMC Musculoskelet. Disord., 2005, 6, (1) (doi: ) [DOI] [PMC free article] [PubMed] [Google Scholar]
- 3.Robinson J.L., Smidt G.L.: ‘Quantitative gait evaluation in the clinic’, Phys. Ther., 1981, 61, (3), pp. 351–353 [DOI] [PubMed] [Google Scholar]
- 4.Cerny K.: ‘A clinical method of quantitative gait analysis suggestion from the field’, Phys. Ther., 1983, 63, (7), pp. 1125–1126 [DOI] [PubMed] [Google Scholar]
- 5.Oberg T., Karsznia A., Oberg K.: ‘Basic gait parameters: reference data for normal subjects, 10–79 years of age’, J. Rehabil. Res. Dev., 1993, 30, (2), pp. 210–223 [PubMed] [Google Scholar]
- 6.‘Vicon Systems’, 2009, Available at: http://www.vivometrics.com/
- 7.‘Motion capture – Mocap – qualisys motion capture systems’, Available at: http://www.qualisys.com/, Accessed: 20 August 2014
- 8.Jimenez A.R., Seco F., Prieto C., Guevara J.: ‘A comparison of Pedestrian Dead-Reckoning algorithms using a low-cost MEMS IMU’. IEEE Int. Symp. on Intelligent Signal Processing, WISP 2009, Budapest, Hungary, August 2009, pp. 37–42 [Google Scholar]
- 9.Alvarez J.C., Alvarez D., Lopez A., Gonzalez R.C.: ‘Pedestrian navigation based on a waist-worn inertial sensor’, Sensors, 2012, 12, (8), pp. 10536–10549 (doi: ) [DOI] [PMC free article] [PubMed] [Google Scholar]
- 10.Ojeda L., Borenstein J.: ‘Non-GPS navigation for security personnel and first responders’, J. Navig., 2007, 60, (3), pp. 391–407 (doi: ) [Google Scholar]
- 11.Mannini A., Sabatini A.M.: ‘Gait phase detection and discrimination between walking-jogging activities using hidden Markov models applied to foot motion data from a gyroscope’, Gait Posture, 2012, 36, (4), pp. 657–661 (doi: ) [DOI] [PubMed] [Google Scholar]
- 12.Tong K., Granat M.H.: ‘A practical gait analysis system using gyroscopes’, Med. Eng. Phys., 1999, 21, (2), pp. 87–94 (doi: ) [DOI] [PubMed] [Google Scholar]
- 13.Jasiewicz J.M., Allum J.H.J., Middleton J.W., et al. : ‘Gait event detection using linear accelerometers or angular velocity transducers in able-bodied and spinal-cord injured individuals’, Gait Posture, 2006, 24, (4), pp. 502–509 (doi: ) [DOI] [PubMed] [Google Scholar]
- 14.Ralis Z.A.: ‘Epidemic of fractures during period of snow and ice’, BMJ, 1981, 282, (6264), pp. 603–605 (doi: ) [PMC free article] [PubMed] [Google Scholar]
- 15.Pannurat N., Thiemjarus S., Nantajeewarawat E.: ‘Automatic fall monitoring: a review’, Sensors, 2014, 14, (7), pp. 12900–12936 (doi: ) [DOI] [PMC free article] [PubMed] [Google Scholar]
- 16.Kovacs C.R.: ‘Age-related changes in gait and obstacle avoidance capabilities in older adults: a review’, J. Appl. Gerontol., 2005, 24, (1), pp. 21–34 (doi: ) [Google Scholar]
- 17.Patterson K.K., Gage W.H., Brooks D., Black S.E., McIlroy W.E.: ‘Changes in gait symmetry and velocity after stroke: a cross-sectional study from weeks to years after stroke’, Neurorehabil. Neural Repair, 2010, 24, (9), pp. 783–790 (doi: ) [DOI] [PubMed] [Google Scholar]
- 18.Senanayake C.M., Senanayake S.M.N.A.: ‘Computational intelligent gait-phase detection system to identify pathological gait’, IEEE Trans. Inf. Technol. Biomed., 2010, 14, (5), pp. 1173–1179 (doi: ) [DOI] [PubMed] [Google Scholar]
- 19.Sessa S., Zecca M., Lin Z., Bartolomeo L., Ishii H., Takanishi A.: ‘A methodology for the performance evaluation of inertial measurement units’, J. Intell. Robot. Syst., 2013, 71, (2), pp. 143–157 (doi: ) [Google Scholar]
- 20.Forner-Cordero A., Mateu-Arce M., Forner-Cordero I., Alcántara E., Moreno J.C., Pons J.L.: ‘Study of the motion artefacts of skin-mounted inertial sensors under different attachment conditions’, Physiol. Meas., 2008, 29, (4), pp. 21–31 (doi: ) [DOI] [PubMed] [Google Scholar]
- 21.Kawamura K., Morita Y., Okamoto J., et al. : ‘Gait phase detection using foot acceleration for estimating ground reaction force in long distance gait rehabilitation’, J. Robot. Mechatron., 2012, 24, (5), pp. 828–837 [Google Scholar]
- 22.Meng X., Zhang Z., Wu J., Wong L.: ‘Hierarchical information fusion for global displacement estimation in micro-sensor motion capture’, IEEE Trans. Biomed. Eng., 2013, 60, (7), pp. 2052–2063 (doi: ) [DOI] [PubMed] [Google Scholar]


