

Abstract
AIM: To find new potential biomarkers and to establish patterns for early detection of colorectal cancer.
METHODS: One hundred and eighty-two serum samples including 55 from colorectal cancer (CRC) patients, 35 from colorectal adenoma (CRA) patients and 92 from healthy persons (HP) were detected by surface-enhanced laser desorption/ionization mass spectrometry (SELDI-MS). The data of spectra were analyzed by bioinformatics tools like artificial neural network (ANN) and support vector machine (SVM).
RESULTS: The diagnostic pattern combined with 7 potential biomarkers could differentiate CRC patients from CRA patients with a specificity of 83%, sensitivity of 89% and positive predictive value of 89%. The diagnostic pattern combined with 4 potential biomarkers could differentiate CRC patients from HP with a specificity of 92%, sensitivity of 89% and positive predictive value of 86%.
CONCLUSION: The combination of SELDI with bioinformatics tools could help find new biomarkers and establish patterns with high sensitivity and specificity for the detection of CRC.
INTRODUCTION
Colorectal cancer (CRC) is one of the most common malignant tumors that threaten people’s health[1-5]. At present, CRC is one of the three leading causes of worldwide cancer mortality and the second leading cause of cancer-related deaths in the Western world[6,7]. The prognosis of CRC is strongly related to early diagnosis. CRC patients diagnosed in early stage have a five-year survival post-operation of over 80%, but in the advanced stage the five-year survival is lower than 40%. So, early diagnosis is very important to improve the prognosis of CRC[8].
Recently serum tumor markers, such as carcinoembryonic antigen (CEA), are commonly used to detect CRC for the advantages of less pain and accessibility. However all the existing biomarkers have a low diagnostic sensitivity in CRC (sensitivity of 23% with CEA[9]). New biomarkers with a high sensitivity and specificity to detect CRC in early stage are urgently needed. A novel proteomic approach for the detection of cancer which is called surface enhanced laser desorption/ionization time-of-flight mass spectrometry (SELDI-TOF MS), and ProteinChip technology, have been developed. SELDI-TOF MS coupled with bioinformatics approach has successfully found new biomarkers and achieved high sensitivity and specificity for the diagnosis of cancers of bladder[10], prostate[11-14], ovary[15,16], breast[17,18], liver[19], neck[20], lung[21,22] , pancreas[23].
The aim of this study was to find the potential biomarkers in CRC and to establish the patterns to diagnose CRC.
MATERIALS AND METHODS
Samples
A total of 182 serum samples were obtained from the serum banks of the Cancer Institute of the Second Affiliated Hospital of Zhejiang University Medical College. The cancer group consisted of 55 serum samples from CRC patients at different clinical stages: Dukes’ A (n = 8), Dukes’ B (n = 22), Dukes’ C (n = 13), Dukes’ D (n = 12). The median age of CRC patients was 57 years (range, 31-84 years). The two non-cancer control groups included 35 serum samples from patients with colorectal adenoma (CRA) and 92 serum samples from healthy persons (HP). They were age and sex matched with cancer group. Diagnoses were pathologically confirmed, and specimens were obtained before treatment. All samples were stored at -80 °C.
Proteinchip array analysis
Serum samples were thawed in ice and centrifuged at 3 000 r/m for 5 min at 4 °C, supernatants were retained. We added 90 µL of 5 g/L CHAPS (Sigma) (pH7.4) in PBS to 10 µL of each serum sample, and vortex-mixed them. The diluted samples were added to 100 µL Cibacron Blue 3GA (Sigma) (previously equilibrated with 5 g/L CHAPS three times) in a 96-well cell culture plate and agitated on a platform shaker at 4 °C for 60 min. After centrifuged at 1 000 r/m, 50 µL supernatant was sampled and further diluted by 150 µL 20 mmol/L HEPES (pH7.4) and applied to each well of a bioprocessor (Ciphergen Biosystems) containing hydrophobic surface (H4) chips previously activated with 20 mmol/L HEPES. The bioprocessor was then sealed and agitated on a platform shaker for 60 min at 4 °C. The excess serum mixtures were discarded, and the chips were washed three times with 20 mmol/L HEPES and 2 times with deionized water. The chips were then removed from the bioprocessor, air-dried. Before SELDI analysis, 0.5 µL of a saturated solution of α-cyano-4-hydroxycinnamic acid (CHCA) in 0.5 L/L acetonitrile and 5 mL/L trifluoroacetic acid was applied onto each chip twice, air-dried.
Chips were detected on the protein biological system II (PBS-II) plus a mass spectrometer reader (Ciphergen Biosystems). Data were collected by averaging 65 laser shots with an intensity of 135, a detector sensitivity of 7, a highest mass of 30 000 Da and an optimized range of 2 000-20 000 Da. Mass accuracy was calibrated to less than 0.1% using the all-in-one peptide molecular mass standard (Ciphergen Biosystems).
Bioinformatics analysis
The spectra intensities of all samples were normalized to the total ion current of m/z between 2 000 and 30 000 Da. The noise of spectra was filtrated and peaks were detected with an automatic peak detection pass using signal-to-noise ratio. Peak clusters were completed to cluster the peaks in different samples that had similar masses (defined by a mass window in 0.3% mass error). All these were performed using ProteinChip Software 3.1 (Ciphergen). The peak intensities were preprocessed by scaling all the data to the range[-1, 1].
The pattern recognition techniques were applied to diverse areas including prediction of cancer[24], gene microarray[25] and mass spectrometry[26]. We utilized a multi-layer perception (MLP) ANN with a scaled conjugate gradient (SCG) optimized back propagation algorithm for discriminating CRC from HP, and a linear support vector machine (SVM) for discriminating CRC from CRA. They were powerful tools for analysis of the complex data[14] derived from SELDI-MS.
Feature selection
We estimated the power of each peak in discriminating different group samples by integrating approaches such as t-test, receive option curve (ROC) and mean square error (MSE) of ANN.
The ANN used to calculate the MSE of each peak had 3 layers, with 1 node in input and output layer, 2 nodes in hidden. For each peak the ANN was trained with all the samples, performed 1 000 epochs to get the MSE respectively. The MSE was calculated as the difference between the target output and the ANN predictive value. The lower MSE value of the peak showed a higher relative importance value for their ability to accurately discriminate the different groups.
Integrated ANN classifier
The ANN established for discriminating different groups had 4 layers. Except output layer and input layer ANN also had 2 hidden layers each with 100 nodes. We randomly selected 1/3 of all the samples to be the blinded test set, and the remaining 2/3 samples for training, the procedure was repeated 10 times.
In the procedure of training ANN we used a cross-validation approach to reduce the risk of “over fit”[27]. The samples for training were randomly divided into 2 sets: 2/3 samples for training set and 1/3 samples for validation set. The random shuffling was redone 100 times. Thus 100 different ANNs were established to predict the blinded test set samples. The predictive values of the blinded test set samples were the average of all the predicted outputs of 100 ANNs.
SVM classifier
SVM is a new machine learning approach originally proposed and developed by Vladimir Vapnik. SVM applications were actively pursued in various areas recently, from genomics to face recognition[28,29]. SVM is powerful for small sample data. We used the linear SVM classifier and set the cost of the constrain violation (C) to 1. The 3-fold cross-validation approach was applied to estimate the accuracy of the classifier.
RESULTS
Bioinformatics analysis of CRC and HP data
After noise was filtrated by Ciphergen ProteinChip Software 3.1, there were 61 peaks detected for discriminating CRC from HP and 235 peaks for discriminating CRC from CRA. The peaks were between 2 k and 30 kDa. Peaks with an m/z < 2 kDa were mainly ion noise from the matrix and therefore excluded[10].
The 61 qualified peaks detected from the two groups were ranked by the MSE values of ANN. We input the 61 peaks respectively. For each peak we trained the ANN with all the 147 healthy and CRC samples to give an MSE value. The top 15 peaks with lower MSE values were selected for further analysis (Figure 1). The t-test and ROC method confirmed the results with the same 15 peaks.
Figure 1.

MSE values of the top 15 peaks. A: m/z of peaks. B: MSE values of peaks.
To further select the set of candidate biomarkers, we used a stepwise approach in which many integrated ANNs were trained. The top 1 peak with the highest ability to predict the two groups (had the lowest MSE value) was selected as a single input to build the integrated ANN. We estimated the discriminating ability of this integrated ANN by the accuracy of blind test set. Next, the top 2 peaks were input to integrated ANN and the accuracy was calculated. The following peaks were added as input stepwise to train integrated ANN and the accuracy was calculated. In this way, the 15 models combining different peaks were built. The peaks input to the model with the highest accuracy were selected as the set of potential biomarkers. The top 4 peaks were finally selected as potential biomarkers, an accuracy of 92% was achieved. The accuracies of these 15 models are plotted in Figure 2 (A).
Figure 2.

Accuracies of different combinations of peaks. A: Accuracies of different combinations of peaks in the pattern discriminating CRC patients from HP. B: Accuracies of differ-ent combinations of peaks in the pattern discriminating CRC patients from CRA patients.
The m/z of the 4 candidate biomarkers were 5 911, 8 922, 8 944, 8 817 Da. These 4 peaks all appeared to highly express in CRC and lowly express in healthy persons, as shown in Figure 3 (A, B). Between the two groups, the P value of t-test (< 10-9) and the area under the ROC curve (> 8.0) showed statistical significance of all the 4 peaks. Table 1 shows the descriptive statistics of the 4 peaks.
Figure 3.
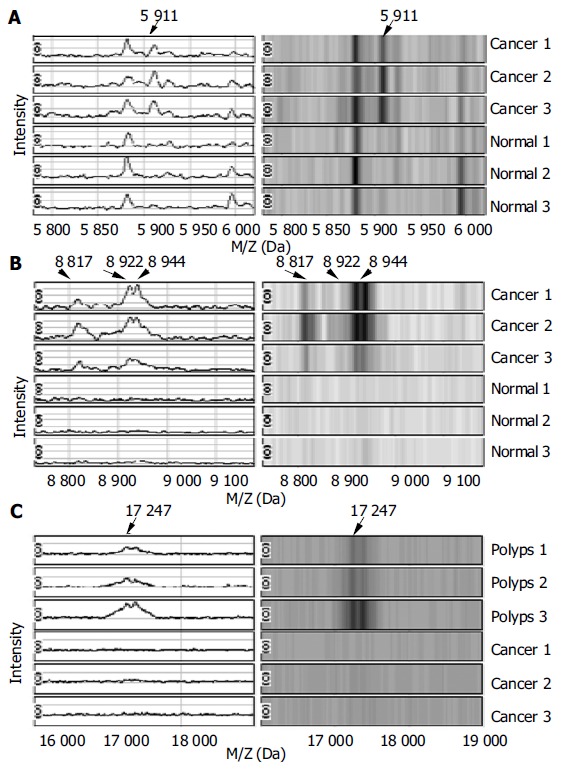
Spectra and gel maps of potential biomarkers. A: Spectra and gel maps of the peak with the m/z of 5 911 Da. B: Spectra and gel maps of the peak with the m/z of 8 922, 8 944, 8 817 Da. C: Spectra and gel maps of the peak with the m/z of 17 247 Da.
Table 1.
Descriptive data for the 4 potential biomarkers in the pattern discriminating CRC patients from HP (mean ± SD)
| M/Z (Da) | AUC | HP | CRC patients |
| 5 911 | 0.908 | 0.824 ± 0.504 | 2.763 ± 1.720 |
| 8 922 | 0.872 | 1.254 ± 0.724 | 2.767 ± 1.445 |
| 8 944 | 0.828 | 0.999 ± 0.626 | 2.651 ± 1.851 |
| 8 817 | 0.811 | 0.878 ± 0.607 | 1.744 ± 0.940 |
AUC: Area under the carve.
The 4 peaks were combined and evaluated by integrated ANN. We trained the integrated ANN with 89 samples and tested 49 samples. We randomly selected the test set 10 times, and each time 100 ANNs were built to predict the test set. So 1 000 ANNs were built up. Table 2 shows the results of this classifier. For the integrated ANN classifier, the estimated specificity in the blind test set was 92% with a 95% confidence interval of 89%-95%, the estimated sensitivity was 89% (85%-93%), the estimated positive predictive value was 86% (82%-90%).
Table 2.
Predicted results of classifier for discriminating CRC patients from HP
|
Test set (49 × 10) |
Training set (98 × 10) |
|||
| HP | CRC | HP | CRC | |
| HP (92 × 10) | 287 | 25 | 599 | 9 |
| CRC (55 × 10) | 19 | 159 | 29 | 343 |
| Specificity (%) | 92 (287/(287 + 25)) | 99 (599/(599 + 9)) | ||
| Sensitivity (%) | 89 (159/(159 + 19)) | 92 (343/(343 + 29)) | ||
| Positive value (%) | 86 (159/(159 + 25)) | 97 (343/(343 + 9)) | ||
Bioinformatics analysis of CRC and CRA data
The 235 qualified peaks detected from the two groups were ranked by the P values of t-test. The top 15 peaks were selected for further analysis. For these data we utilized the 3-fold cross-validation SVM classifier to select the potential biomarkers to build the model to predict the test sets. This approach randomly selected 1/3 of samples to be the blinded test set, and the remaining 2/3 samples to be the training set and the procedure was repeated 3 times. We still used stepwise method to add the peaks in the rank of P value one by one to be the input of 3-cross-validation SVM. The top 7 peaks with the highest accuracy (86.7%) were selected as final potential biomarkers to separate the two groups. Table 3 shows the descriptive data of the 7 peaks. Between the two groups, the P values of t-test (< 10-4) and the area under the ROC curve (> 7.0) showed the statistical significance of the 7 peaks. In the 7 peaks only the peak of 17 247 Da appeared to lowly express in CRC and highly express in CRA as shown in Figure 3C, others were highly expressed in CRC.
Table 3.
Descriptive statistics for the 7 potential biomarkers in the pattern discriminating CRC patients from CRA patients (mean ± SD)
| M/Z (Da) | P value (× 10-5) | CRA patients | CRC patients |
| 17 247 | 0.71 | 0.211 ± 0.130 | 0.113 ± 0.100 |
| 18 420 | 1.27 | 0.039 ± 0.036 | 0.076 ± 0.040 |
| 5 911 | 1.71 | 1.459 ± 0.977 | 2.763 ± 1.720 |
| 9 294 | 2.76 | 0.617 ± 0.385 | 1.105 ± 0.563 |
| 4 654 | 6.74 | 0.503 ± 0.493 | 1.164 ± 0.943 |
| 21 694 | 7.48 | 0.489 ± 0.145 | 0.698 ± 0.267 |
| 21 742 | 12.10 | 0.536 ± 0.161 | 0.744 ± 0.282 |
We used 3-fold cross-validation SVM to combine the 7 peaks, and trained it with 60 samples. For the 3-fold cross-validation SVM, the estimated specificity in the blind test set (30 samples) was 83% with a 95% confidence interval of 79%-87%, the estimated sensitivity was 89% (86%-92%), the estimated positive predictive value was 89% (86%-92%). Table 4 shows our results for this classifier.
Table 4.
Predicted results of classifier for discriminating CRC patients from CRA
|
Test set (30 × 3) |
Training set (60 × 3) |
|||
| CRA | CRC | CRA | CRC | |
| CRA (35 × 3) | 29 | 6 | 56 | 14 |
| CRC (55 × 3) | 6 | 49 | 16 | 94 |
| Specificity (%) | 83 (29/(29 + 6)) | 80 (56/(56 + 14)) | ||
| Sensitivity (%) | 89 (49/(49 + 6)) | 85 (94/(94 + 16)) | ||
| Positive value (%) | 89 (49/(49 + 6)) | 87 (94/(94 + 14)) | ||
DISCUSSION
CRC screening includes fecal occult blood test (FOBT), sigmoidoscopy, air-contrast barium enema examination, colonoscopy[30]. But they have not been commonly accepted due to costs, bowel preparation, sedation and perforation risks. Detection of serum tumor markers (such as CEA) is an inexpensive and facile screening method compared to others. However, all the existing biomarkers in serum lack sufficient sensitivity for screening and diagnosis of CRC[31-35]. In this study, we detected CEA values (cut-off value of CEA level of 5 ng/mL) of 182 serum samples (including 55 from CRC patients, 35 from CRA and 92 from HP which were also detected by SELDI), and a sensitivity of 47% was achieved in screening for CRC. The results also showed that CEA lacked sufficient sensitivity for screening and diagnosis of CRC.
Because of the multi-factorial nature of CRC, it is very clear that a combination of several markers would be necessary to effectively detect and diagnose CRC. SELDI-MS and the ProteinChip technology could provide the high-throughput proteomic profiling[36]. Coupled with sophisticated bioinformatics tools for complex data analysis they could find the “fingerprints” of CRC and build the diagnosis model.
One hundred and forty-seven CRC patients and HP were detected by SELDI-TOF-MS and the complex data were analyzed by integrated ANN, we found 4 potential biomarkers and achieved a specificity of 92% (89%-95%), sensitivity of 89% (85%-93%), positive predictive value of 86% (82%-90%). Ninety CRC and CRA patients were detected by SELDI-MS and analyzed by an SVM classifier. We found 7 potential biomarkers and achieved a specificity of 83% (79%-87%), sensitivity of 89% (86%-92%), positive predictive value of 89% (86%-92%).
Early detection remains one of the most urgent issues in CRC research[37]. Our two patterns could recognize early Dukes samples as efficiently as other Dukes samples. The biomarkers used in the final selection were not sensitive to different Dukes, stages of cancer patients. In almost all the patients with CRC, preceding lesions were asymptomatic adenomas[38]. So it is very important to discriminate the noncancer CRA patients from early CRC. We also achieved a high sensitivity and specificity model to recognize CRC and CRA patients.
We developed an integrated approach using bioinformatics and biostatics tools to analyze the large data of spectra. The ROC curve, t-test and MSE values were used to rank and select the peaks according to their contribution to the separation of two groups. To accurately estimate the sensitivity and specificity of the classifiers established by potential biomarkers, the test sets were randomly selected many times, independent of training sets each time.
The peak of 4 645 Da was identified as doubly charged forms of 9 294 Da by Ciphergen ProteinChip Software 3.1. The recognition of both the doubly charged and the singly charged forms of these peaks suggested their importance in discriminating the two diagnostic groups. The peak of 5 911 Da was selected as a potential biomarker in both the pattern discriminating CRC patients from HP and the pattern discriminating CRC from CRA patients. The expression of this biomarker increased step by step in HP, CRA and CRC patients as shown in Figure 3A. Therefore the peak of 5 911 Da may play an important role in the formation and progression of CRC.
In conclusion, SELDI-TOF-MS in combination with sophisticated bioinformatics tools could facilitate the discovery of new biomarkers and establish patterns with a high sensitivity and specificity for the detection of CRC.
Footnotes
Supported by the Major State Basic Research Development Program of China 973 program, No. G1998051200
Edited by Wang XL and Zhu LH Proofread by Xu FM
References
- 1.Zhang YL, Zhang ZS, Wu BP, Zhou DY. Early diagnosis for colorectal cancer in China. World J Gastroenterol. 2002;8:21–25. doi: 10.3748/wjg.v8.i1.21. [DOI] [PMC free article] [PubMed] [Google Scholar]
- 2.Thiis-Evensen E, Hoff GS, Sauar J, Majak BM, Vatn MH. Flexible sigmoidoscopy or colonoscopy as a screening modality for colorectal adenomas in older age groups Findings in a cohort of the normal population aged 63-72 years. Gut. 1999;45:834–839. doi: 10.1136/gut.45.6.834. [DOI] [PMC free article] [PubMed] [Google Scholar]
- 3.Li S, Nie Z, Li N, Li J, Zhang P, Yang Z, Mu S, Du Y, Hu J, Yuan S, et al. Colorectal cancer screening for the natural population of Beijing with sequential fecal occult blood test: a multicenter study. Chin Med J (Engl) 2003;116:200–202. [PubMed] [Google Scholar]
- 4.Repetto L, Venturino A, Fratino L, Serraino D, Troisi G, Gianni W, Pietropaolo M. Geriatric oncology: a clinical approach to the older patient with cancer. Eur J Cancer. 2003;39:870–880. doi: 10.1016/s0959-8049(03)00062-5. [DOI] [PubMed] [Google Scholar]
- 5.Gatta G, Faivre J, Capocaccia R, Ponz de Leon M. Survival of colorectal cancer patients in Europe during the period 1978-1989. Eur J Cancer. 1998;34:2176–2183. doi: 10.1016/s0959-8049(98)00327-x. [DOI] [PubMed] [Google Scholar]
- 6.Ries LA, Wingo PA, Miller DS, Howe HL, Weir HK, Rosenberg HM, Vernon SW, Cronin K, Edwards BK. The annual report to the nation on the status of cancer, 1973-1997, with a special section on colorectal cancer. Cancer. 2000;88:2398–2424. doi: 10.1002/(sici)1097-0142(20000515)88:10<2398::aid-cncr26>3.0.co;2-i. [DOI] [PubMed] [Google Scholar]
- 7.Jemal A, Murray T, Samuels A, Ghafoor A, Ward E, Thun MJ. Cancer statistics, 2003. CA Cancer J Clin. 2003;53:5–26. doi: 10.3322/canjclin.53.1.5. [DOI] [PubMed] [Google Scholar]
- 8.Dashwood RH. Early detection and prevention of colorectal cancer (review) Oncol Rep. 1999;6:277–281. [PubMed] [Google Scholar]
- 9.Mishaeli M, Klein B, Sadikov E, Bayer I, Koren R, Gal R, Rakowsky E, Levin I, Kfir B, Schachter J, et al. Initial TPS serum level as an indicator of relapse and survival in colorectal cancer. Anticancer Res. 1998;18:2101–2105. [PubMed] [Google Scholar]
- 10.Vlahou A, Schellhammer PF, Mendrinos S, Patel K, Kondylis FI, Gong L, Nasim S, Wright Jr GL. Development of a novel proteomic approach for the detection of transitional cell carcinoma of the bladder in urine. Am J Pathol. 2001;158:1491–1502. doi: 10.1016/S0002-9440(10)64100-4. [DOI] [PMC free article] [PubMed] [Google Scholar]
- 11.Adam BL, Qu Y, Davis JW, Ward MD, Clements MA, Cazares LH, Semmes OJ, Schellhammer PF, Yasui Y, Feng Z, et al. Serum protein fingerprinting coupled with a pattern-matching algorithm distinguishes prostate cancer from benign prostate hyperplasia and healthy men. Cancer Res. 2002;62:3609–3614. [PubMed] [Google Scholar]
- 12.Qu Y, Adam BL, Yasui Y, Ward MD, Cazares LH, Schellhammer PF, Feng Z, Semmes OJ, Wright GL. Boosted decision tree analysis of surface-enhanced laser desorption/ionization mass spectral serum profiles discriminates prostate cancer from noncancer patients. Clin Chem. 2002;48:1835–1843. [PubMed] [Google Scholar]
- 13.Wagner M, Naik DN, Pothen A, Kasukurti S, Devineni RR, Adam BL, Semmes OJ, Wright GL. Computational protein biomarker prediction: a case study for prostate cancer. BMC Bioinformatics. 2004;5:26. doi: 10.1186/1471-2105-5-26. [DOI] [PMC free article] [PubMed] [Google Scholar]
- 14.Jr GW, Cazares LH, Leung SM, Nasim S, Adam BL, Yip TT, Schellhammer PF, Gong L, Vlahou A. Proteinchip(R) surface enhanced laser desorption/ionization (SELDI) mass spectrometry: a novel protein biochip technology for detection of prostate cancer biomarkers in complex protein mixtures. Prostate Cancer Prostatic Dis. 1999;2:264–276. doi: 10.1038/sj.pcan.4500384. [DOI] [PubMed] [Google Scholar]
- 15.Petricoin EF, Ardekani AM, Hitt BA, Levine PJ, Fusaro VA, Steinberg SM, Mills GB, Simone C, Fishman DA, Kohn EC, et al. Use of proteomic patterns in serum to identify ovarian cancer. Lancet. 2002;359:572–577. doi: 10.1016/S0140-6736(02)07746-2. [DOI] [PubMed] [Google Scholar]
- 16.Vlahou A, Schorge JO, Gregory BW, Coleman RL. Diagnosis of Ovarian Cancer Using Decision Tree Classification of Mass Spectral Data. J Biomed Biotechnol. 2003;2003:308–314. doi: 10.1155/S1110724303210032. [DOI] [PMC free article] [PubMed] [Google Scholar]
- 17.Li J, Zhang Z, Rosenzweig J, Wang YY, Chan DW. Proteomics and bioinformatics approaches for identification of serum biomarkers to detect breast cancer. Clin Chem. 2002;48:1296–1304. [PubMed] [Google Scholar]
- 18.Vlahou A, Laronga C, Wilson L, Gregory B, Fournier K, McGaughey D, Perry RR, Wright GL, Semmes OJ. A novel approach toward development of a rapid blood test for breast cancer. Clin Breast Cancer. 2003;4:203–209. doi: 10.3816/cbc.2003.n.026. [DOI] [PubMed] [Google Scholar]
- 19.Poon TC, Yip TT, Chan AT, Yip C, Yip V, Mok TS, Lee CC, Leung TW, Ho SK, Johnson PJ. Comprehensive proteomic profiling identifies serum proteomic signatures for detection of hepatocellular carcinoma and its subtypes. Clin Chem. 2003;49:752–760. doi: 10.1373/49.5.752. [DOI] [PubMed] [Google Scholar]
- 20.Wadsworth JT, Somers KD, Stack BC, Cazares L, Malik G, Adam BL, Wright GL, Semmes OJ. Identification of patients with head and neck cancer using serum protein profiles. Arch Otolaryngol Head Neck Surg. 2004;130:98–104. doi: 10.1001/archotol.130.1.98. [DOI] [PubMed] [Google Scholar]
- 21.Xiao X, Liu D, Tang Y, Guo F, Xia L, Liu J, He D. Development of proteomic patterns for detecting lung cancer. Dis Markers. 2003;19:33–39. doi: 10.1155/2003/278152. [DOI] [PMC free article] [PubMed] [Google Scholar]
- 22.Zhukov TA, Johanson RA, Cantor AB, Clark RA, Tockman MS. Discovery of distinct protein profiles specific for lung tumors and pre-malignant lung lesions by SELDI mass spectrometry. Lung Cancer. 2003;40:267–279. doi: 10.1016/s0169-5002(03)00082-5. [DOI] [PubMed] [Google Scholar]
- 23.Koopmann J, Zhang Z, White N, Rosenzweig J, Fedarko N, Jagannath S, Canto MI, Yeo CJ, Chan DW, Goggins M. Serum diagnosis of pancreatic adenocarcinoma using surface-en-hanced laser desorption and ionization mass spectrometry. Clin Cancer Res. 2004;10:860–868. doi: 10.1158/1078-0432.ccr-1167-3. [DOI] [PubMed] [Google Scholar]
- 24.Bottaci L, Drew PJ, Hartley JE, Hadfield MB, Farouk R, Lee PW, Macintyre IM, Duthie GS, Monson JR. Artificial neural networks applied to outcome prediction for colorectal cancer patients in separate institutions. Lancet. 1997;350:469–472. doi: 10.1016/S0140-6736(96)11196-X. [DOI] [PubMed] [Google Scholar]
- 25.Romualdi C, Campanaro S, Campagna D, Celegato B, Cannata N, Toppo S, Valle G, Lanfranchi G. Pattern recognition in gene expression profiling using DNA array: a comparative study of different statistical methods applied to cancer classification. Hum Mol Genet. 2003;12:823–836. doi: 10.1093/hmg/ddg093. [DOI] [PubMed] [Google Scholar]
- 26.Ball G, Mian S, Holding F, Allibone RO, Lowe J, Ali S, Li G, McCardle S, Ellis IO, Creaser C, et al. An integrated approach utilizing artificial neural networks and SELDI mass spectrometry for the classification of human tumours and rapid identification of potential biomarkers. Bioinformatics. 2002;18:395–404. doi: 10.1093/bioinformatics/18.3.395. [DOI] [PubMed] [Google Scholar]
- 27.Khan J, Wei JS, Ringnér M, Saal LH, Ladanyi M, Westermann F, Berthold F, Schwab M, Antonescu CR, Peterson C, et al. Classification and diagnostic prediction of cancers using gene expression profiling and artificial neural networks. Nat Med. 2001;7:673–679. doi: 10.1038/89044. [DOI] [PMC free article] [PubMed] [Google Scholar]
- 28.Peng S, Xu Q, Ling XB, Peng X, Du W, Chen L. Molecular classification of cancer types from microarray data using the combination of genetic algorithms and support vector machines. FEBS Lett. 2003;555:358–362. doi: 10.1016/s0014-5793(03)01275-4. [DOI] [PubMed] [Google Scholar]
- 29.Koike A, Takagi T. Prediction of protein-protein interaction sites using support vector machines. Protein Eng Des Sel. 2004;17:165–173. doi: 10.1093/protein/gzh020. [DOI] [PubMed] [Google Scholar]
- 30.Church TR, Yeazel MW, Jones RM, Kochevar LK, Watt GD, Mongin SJ, Cordes JE, Engelhard D. A randomized trial of direct mailing of fecal occult blood tests to increase colorectal cancer screening. J Natl Cancer Inst. 2004;96:770–780. doi: 10.1093/jnci/djh134. [DOI] [PubMed] [Google Scholar]
- 31.Kornek GV, Depisch D, Rosen HR, Temsch EM, Scheithauer W. Comparative analysis of CA72-4, CA195 and carcinoembryonic antigen in patients with gastrointestinal malignancies. J Cancer Res Clin Oncol. 1992;118:318–320. doi: 10.1007/BF01208623. [DOI] [PMC free article] [PubMed] [Google Scholar]
- 32.Posner MR, Mayer RJ. The use of serologic tumor markers in gastrointestinal malignancies. Hematol Oncol Clin North Am. 1994;8:533–553. [PubMed] [Google Scholar]
- 33.Ohuchi N, Takahashi K, Matoba N, Sato T, Taira Y, Sakai N, Masuda M, Mori S. Comparison of serum assays for TAG-72, CA19-9 and CEA in gastrointestinal carcinoma patients. Jpn J Clin Oncol. 1989;19:242–248. [PubMed] [Google Scholar]
- 34.Ueda T, Shimada E, Urakawa T. The clinicopathologic features of serum CA 19-9-positive colorectal cancers. Surg Today. 1994;24:518–525. doi: 10.1007/BF01884571. [DOI] [PubMed] [Google Scholar]
- 35.Nakagoe T, Sawai T, Tsuji T, Jibiki MA, Nanashima A, Yamaguchi H, Yasutake T, Ayabe H, Arisawa K. Preoperative serum level of CA19-9 predicts recurrence after curative surgery in node-negative colorectal cancer patients. Hepatogastroenterology. 2003;1; 50:696–699. [PubMed] [Google Scholar]
- 36.Srinivas PR, Srivastava S, Hanash S, Wright GL. Proteomics in early detection of cancer. Clin Chem. 2001;47:1901–1911. [PubMed] [Google Scholar]
- 37.Hurlstone DP, Fujii T, Lobo AJ. Early detection of colorectal cancer using high-magnification chromoscopic colonoscopy. Br J Surg. 2002;89:272–282. doi: 10.1046/j.0007-1323.2001.02040.x. [DOI] [PubMed] [Google Scholar]
- 38.Vogelstein B, Fearon ER, Hamilton SR, Kern SE, Preisinger AC, Leppert M, Nakamura Y, White R, Smits AM, Bos JL. Genetic alterations during colorectal-tumor development. N Engl J Med. 1988;319:525–532. doi: 10.1056/NEJM198809013190901. [DOI] [PubMed] [Google Scholar]