

Abstract
AIM: To study the influence of chemotherapy on proliferation activation of tumor cell by observing the change of chemiluminescence (CL) and cell cycle in various tumor cell lines after mitomycin C treated.
METHODS: BGC823 and LoVo cell lines were all cultured in RPMI-1640, and then were adjusted to a concentration of 1 × 10⁵ cells/mL in fresh media and incubated for 24 h. Mitomycin C (100 ng·L-1) was added to each bottle. All indeses were examined after 24 h. No Mitomycin C was added in control group. Each group contained 8 samples. Flow cytometric analysis and luminol-dependent CL were used to investigate the effect of mitomycin C on two gastrointestinal carcinoma cell lines.
RESULTS: BGC823 and LoVo cell lines incubated with MMC for 24 h. We discovered that the emergence of peak of CL stimulated by PHA was postponed significantly (BGC823: 12.63 ± 3.21 vs 4.50 ± 1.04, LoVo: 13.25 ± 2.96 vs 5.12 ± 1.36, P < 0.01) and the peak intension of CL was reduced significantly (BGC823: 120.25 ± 16.61 vs 248.38 ± 29.17, LoVo: 98.13 ± 10.49 vs 267.50 ± 18.56, P < 0.01). The PI of cell lines was decreased significantly (BGC823: 51.87 ± 4.82 vs 25.44 ± 2.26, LoVo: 47.11 ± 1.04 vs 24.23 ± 0.37, P < 0.01) and the apoptotic fractions changed by contraries (BGC823: 26.25 ± 5.29 vs 9.83 ± 2.51, LoVo: 33.50 ± 3.68 vs 9.63 ± 1.44, P < 0.01).
CONCLUSION: CL can be used to measure activation of tumor cells. We discovered that the ground CL intensions of two cell lines were not high but increased rapidly after stimulation of PHA. The CL peak ranged from 4-5 min, and then decreased gradually. The results were not reported before. CL of tumor cell has close correlativity with the dynamics of cell cycle and can reflect the feature of oxidation metabolism and proliferation activation of tumor cell. So it can be used to observe the influence of chemotherapy drug on metabolism and proliferation activation of tumor cell and screen out chemotherapy drugs to which tumor cells are sensitive.
INTRODUCTION
Chemiluminescence (CL) is a natural phenomenon of creatures[1]. As other cells, tumor cells also have the ability of CL. So the vigor of tumor cells could be measured by CL. At present, there were few reports about the CL of tumor cells[2]. We used gastric and colonic carcinoma cell lines to study the CL of tumor cells and to investigate the dynamics of CL and the influence of drugs on CL.
MATERIALS AND METHODS
Cell line
BGC823 is a kind of human gastric carcinoma cell line[3-5]; LoVo is a kind of human colonic carcinoma cell line[6,7]. We bought them from Shanghai Cell Biology Institute of the Chinese Academy of Sciences.
Cell culture and mitomycin C treatment
Two cell lines were all cultured in RPMI-1640 (GIBCO) containing 100 g·L-1 newborn calf serum (Sijiqing, Hangzhou), penicillin (100 U·L-1), and streptomycin (100 μg·L-1). Log phase cells were adjusted to a concentration of 1 × 10⁵ cells/mL in fresh media and incubated for 24 h. Mitomycin C (100 ng·L-1)[8] was added to each bottle. All indeses were examined after 24 h. No Mitomycin C was added in control group. Each group contained 8 samples.
CL analysis
Media was removed and cells were washed in phenol red free D-Hank's solution three times and adjusted to a concentration of 1 × 10³ cells·mL-1 in the same solution. Aliquots (0.1 ml) of this cell suspension were placed into a cuvette, to which 0.7 mL of phenol red free D-Hank's solution and 0.1 mL of luminol (1 mmol·L-1) were added. All cuvettes were put into sample chamber of SHG-1 bio-luminometer (Shangli measure instrument factory). CL of tumor cell was measured using T-2 procedure, configuring measure times were 30 and interval was 60 s. At first background of CL was measured, then 0.1 mL of phaseolus vulgaris agglutinin (PHA, 4 mg·L-1) was added and shaken up rapidly. CL PHA stimulated was measured continuously for about 30 min. All assays were made at 37 °C. After measurements completed, CL kinetics curve, peak value, peak time, slope function and integral were calculated using the computer. Unit of intension of CL was scintillation counting per minute[9] (Figure 1).
Figure 1.
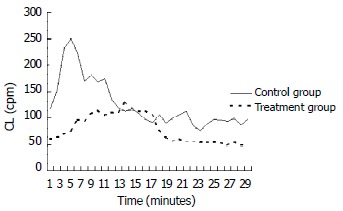
Time-course of CL change in control and treatment groups of BGC823.
Flow cytometric analysis
Cells were harvested and washed in D-Hank's solution three times and adjusted to a concentration of 1 × 10⁶ cells·L-1 in the same solution. The nuclei were stained with propidium iodide at a concentration of 50 μg·L-1 and then filtered through 40 μm nylon mesh before flow cytometric analysis[10]. The nuclear DNA content was analyzed with a flow cytometer (Epics XL; Coulter Co. U.S.A); 1 × 10⁶ cells were examined in each sample. The cell cycle distribution, i.e., G0/G1, S, G2/M were analyzed using a computer program (Multicycle). The mean coefficient of variation (CV) for the G0/G1 peak was less than 8.0 in all cases[11]. We assessed the proliferation index (PI) to evaluate the changes of cell cycle distribution caused by treatment of MMC.
PI = (S+G2M)/ (S+G2M+G0G1) × 100%
We used the fraction of subdiploid peak in front of DNA histograms as apoptotic fraction[12].
Statistical analysis
Statistical analysis, i.e., one-way ANOVA, unpaired t-test, correlate analysis, was performed using SPSS 8.0. Data were presented as means ± standard deviation (S.D.). The level of significance was P < 0.05.
RESULTS
CL analysis
Figure 1 and Table 1 show the time-course of CL change in control and treatment groups of BGC823. In control group a CL signal was noted almost immediately that peaked within 3-5 min and returned to baseline after about 10-15 min. In contrast treatment group cells responded slowly and the peak CL did not occur until after 11-18 min. The CL peak value in treatment group decreased significantly (P < 0.01) when compared with control group. The same changes were detected in all two cell lines.
Table 1.
Effects of MMC treatment on CL of two cell lines
|
BGC823 (n = 8) |
LoVo (n = 8) |
|||
| Control | Treatment | Control | Treatment | |
| Peak value (cpm) | 248.38 ± 29.17 | 120.25 ± 16.61a | 267.50 ± 18.56 | 98.13 ± 10.49a |
| Peak time (minute) | 4.50 ± 1.04 | 12.63 ± 3.21a | 5.12 ± 1.36 | 13.25 ± 2.96a |
P < 0.01, versus control.
Flow cytometric analysis
The PI in treatment group decreased significantly and the apoptotic fraction increased significantly when compared with control group (P < 0.01). There was no significant difference in the change of cell cycle contribution between two cell lines (Table 2).
Table 2.
Effects of MMC treatment on cell cycle distribution of two cell lines
|
BGC823 |
LoVo |
|||
| Control | Treatment | Control | Treatment | |
| PI (%) | 51.87 ± 4.82 | 25.44 ± 2.26a | 47.11 ± 1.04 | 24.23 ± 0.37a |
| Apoptosis (%) | 9.83 ± 2.51 | 26.25 ± 5.29 | 9.63 ± 1.44 | 33.50 ± 3.68 |
P < 0.01, versus control.
Correlations between CL and cell cycle distribution
There was positive correlation between CL and PI (BGC823: r = 0.92, P < 0.01; LoVo: r = 0.90, P < 0.01), and there was negative correlation between CL and apoptotic fraction (BGC823: r = -0.91, P < 0.01; LoVo: r = -0.95, P < 0.01) (Figure 2 Figure 3, Figure 4, Figure 5).
Figure 2.

Correlations between CL and PI in BGC823.
Figure 3.

Correlations between CL and apoptotic fraction in BGC823.
Figure 4.

Correlations between CL and PI in LoVo.
Figure 5.

Correlations between CL and apoptotic fraction in LoVo.
DISCUSSION
Oxygen radicals (OR) are intermediary products in the biochemical metabolization of cells, including O2.- H2O2, OH·, 1O2, OCl- and lipid peroxidation oxygen radical[13]. They are produced mainly by aerobic respiration in mitochondrion and glycolysis[14,15]. OR reacts to excitable substance in cells and produces CL[16]. So we can observe activation of cells by the measurement of CL[17,18].
In the present study, luminol-dependent chemiluminescence was used as a measure of CL of human gastric carcinoma cell line BGC823 and human colonic carcinoma cell line LoVo. We discovered that the ground CL intensions of two cell lines were not high but increased rapidly after stimulation of PHA. The CL peak ranged from 4-5 min, then decreased gradually. The results were not reported before.
Mitomycin C is a cycle-nonspecific anti-tumor agent. The mechanism of anti-cancer effect is its alkylation which makes DNA incorporation and DNA replication inhibition and single strand rupture. MMC affects mainly G1 and early S phases. However the influence of MMC on cell cycle in vitro may be different in different cells[19-22]. MMC also up-regulated EpCAM and LewisY antigen expression in LoVo cell line[23]. Cell cultures were growth arrested by exposure for 5 min to MMC[24], and MMC retains its antiproliferative effect for at least 6 wk[25].
The CL of BGC823 and LoVo cell lines were decreased significantly after incubated with MMC for 24 h. We also discovered that the peak of CL was postponed significantly and the peak intension of CL was reduced significantly after the stimulation of PHA. At the same time, the proliferation index (PI) was decreased significantly and apoptotic fractions changed by contraries[26]. There was positive correlation between CL and PI, and there was negative correlation between CL and apoptotic fraction. These results revealed that the proliferation activation of tumor cell reduced, the apoptosis of cells increased and the reaction to stimulation of PHA weakened when the concentration of oxygen radicals in tumor cell decreased[27-29]. So the decrease of concentration of oxygen radicals in low range depressed the mitochysis of tumor cell[30] and prompted the apoptosis of tumor cell. These results also suggest the CL of cell can reflect change of proliferation activation of tumor cell treated by chemotherapy drugs.
In conclusion, the CL of tumor cell can reflect the feature of oxidation metabolism and proliferation activation of tumor cell, can be used to observe the influence of chemotherapy drug on metabolism and proliferation activation of tumor cell and screen out chemotherapy drugs to which tumor cells are sensitive. Compared with other methods cell chemiluminescence is more sensitive, more accurate, more rapid, less pollution and need fewer samples.
Footnotes
Supported by the Natural Scientific Foundation of Jiangsu Province, No. BJ2000040
Edited By Yuan HT
References
- 1.Li QG. The physical chemistry principle of bioluminescence and chemiluminescence. In: Hu TX, editors Luminescence analysis and medicine, editors. Shanghai: East China Normal University Press; 1990. pp. 1–2. [Google Scholar]
- 2.Meyskens FL, Chau HV, Tohidian N, Buckmeier J. Luminol-enhanced chemiluminescent response of human melanocytes and melanoma cells to hydrogen peroxide stress. Pigment Cell Res. 1997;10:184–189. doi: 10.1111/j.1600-0749.1997.tb00482.x. [DOI] [PubMed] [Google Scholar]
- 3.Li QF, Ou Yang GL, Li CY, Hong SG. Effects of tachyplesin on the morphology and ultrastructure of human gastric carcinoma cell line BGC-823. World J Gastroenterol. 2000;6:676–680. doi: 10.3748/wjg.v6.i5.676. [DOI] [PMC free article] [PubMed] [Google Scholar]
- 4.Liu S, Wu Q, Chen ZM, Su WJ. The effect pathway of retinoic acid through regulation of retinoic acid receptor alpha in gastric cancer cells. World J Gastroenterol. 2001;7:662–666. doi: 10.3748/wjg.v7.i5.662. [DOI] [PMC free article] [PubMed] [Google Scholar]
- 5.Fan YF, Huang ZH. Angiogenesis inhibitor TNP-470 suppresses growth of peritoneal disseminating foci of human colon cancer line Lovo. World J Gastroenterol. 2002;8:853–856. doi: 10.3748/wjg.v8.i5.853. [DOI] [PMC free article] [PubMed] [Google Scholar]
- 6.Li QF, Ou Yang GL, Li CY, Hong SG. Effects of tachyplesin on the morphology and ultrastructure of human gastric carcinoma cell line BGC-823. World J Gastroenterol. 2000;6:676–680. doi: 10.3748/wjg.v6.i5.676. [DOI] [PMC free article] [PubMed] [Google Scholar]
- 7.Chen XX, Lai MD, Zhang YL, Huang Q. Less cytotoxicity to combination therapy of 5-fluorouracil and cisplatin than 5-fluorouracil alone in human colon cancer cell lines. World J Gastroenterol. 2002;8:841–846. doi: 10.3748/wjg.v8.i5.841. [DOI] [PMC free article] [PubMed] [Google Scholar]
- 8.Spraul CW, Kaven C, Amann J, Lang GK, Lang GE. Effect of insulin-like growth factors 1 and 2, and glucose on the migration and proliferation of bovine retinal pigment epithelial cellsin vitro. Ophthalmic Res. 2000;32:244–248. doi: 10.1159/000055621. [DOI] [PubMed] [Google Scholar]
- 9.Zheng RL. Free radicals involvement in carcinogenesis. In: Zheng RL, editors Advances in free radical life sciences, editors. Vol. 6. Beijing: Atomic Energy Press; 1998. pp. 72–77. [Google Scholar]
- 10.Chen JP, Lin C, Xu CP, Zhang XY, Wu M. The therapeutic effects of recombinant adenovirus RA538 on human gastric carcinoma cells in vitro and in vivo. World J Gastroenterol. 2000;6:855–860. doi: 10.3748/wjg.v6.i6.855. [DOI] [PMC free article] [PubMed] [Google Scholar]
- 11.Han Y, Han ZY, Zhou XM, Shi R, Zheng Y, Shi YQ, Miao JY, Pan BR, Fan DM. Expression and function of classical protein kinase C isoenzymes in gastric cancer cell line and its drug-resistant sublines. World J Gastroenterol. 2002;8:441–445. doi: 10.3748/wjg.v8.i3.441. [DOI] [PMC free article] [PubMed] [Google Scholar]
- 12.Loo DT, Rillema JR. Measurement of cell death. Methods Cell Biol. 1998;57:251–264. doi: 10.1016/s0091-679x(08)61583-6. [DOI] [PubMed] [Google Scholar]
- 13.Li JM, Cai Q, Zhou H, Xiao GX. Effects of hydrogen peroxide on mitochondrial gene expression of intestinal epithelial cells. World J Gastroenterol. 2002;8:1117–1122. doi: 10.3748/wjg.v8.i6.1117. [DOI] [PMC free article] [PubMed] [Google Scholar]
- 14.Wu YL, Sun B, Zhang XJ, Wang SN, He HY, Qiao MM, Zhong J, Xu JY. Growth inhibition and apoptosis induction of Sulindac on Human gastric cancer cells. World J Gastroenterol. 2001;7:796–800. doi: 10.3748/wjg.v7.i6.796. [DOI] [PMC free article] [PubMed] [Google Scholar]
- 15.Li HL, Chen DD, Li XH, Zhang HW, Lu YQ, Ye CL, Ren XD. Changes of NF-κB, p53, Bcl-2 and caspase in apoptosis induced by JTE-522 in human gastric adenocarcinoma cell line AGS cells: role of reactive oxygen species. World J Gastroenterol. 2002;8:431–435. doi: 10.3748/wjg.v8.i3.431. [DOI] [PMC free article] [PubMed] [Google Scholar]
- 16.Vidon DJ, Donze S, Muller C, Entzmann A, Andre P. A simple chemiluminescence-based method for rapid enumeration of Listeria spp. microcolonies. J Appl Microbiol. 2001;90:988–993. doi: 10.1046/j.1365-2672.2001.01332.x. [DOI] [PubMed] [Google Scholar]
- 17.Mytar B, Siedlar M, Wołoszyn M, Ruggiero I, Pryjma J, Zembala M. Induction of reactive oxygen intermediates in human monocytes by tumour cells and their role in spontaneous monocyte cytotoxicity. Br J Cancer. 1999;79:737–743. doi: 10.1038/sj.bjc.6690118. [DOI] [PMC free article] [PubMed] [Google Scholar]
- 18.Shepard SL, Noble AL, Filbey D, Hadley AG. Inhibition of the monocyte chemiluminescent response to anti-D-sensitized red cells by Fc gamma RI-blocking antibodies which ameliorate the severity of haemolytic disease of the newborn. Vox Sang. 1996;70:157–163. doi: 10.1111/j.1423-0410.1996.tb01315.x. [DOI] [PubMed] [Google Scholar]
- 19.Takahashi N, Murayama T, Oda M, Miyakoshi M. Cell growth inhibition and DNA incorporation of mitomycin C in cell culture. Ophthalmic Res. 1998;30:120–125. doi: 10.1159/000055464. [DOI] [PubMed] [Google Scholar]
- 20.Machl AW, Planitzer S, Kubbies M. A novel, membrane receptor-based retroviral vector for Fanconi anemia group C gene therapy. Gene Ther. 1997;4:339–345. doi: 10.1038/sj.gt.3300384. [DOI] [PubMed] [Google Scholar]
- 21.Sehlmeyer U, Meister A, Beisker W, Wobus AM. Low mutagenic effects of mitomycin C in undifferentiated embryonic P19 cells are correlated with efficient cell cycle control. Mutat Res. 1996;354:103–112. doi: 10.1016/0027-5107(96)00047-4. [DOI] [PubMed] [Google Scholar]
- 22.Clarke AA, Philpott NJ, Gordon-Smith EC, Rutherford TR. The sensitivity of Fanconi anaemia group C cells to apoptosis induced by mitomycin C is due to oxygen radical generation, not DNA crosslinking. Br J Haematol. 1997;96:240–247. doi: 10.1046/j.1365-2141.1997.d01-2023.x. [DOI] [PubMed] [Google Scholar]
- 23.Flieger D, Hoff AS, Sauerbruch T, Schmidt-Wolf IG. Influence of cytokines, monoclonal antibodies and chemotherapeutic drugs on epithelial cell adhesion molecule (EpCAM) and LewisY antigen expression. Clin Exp Immunol. 2001;123:9–14. doi: 10.1046/j.1365-2249.2001.01435.x. [DOI] [PMC free article] [PubMed] [Google Scholar]
- 24.Daniels JT, Occleston NL, Crowston JG, Khaw PT. Effects of antimetabolite induced cellular growth arrest on fibroblast-fibroblast interactions. Exp Eye Res. 1999;69:117–127. doi: 10.1006/exer.1999.0684. [DOI] [PubMed] [Google Scholar]
- 25.Woo E, Tingey DP, Mackenzie G, Hooper P. Stability of the antiproliferative effect of mitomycin-C after reconstitution. J Glaucoma. 1997;6:33–36. [PubMed] [Google Scholar]
- 26.Tokunaga E, Oda S, Fukushima M, Maehara Y, Sugimachi K. Differential growth inhibition by 5-fluorouracil in human colorectal carcinoma cell lines. Eur J Cancer. 2000;36:1998–2006. doi: 10.1016/s0959-8049(00)00200-8. [DOI] [PubMed] [Google Scholar]
- 27.Winters MD, Schlinke TL, Joyce WA, Glore SR, Huycke MM. Prospective case-cohort study of intestinal colonization with enterococci that produce extracellular superoxide and the risk for colorectal adenomas or cancer. Am J Gastroenterol. 1998;93:2491–2500. doi: 10.1111/j.1572-0241.1998.00710.x. [DOI] [PubMed] [Google Scholar]
- 28.Edmiston KH, Shoji Y, Mizoi T, Ford R, Nachman A, Jessup JM. Role of nitric oxide and superoxide anion in elimination of low metastatic human colorectal carcinomas by unstimulated hepatic sinusoidal endothelial cells. Cancer Res. 1998;58:1524–1531. [PubMed] [Google Scholar]
- 29.Izutani R, Katoh M, Asano S, Ohyanagi H, Hirose K. Enhanced expression of manganese superoxide dismutase mRNA and increased TNFalpha mRNA expression by gastric mucosa in gastric cancer. World J Surg. 1996;20:228–233. doi: 10.1007/s002689900035. [DOI] [PubMed] [Google Scholar]
- 30.Burdon RH. Superoxide and hydrogen peroxide in relation to mammalian cell proliferation. Free Radic Biol Med. 1995;18:775–794. doi: 10.1016/0891-5849(94)00198-s. [DOI] [PubMed] [Google Scholar]