

Abstract
The Canadian Healthy Infant Longitudinal Development birth cohort was designed to elucidate interactions between environment and genetics underlying development of asthma and allergy. Over 3600 pregnant mothers were recruited from the general population in four provinces with diverse environments. The child is followed to age 5 years, with prospective characterization of diverse exposures during this critical period. Key exposure domains include indoor and outdoor air pollutants, inhalation, ingestion and dermal uptake of chemicals, mold, dampness, biological allergens, pets and pests, housing structure, and living behavior, together with infections, nutrition, psychosocial environment, and medications. Assessments of early life exposures are focused on those linked to inflammatory responses driven by the acquired and innate immune systems. Mothers complete extensive environmental questionnaires including time-activity behavior at recruitment and when the child is 3, 6, 12, 24, 30, 36, 48, and 60 months old. House dust collected during a thorough home assessment at 3–4 months, and biological specimens obtained for multiple exposure-related measurements, are archived for analyses. Geo-locations of homes and daycares and land-use regression for estimating traffic-related air pollution complement time-activity-behavior data to provide comprehensive individual exposure profiles. Several analytical frameworks are proposed to address the many interacting exposure variables and potential issues of co-linearity in this complex data set.
Keywords: environmental exposure assessment, longitudinal birth cohort, indoor air quality, etiology of asthma, biomarkers, CHILD study
INTRODUCTION
Longitudinal birth cohort studies are ideal for testing hypotheses related to fetal and early childhood origins of complex and often life-long diseases such as asthma and allergy. Although epidemiological studies indicate a strong genetic component, they also suggest a substantial environmental contribution to asthma and allergy.1, 2 The Canadian Healthy Infant Longitudinal Development (CHILD) study, a national general population-based birth cohort, was established in 2008 to increase our understanding of the interactions between the environment and genetics in the development of asthma and allergy and potentially other common chronic diseases.3
Immune and lung development occur largely in utero and during early childhood.4 The CHILD study was thus designed to be both broad in its assessment of risk, and longitudinal, addressing pre- and post-natal environmental exposures, consistent with recent recommendations.5, 6 The design involves exposure assessment at multiple time points providing insight into the role of critical windows of exposure7 in relation to the trajectory and pattern of immunological, physiological and microbiome development. Additionally, the design included a comprehensive assessment of relevant family history, psychosocial environment, nutritional factors, infections, genetics, and epigenetics. Genome-wide association studies have evolved into gene-environment-wide interactions studies (GEWIS)8, 9, 10 and the detailed environmental assessments, described in this paper for the CHILD study, have been designed to contribute to such analyses. The CHILD study provides a multi-disciplinary platform for comprehensively examining interacting risk factors illustrated in Figure 1, related to the manifestation of different asthma/allergy phenotypes. Methodological, financial, and ethical constraints, along with the need to minimize burden to the families prevent multi time point measurement of every potential exposure.11 However, given the complexity of early life exposures, we have attempted to balance these constraints with the need for sufficient scope and intensity of measurement and data collection.
Figure 1.

Interacting risk factors measured in the CHILD study, including multiple environmental, infective, nutritional and psychosocial exposures; genetics; lung function; and microbiome, resulting in immunological and clinical phenotypic outcomes.
In this paper, we describe the rationale and specific methodologies for assessment of exposures in the physical environment, a core component of the CHILD study. The impact of infections, nutrition, psychosocial environment, and medications, also carefully assessed in CHILD, are discussed elsewhere.3 Multiple physical environment exposure domains are characterized, including indoor and outdoor air pollutants, chemicals, endotoxin, mold, and aeroallergens. Our approach includes repeated questionnaires, time-activity surveys, and traffic exposure models. During infancy, when development is rapid, the majority of time is spent indoors. We focused on this microenvironment by undertaking a detailed home assessment at 3–4 months of age, but also track other primary locations for traffic-related air pollution (TRAP) and other potential exposures. These data are complemented by biological sample collections, including blood, urine, stool, and nasal secretions from the infant, blood from mothers and most fathers, breast milk from nursing mothers, and dust from the home. In this paper we also present initial data describing the range of prenatal living conditions and earliest exposures experienced by the cohort.
METHODS
Overview of CHILD and the Environmental Exposure Assessment Strategy
Between 2008 and 2012, the CHILD study enrolled 3624 pregnant mothers from the general population in four major cities across Canada (Vancouver, Edmonton, Winnipeg and Toronto) and a small rural population (Morden and Winkler) outside Winnipeg.3 Inclusion criteria were age >18 years (>19 years in Vancouver), living in proximity (<50 Km) to a participating delivery hospital, able to read, write and speak English, willing to donate cord blood, planning to deliver at a designated recruitment center participating hospital, and infant born at or after 35 weeks. Exclusion criteria were major congenital abnormalities or respiratory distress syndrome (RDS), expectation of moving away from a recruitment center within 1 year of recruitment, children of multiple births or resulting from in vitro fertilization, and children not spending over 80% of time in the index home.
Recruitment strategies ranged from having staff meet mothers in ante-natal ultrasound clinics and physician offices to community “baby fairs” and included person-to-person referrals and social media advertising. A representative general population was sought, as the development of allergy and asthma in a non-high-risk population may more readily identify environmental risks as well as novel genes. Over 80% of Canadians live in urban centers, and the recruited population should be generally representative of the Canadian population. Representativeness and potential biases (e.g., in socioeconomic status, allergic diathesis) will be determined by comparison with data from the total Canadian population.
Specific exposures of interest and their assessment methods were refined over a 2-year period, using input from an international planning workshop,11 consultation with housing experts representing the Canada Mortgage and Housing Corporation and experience gained from a preliminary study in a small Vancouver population. Finally, these refined methods were piloted with a Vanguard Cohort of 220 mothers and babies recruited at all four CHILD study sites12 before implementation in the main cohort.13 This process led to an approach by which individual exposures were assessed across 15 domains (Table 1) using multiple methods or tools (Table 2), with emphasis on the home environment. Time-activity inside and outside the home is also recorded, focusing on rooms where the baby spent most time, awake and asleep, and time spent in transit and daycare. A representative detailed environmental questionnaire administered in early childhood is available in the Supplementary Information 1.
Table 1. Physical environmental exposure domains characterized for CHILD study subjects.
| Exposure domain | Examples of information collected by questionnaires | Examples of exposure estimates enabled |
|---|---|---|
| General home characteristics and performance | •General home characteristics (e.g., date of construction, renovations, size, proximity to outdoor pollution sources) •Living space and related behaviors (e.g., location of living space within home, number of occupants per m3) | Air pollution and infiltration Moisture hazard from occupancy and leakage |
| Floors, walls, and furniture | •Laminate, soft vinyl or hard vinyl floors Walls painted <6 months before inspection Oriented strand board, PVC, plastic or vinyl wall, or window coverings •Pressed wood, plastic or vinyl furniture, plastic toys, laser or inkjet printers | Semi-volatile and volatile chemicals including phthalates, formaldehyde, ultrafine particles |
| Second-hand smoke | •Smoking reported at the subject's home •Smoke exposure reported on subject's time-activity | Tobacco and nicotine |
| Heating, cooking, and ventilation | •Location and age of furnace, condition of furnace filter •Use of gas appliances; ozone-generating air purifiers •Wood or pellets used for home heating | NO2, CO, ozone, particulate matter |
| Cleaning and chemical products | •Use and storage of cleaning and other household products including: air fresheners, floor and furniture polish, scented candles, incense, scented laundry detergent, fabric softeners and solvents •Pesticides | SVOCs, VOCs, PM |
| Personal and child-care products | •Diaper creams, baby wipes, shampoo and lotion, medications, adult personal-care products •Pacifier, soft plastic toys, teething rings | Semi-volatile and volatile chemicals including phthalates |
| Moisture indicators | •Earthy, moldy, or musty odor detected during inspection •Presence and use of humidifier, sump pump, aquarium •Four or more houseplants in one room •Exhaust fans in kitchen or bathroom not used or not present •Indoor sauna, hot-tub, or swimming pool •Condensation on windows in cold weather •Clothes dryer exhausts into house | Mold, dampness, endotoxin |
| Water leaks | •Evidence of water leaks during home inspection, mold dampness •Water leaks reported on questionnaire | Mold, dampness, endotoxin |
| Mold indicators | •Mold seen or suspected during home inspection | Mold |
| Pets | •Furred pets present in home | Allergens, endotoxin |
| Pests | •Evidence of mice, cockroaches, or other pests reported during home inspection or by questionnaire •Pest control efforts (professional or occupant treatments, type of control agent or practice) | Dampness, allergens |
| Swimming pools and hot-tubs | •Pool or hot-tub at home or building •Use of chlorine and/or bromine | Chloramine/disinfection by-products |
| Garages | •Engine emissions and fumes from parking garage entering home •Attached garage used for vehicles •Attached garage used for storage of chemical products | VOCs, PM, CO, NO2 |
| Take-home occupational exposures | •Household member works with hazardous materials •Behaviors potentially affecting family's exposure: changing work clothes and shoes, showering, laundering work clothes | Take-home chemical exposures |
| Traffic-related air pollution | •Home location •Travel behavior | Air pollution, noise, and moisture |
| Dust | •Area-based dust loading measured on flooring in most-used room and child's bedroom at home visit •Particle reservoirs including installed carpets and/or area rug(s), plush toys, upholstered furnishings •Cleaning practices and appliances | Irritant dust, SVOCs |
Table 2. Principal exposure assessment methods used in the CHILD study to characterize the physical environment during early childhood.
| Method exposure example | Questionnaires | Physical home assessment | Home dust samples | Biological specimens | GIS model |
|---|---|---|---|---|---|
| Common allergens (includes pets and pests) | X | X | X | ||
| Second-hand smoke | X | X | Urinary cotinine | ||
| Endotoxin | X | ||||
| Dampness | X | X | |||
| Mold | X | X | X | ||
| Semi-volatile compounds | X | X | X | Urinary metabolites of phthalates | |
| Traffic-related air pollution | X | X | X | ||
| Work, take-home exposures | X |
Several of the exposures listed in Tables 1 and 2 are linked to inflammatory responses of the acquired and innate immune systems.14, 15 Many irritant and oxidizing exposures associated with asthma trigger the innate response including effects of second-hand tobacco smoke, cleaning chemicals, TRAP (e.g., nitrogen dioxide (NO2)), mold and moisture, and chemicals that may be emitted inside the home.16, 17, 18, 19, 20, 21 Also included in the CHILD study are exposures to the classically associated biologic allergens.22
CHILD Protocol for Obtaining Exposure Information
The first detailed environmental questionnaire is administered at recruitment during the second half of pregnancy following informed consent for participation in the study. Cord blood and meconium are collected at birth along with details of the delivery. The detailed environmental questionnaire is administered again and the primary home is visited by research assistants (RAs) when the child is 3–4 months of age. Samples of house dust, the child's urine, stool, nasal secretions, and the mother's breast milk are obtained at this time. The detailed questionnaire, modified for the appropriate age of the child, is again completed at ages 1, 3, and 5 years. Updated environmental information focusing on address changes, renovations, and time/activity is obtained through less detailed questionnaires administered at 6 months, 18 months, 2 years, 2.5 years, and 4 years of age. Urine samples are collected during clinic visits at ages 1, 3, and 5 years and blood is collected at ages 1 and 5 years. These stepwise encounters for the exposure assessment are detailed in Supplementary Information 2 and additional detail can be found on the CHILD website (www.canadianchildstudy.ca). Standard operating protocols are available upon request through the CHILD website.
A unique aspect of the CHILD study is the home visit at 3–4 months (hereafter referred to as 3 months) when a detailed home environment assessment is undertaken and sample collection performed. This is designed to complement and validate the more frequently obtained environmental questionnaires by providing observational data on the home, its contents, and environment, at a critical time in early life. The RAs conducting this assessment received group training, with annual in-person refresher courses led by experienced home inspectors recommended by the CMHC. In addition to ensuring a consistent approach to data capture at a key developmental time point, this visit enables an objective evaluation of the accuracy of some of the home-related information provided independently by the mother in the questionnaires.
The home assessment only represents a snapshot in time and therefore does not inform us of additional child and family behaviors affecting exposure. However, these data are obtained in each of the questionnaires, including information such as frequency of use of appliances (e.g., air conditioning (AC), air cleaners, wood stoves, and humidifiers), products (personal care, home-care), cooking and cleaning, garage parking, and indoor hobbies. Time-activity information for the mother (when pregnant) and for the child is also a critical part of both the detailed and the shorter update questionnaires, and is captured by asking about activity over set time periods in the past (e.g., “previous two weeks”, “since last questionnaire”), which are based on expected reliability of the mother's recall. This also includes information such as sleeping locations in the home and time-location patterns (time spent outdoors, time away from home, time in transit, and at swimming pools).
Rationale and Description of Methods by Exposure Domain
General home characteristics and performance
In the detailed questionnaires (at recruitment, and at 3, 12, 36, and 60 months of age), the mothers report the type of dwelling that best describes their home, the date of construction, the size in square feet, and internal and external improvements, and renovations done within a defined time period. During the home visit, the RA also notes the type of structure and examines the exterior of the home, including the composition and condition of wall cladding and roofing and the integrity of water-shedding planes (e.g., roofing shingles, rain gutters, downspouts, site grading, etc.). Gaps and cracks on the exterior cladding of the house, which indicate the potential for water infiltration as well as possible entry points for pests, and the integrity of weather stripping around doors and windows (particularly doors leading to attached garages) are documented. The RA performs measurements using a laser distance meter for estimating the volume of the indoor space. Volume affects the amount of dilution that is immediately available to disperse airborne contaminants and disease vectors and is used to calculate occupant density (people by interior volume), providing a basis to predict the occupant-related moisture contribution (e.g., from respiration, cooking, bathing, etc.) The number of children and adults living in the home as well as behaviors such as frequency of opening windows is recorded on the questionnaires. Owing to cost constraints, only one home assessment per family is possible. Hence, if a family moves after the 3-month visit, information on the new living environment is only obtained via questionnaire.
Floors, walls, and furniture
During the home assessment, the RA examines all rooms including the below grade space, mother's bedroom, child's bedroom, living room, kitchen, and bathroom(s). Flooring type, flooring age, number of pieces of furniture made with different materials (solid wood, pressed wood/veneer, leather, fabric, plastic/vinyl, and metal), wall and window covering, and any water damage that might increase breakdown and subsequent release of organic compounds from building materials are recorded. The questionnaires and home assessment document the existence of a basement, its main uses and whether the basement walls and floors are finished. These details will be informative of indoor emissions of volatile and semi-volatile (SVOC) chemicals.23
Heating and ventilation/air conditioning (HVAC) systems
The primary type of home heating (e.g., forced air, radiant) and fuel (e.g., natural gas, oil, wood) exert strong influences on the burden and propagation of health-relevant indoor contaminants including particles (PM10, PM2.5), gases (CO, NOX), and microbes (molds, bacteria).24 Although indoor air concentrations of these contaminants are not measured quantitatively in the CHILD study, data collected on the types of HVAC equipment, its physical condition, and usage patterns offer an indication of the types of contaminants that may be present and their potential for indoor sequestration and/or release. The seasonal use, physical condition, and maintenance practices of heating systems are recorded on each of the detailed questionnaires and by the RA during the home assessment. The cleaning and maintenance regimens of ducted air conveyance systems, where present, are also captured by questionnaire. Comfort cooling systems make a significant contribution to the burden of indoor contaminants as sites for the amplification and dispersal of microbes and other allergens.25 The presence and type of AC and its usage, which is also informative of summertime air exchange,26 are recorded by the RA and on multiple questionnaires.
Moisture, water leaks, and mold
Owing to measurement challenges27, 28, 29, 30 and the high degree of variation in fungal levels31 in air and dust, the assessment of mold typically relies on the documentation of visible mold affected areas as determined by an experienced inspector.27, 32, 33 Thus, during the home visit the presence of suspected areas of moisture damage and the existence and extent of visible mold colonization are documented by the RA. The larger the area, the greater the potential for exposure to fungal spores. The presence and sources of moisture and water leaks, which may also indicate mold, are identified by the detailed questionnaires. These data, in combination with objective measures of selected mold allergens, endotoxin, and beta-(1,3)-d-glucan from dust (described below), will be used to model the potential for occupant exposure. As models are developed they will consider the fact that fungal burden of indoor air is episodic and related to multiple factors, including the total mass of settled dust, the amount of activity, and building features that act to moderate ventilation.
Garages
Vehicles parked in attached garages are an important source of indoor chemical exposure.34, 35 Other gasoline-powered engines, fuels, oils, and chemicals are often kept in garages and also represent a potential source of elevated exposures to these toxicants. For single-family dwellings the garage type (attached, detached, carport, no garage) is determined as well as the presence of a door connecting the garage to the home interior. Mothers are asked about the number of vehicles regularly parking in the garage by season and the typical daily frequency that they come and go, and the presence of other combustion engines and odors. In the RA visual home assessment observations about the number of common walls between the garage and interior living space, the tightness of the seal for the garage door and for the door from the garage to the house, evidence of usage by vehicles, the amount, and types of chemicals stored in the garage, and any odors in the garage are documented. In multi-family dwellings, the nature of the parking facility and its physical proximity and structural connection to the living space is recorded. RAs then examine the common garage area for size and usage and note any smell of vehicle emissions in common hallways of the building, particularly near where the child sleeps.
Pets
The impact of early life exposures to furry pets has been the subject of recent debate because of reports of antithetical effects of some pet exposures on atopic risk.7 Elucidation of the degree of pet-associated atopic and asthma risk or benefit requires characterization of subject genotype and phenotype as well as allergen composition and burden including the timing of exposure. The type and number of furry pets in the home is assessed in every environmental questionnaire. Additional information on pets is obtained from the home assessment based on odors detected by the RA on entering the house. Pet exposure will also be quantified through analysis of house dust (i.e., allergens, bacteria, and endotoxin).
Pests
Signs of indoor pest activity, notably rodents, and arthropods are covered in questionnaires and are also recorded by the RA through observation of the animals themselves, the frass or feces, or the observation of apparent efforts to control specific pests such as rodent or cockroach traps or bait. Specific allergens related to these and other pests (e.g., dust mites) will also be measured in house dust.
Swimming pools, hot-tubs, and associated chemicals
Specific questions are asked on time spent in or near (<3 meters) swimming pools, hot-tubs, and saunas. Their presence in the home or at a nearby facility in the case of multi-family dwellings and indoor vs outdoor is noted. They represent a potential source of moisture and disinfection by-products, which may pose a risk to the development or exacerbation of respiratory conditions, including asthma.36, 37, 38 The chemicals used to disinfect the pool or hot-tub (chlorine, bromine, salt) and their storage location is also ascertained. Visits to public swimming pools are tracked more frequently (in each environmental questionnaire) so that the total number of hours the child spent in or near indoor or outdoor pools can be estimated.
Cleaning and chemical products
The presence (in the home or attached garage) and frequency of use of chemical products, including house cleaning materials, air fresheners, mechanical solvents (e.g., gasoline cans, camping fuels, paints, lubricant sprays, etc.) are recorded on all of the detailed questionnaires. To validate the questionnaire responses, the RA also identifies the presence and the total number of such products during the home assessment. Potentially hazardous exposures from hobby activities in the home are also determined from information gathered on the detailed questionnaires.
Cooking emissions
Cooking can be a significant indoor source of air pollutants.39 Details on cooking appliances, fuel type, ventilation, and usage behavior are captured during the home assessment as well as all of the detailed questionnaires.
Personal and child-care products
The detailed questionnaires ask about the use of baby products or other personal-care products such as baby powder, lotion, and wipes, noting the frequency of use so that potential chemical exposure can be assessed. This also includes the length of time baby is using articles such as a pacifier, teething rings, and soft plastic toys as well as the type and frequency of use of baby bottles, baby food containers and utensils, and other behaviors related to the use of plastic containers to heat, serve, or store liquids and solid food.
Second-hand tobacco smoke
Exposure to second-hand smoke in early life is consistently associated with increased incidence of lower respiratory and wheeze illnesses, and with asthma exacerbation.21 All questionnaires ask if anyone smokes at the baby's home, where they smoke (inside, outside, or in garage/by open window), and average number of smokes (cigarettes, pipes, or cigars) per day. The mother is asked about the frequency of the baby's exposure outside the home, including during the prenatal period. Tobacco smoke odor is assessed by the RA during the home assessment. The ability of the questionnaire and home assessment information to predict exposure is being determined by analyzing urinary cotinine levels in a subset of children.
Take-home occupational exposures
Parental occupational and “take-home” exposures can be important to developing children.40, 41 These are assessed in the CHILD study on all the detailed questionnaires, enquiring whether household members work with hazardous chemicals and what they do to minimize home exposures (i.e., behaviors like changing work clothes and shoes, showering and separate laundering of work clothes). Type of work is classified by the North American Industrial Classification System.42 Given the importance of prenatal exposures, the mother is asked about her work activities and exposure to dusts, fumes, vapors, or chemicals on her skin.
Indicators of dust exposure and home cleanliness
Occupant questionnaires and physical inspections are used to assess the potential and extent of dust burden, including measures of cleaning behaviors and tools used (e.g., frequency of vacuuming, use of HEPA vacuum, or other cleaning tools). The presence and scale of dust reservoirs are assessed by inspection and direct measurement from the floor and baby's bed (see below). The presence and types of carpeting, number of upholstered furnishings and toys, and use of allergy covers on bedding are noted.
Exposures Assessed through Measurements and/or Models
Outdoor TRAP
Motor vehicle traffic has been linked to asthma development and exacerbation and is an important contributor to outdoor air pollution in the CHILD recruitment cities. Exposure to TRAP is estimated from land-use regression (LUR) models that capture fine spatial concentration gradients of outdoor NO2 across the cities. Residential GPS coordinates measured during the home visit allow residence-specific assignment of exposure. In addition, the mother is asked on each detailed questionnaire to provide the address(es) of locations where the child spends time away from home. If a child spends at least 1 h/day or 7 h/week away from home during a typical week at 1–2 consistent location(s), such as daycare, the outdoor NO2 is estimated by LUR for that location and combined with the residential value based on the time spent in each location (see next section on time-activity-location).
LUR models43 have been developed separately for each of the four cities. This includes an NO2 model (LUR-NO2) for Toronto44 and nitric oxide and NO2 models for Edmonton, Winnipeg (the two rural Manitoba communities do not have these estimates),45 and Vancouver.46, 47 Other outdoor air pollutants (e.g., fine particulate matter (PM2.5), ozone, oxides of nitrogen (NOx), sulphur dioxide) are measured hourly in each of the cities by the National Air Pollution Surveillance (NAPS) network.48 These data are available for assigning exposure to CHILD participants although with limited ability to resolve within-city spatial variations. However, the temporal detail from NAPS is also used to adjust the spatially-resolved LUR models to estimate individual-level outdoor air pollution concentrations during specific exposure time windows.49
Time-activity-location
Time-activity patterns affect personal exposure owing to variations in exposures including air pollutant concentrations by location across the city and according to microenvironments. For example, exposures to air pollutants near and in the transportation microenvironment are often elevated compared with other microenvironments.50, 51
To improve estimates of total TRAP exposure, the LUR models are combined with time-activity and location information obtained in the questionnaire at multiple time points, along with changes in home address. As indicated above, the air pollutant levels at 1–2 locations regularly visited outside of the home are derived from LUR and combined with the levels predicted for the home location(s) based on percentage of time in each location. For traffic-related air pollutants the exposure estimate is defined as
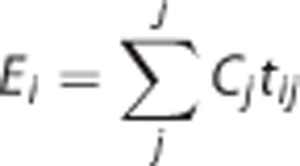 |
where Ei is the total exposure for person i, Cj is the pollutant concentration in the outdoor microenvironment j, and tij is the time spent by the person i in the outdoor microenvironment j. Ei can be determined based on all j microenvironments for which tij is reported and an estimate of Cj is available. In this way it will be possible to account for common behaviors such as time and mode of transit during the course of the day.52, 53, 54 This approach can potentially reduce misclassification that results from an exposure assignment based solely on home location.55, 56 For the period in utero, the pregnancy questionnaire considers the mothers' activities and location, e.g., workplace.
Because the LUR models provide estimates of outdoor concentrations, but most time is spent indoors, the exposure estimates can be further refined to account for ventilation differences between homes and over time. To estimate home ventilation, we have adapted a model of PM2.5 infiltration (the fraction of the outdoor PM2.5 concentration that makes its way indoors and remains suspended) previously developed for the Multi-Ethnic study of Atherosclerosis and Air Pollution (MESA Air) study in the United States.57 The model includes information on residence characteristics and behaviors including presence/use of AC, outdoor air temperature, window opening, and use/type of heating. All of these variables are collected in CHILD, but because the CHILD and MESA Air questionnaires differ we have mapped variables in the MESA Air questionnaires to the most similar questions available in CHILD.49 As our TRAP exposure of interest is NO2, PM2.5 infiltration will be used as a surrogate for home ventilation and infiltration of TRAP, in general, and where appropriate we will assess effect modification by ventilation in stratified analyses.49
Exposure-Related Measurements from House Dust and Bio-Specimens
House dust quantity and composition
Biological and chemical contaminants in household dust have long been used as a proxy for indoor environmental exposure.58 The weight of house dust vacuumed from a standard area has also been associated with asthma.59 House dust consists of a dynamic array of particles of various sizes originating from a wide range of sources, including anthropogenic (skin dander), zoogenic (pet hair and dander), combustion (indoor and outdoor sources), consumer products, soil particles (from foot and animal traffic), plant pollen, mold spores, bacterial cells, and viruses.60 SVOC household chemicals may also adsorb onto particles.61 Under permissive moisture conditions, particles may also be host to active saprotrophic communities of molds and bacteria.
Dust serves as a reservoir from which particles can become resuspended during activity, contributing to the "personal cloud" effect. Thus, dust samples represent not only an integrated record of the transient fluxes of airborne particles, but also an important exposure source and, in the case of microbes, a potential amplification site.62 The actual exposure route that dust concentrations represent is complex. The exposure likely follows a combination of inhalation and ingestion routes. The relative importance of these pathways will vary by subject, subject age, home characteristics (indoor temperature, how well the home is sealed), home activity level (i.e., to stir up dust), and season. Dermal exposure is also possible from some components in dust.63
Collection of dust samples
Typically, 200 mg of dust was collected by the RA from two locations in the home during the 3-month visit, using a consumer-model vacuum cleaner (Sanitaire, Model S3686)64 outfitted with a custom-built, depyrogenated aluminium nozzle attachment that accommodates two nylon mesh thimble filters (DustStream, Indoor Biotechnologies). This design maximizes collection and minimizes the potential for contamination from endotoxin, plastics, and other sources. A composite dust sample was collected from the mattress where the child sleeps and the adjacent flooring, and a second sample (two fresh thimbles) taken from a 2 m2 area of flooring in the “most-used living area” by making seven passes of the nozzle over adjacent swaths of flooring. At every 20th home visit, a control dust sample is prepared by dumping 100 mg of NIST vacuum dust standard (SRM 2585) into a thimble that is brought to the field in a sterile bottle. This sample is then handled in the same manner as the home dust samples. Details of the dust collection are available in Supplementary Information 3.
Thimbles containing dust are transported in sterile glass bottles, stored at room temperature, and shipped monthly to the central dust processing lab and held at room temperature for up to 2 weeks. Processing occurs in batches and involves removing obvious large contaminants (e.g., large hair balls, stones, food pieces), weighing the sample (total weight), then sieving it to obtain the fraction passing through a 150 μm screen and weighing this “fine” dust fraction. The excluded larger dust particles/material is stored at room temperature in sterile bottles. The sieved fractions are divided into multiple aliquots of at least 25 mg each and frozen at −80 °C pending further biological and chemical analyses. Table 3 describes the various biological and chemical measurements to be acquired from the fine dust.
Table 3. Biological and chemical constituents measured to date in house dust.
| Measurement | Method | Reference |
|---|---|---|
| Coarse dust weight | Gravimetric | 59 |
| Fine dust weight | Gravimetric (sieved 150 μm fraction) | 103, 104 |
| Endotoxin | Kinetic chromogenic limulus amebocyte lysate | Chromo-LAL (associates of Cape Cod, East Falmouth, MA, USA) |
| Beta-(1,3)-d-glucan | Kinetic chromogenic factor C-deficient limulus amebocyte lysate | Glucatell (associates of Cape Cod, East Falmouth, MA, USA) |
| Aeroallergens | Standard ELISA or Luminex ELISA | To be determined |
| Polycyclic aromatic hydrocarbons | Gas chromatograph — mass spectrometry | 105 |
| Hopanes | Gas chromatograph — mass spectrometry | 79, 106 |
| Phthalates | Gas chromatograph — mass spectrometry | 105 |
Biological Compounds in Dust
Endotoxin and beta-(1-3)-d-glucan
Beta-(1,3)-d-glucans (i.e., β-glucans) are a group of polysaccharides that occur in fungal and plant cell walls and have been used as indicators of fungal load in dust. Endotoxins are high molecular weight compounds in the cell membranes of Gram-negative bacteria and are potent immune activators.27 There are multiple sources of endotoxin in the indoor residential environment, including house dust,65, 66 cigarette smoking,67, 68 animals,69, 70, 71, 72 and central AC systems.69 Both endotoxins and β-glucans can activate the innate immune response.
Aliquots of sieved dust are extracted in 10 ml of pyrogen-free water at 25 °C for 30 min in an ultrasonic bath. Pyrogen-free apparatus is used for all manipulations. Endotoxin concentrations are assayed using the Chromo-LAL kinetic chromogenic LAL detection kit incubated at 37°C and assayed in microplate reader at 405 nm following the methods described by the manufacturer (Associates of Cape Cod, East Falmouth, MA, USA). Endotoxin content of field samples and blanks are evaluated by interpolation against a standard curve prepared using an endotoxin standard. This method has a sensitivity range from 0.01 to 100.0 endotoxin units ml–1 extract. Beta-(1,3)-d-glucan is measured following a similar extraction procedure followed by analysis using the Glucatell beta-(1,3)-d-glucan detection kit from the same manufacturer.
Aeroallergens
Dust will be analyzed for dog (Can f 1), cat (Fel d 1), and house dust mite (Der p 1, Der f 1, Mite Group 2) together with other common indoor aeroallergens, such as cockroach (Bla g 1, Bla g 2), mouse (Mus m 1), rat (Rat n 1), and selected fungal allergens.
SVOC organic compounds
A range of SVOC and non-volatile (NVOC) chemical compounds accumulate in house dust. They become part of the dust reservoir through deposition of suspended particles containing SVOCs and NVOCs, through deposition or partitioning of gas phase SVOCs to dust or other surface materials, and through abrasion and shedding of larger particles from solid materials, including from clothes and footwear.73, 74 Concentration measurements from the dust have been used as a proxy for exposure to SVOCs, NVOCs, and related compounds.
Three classes of organic compounds, phthalates, polycyclic aromatic hydrocarbons (PAH), and hopanes, are initially being analyzed from ~10 mg of the sieved dust samples. Phthalates are ubiquitous in the indoor environment because of their widespread use in building materials, home furnishings, and other products (e.g., baby toys), including those for baby care, hygiene, and cosmetics. Phthalates readily leach from these materials into air, food, or other materials and potentially impact humans through multiple routes of exposure.75 PAHs are a well-known class of toxic organic compounds, which form during combustion and have been implicated in a number of adverse effects, including asthma.76, 77 Hopanes are emitted from internal combustion engines owing to their presence in lubricating oil. They are considered a marker of traffic emissions when measured in outdoor air.78 Similarly, their accumulation in indoor dust has the potential to provide an indication of the magnitude of local traffic emission and reflect home-specific infiltration efficiencies of outdoor traffic pollutants. CHILD questionnaire items related to home ventilation and track-in behavior increase the proportion of variability explained in models of hopanes in house dust relative to outdoor air.79
The current method for combined PAH, phthalate, and hopane analysis involves spiking the dust sample with deuterated recovery standards (diethyl phthalate (DEP)-d4, napthalene-d8, acenapththene-d10, phenanthrene-d10, chrysene-d10, perylene-d12, n-tetracosane-d50) followed by extraction using an accelerated solvent extractor (ASE 200) with a 7:3 hexane/acetone solvent mixture. The extract is concentrated in 0.5 ml of iso-octane using a Zymark TurboVap II. An internal standard (fluorantehene-d10) is then added before analysis of a 1 μl aliquot using an Agilent Technologies 6890N GC (Agilent J&W capillary DB-5MS +DG, 122-5532G) with a 5973 inert Mass Selective Detector and a 7693 Autosampler.
Exposure biomarkers in bio-specimens
Biological samples obtained from CHILD study subjects include: maternal and paternal blood; cord blood and the child's blood at 1 and 5 years of age; breast milk at 3 months; baby meconium, stool at 3 and 12 months and urine at 3 months, 1, 3, and 5 years.80 At present, stool is being analyzed for the microbiome at 3 and 12 months, house dust microbiome at 3 months and urine is analyzed for phthalate metabolites at 3 months, 1 and 3 years and at 3 months for tobacco smoke metabolites. These samples represent CHILD's rich resource for future research on the exposome for each child.11, 81
The 3-month urine sample is collected at the home visit by the trained RA. Details for the method can be found in Supplementary Information 4. Metabolites from six common phthalates, dimethyl phthalate, DEP, dibutyl phthalate, benzyl butyl phthalate, di(2-ethylhexyl) phthalate (DEHP), and di-n-octyl phthalate are measured in urine at AXYS Technologies Inc. (Sidney, British Columbia, Canada). With three DEHP metabolites, eight metabolites in total have been measured for the first half of the cohort (n=1539) at 3 months with a subset of this group followed up at 1 and 3 years. The analysis entails enzymatic deconjugation followed by high-performance liquid chromatography/tandem mass spectrometry.82 Cotinine and trans-3-hydroxy-cotinine are also being measured in the full cohort at 3 months by liquid chromatography-atmospheric pressure chemical ionization tandem mass spectrometry (US Centers for Disease Control analytic laboratories83). All metabolite concentrations are adjusted for urine concentration by specific gravity.
Data quality control
A rigorous quality assurance program as described by Whitney, Lind, and Wahl84 is followed in the CHILD study. This entails detailed study protocols, data entry and management systems, standard operating procedures, and uniform data collection instruments. All of these measures have been reviewed, pilot tested, and formally documented. To ensure completeness and consistency in the questionnaire data, the RAs are available to clarify issues with the mothers upon completion. The answers are reviewed at least twice, once by the RAs and once in the national data center. Any gaps or inconsistencies are resolved, contacting the mother for clarification if necessary. Site visits by CHILD leadership ensure consistency among sites. Each home assessment is performed by a qualified RA and often a second RA in training. To perform independent home assessments, the RA must complete at least one group training program, as described above, and have performed 20 home visits supervised and reviewed by a more experienced RA. Additional quality assurance mechanisms are built into the system by collecting some common information in the questionnaires and the home assessment. These data are compared for inconsistencies, as well as comparison of information that is not expected to change between the questionnaires administered at different time points. For example, the mothers are asked questions pertaining to mold and dampness, and the RAs were trained to recognize and quantify mold. Cross-comparisons of these independent sets of observations will help validate the questionnaire data and provide insight into possible reporting bias in the questionnaires.
EARLY RESULTS
Data are now available from most of the cohort for the first year of the study. This section will describe some baseline characteristics of the cohort and their homes, along with a few key exposures during the prenatal period that illustrate the level of detail and breadth of the questionnaire data. Some variation in the denominators reflects differences in the frequency of missing data. There was moderate diversity of socioeconomic status but, as with many cohorts, a bias exists toward families with higher income and higher educational achievement. As shown in Table 4a, most families have two adults, and the enrolled baby was the family's first child for half of the cohort. On average, fewer than 6% of participants reported four or more adults living in the home. Furry pets were present in nearly half of all homes and rodents and cockroaches were reported in 13.3% and 1.4% of homes, respectively.
Table 4a. Characteristics of participating households by city in the prenatal period.
| Edmonton | Toronto | Vancouver | Manitoba | All centers | |
|---|---|---|---|---|---|
| Number of adult occupants (n (%)) | |||||
| One adult | 18 (2.4) | 17 (2.1) | 14 (1.9) | 37 (3.7) | 86 (2.6) |
| Two adults | 627 (83.7) | 694 (85.9) | 606 (82.8) | 863 (85.4) | 2790 (84.6) |
| Three adults | 68 (9.1) | 51 (6.3) | 53 (7.2) | 60 (5.9) | 232 (7.0) |
| Four or more adults | 36 (4.8) | 46 (5.7) | 59 (8.1) | 50 (5.0) | 191 (5.8) |
| Number of child occupants (excluding the index child) (n (%)) | |||||
| No. of children | 309 (41.5) | 465 (57.5) | 411 (56.1) | 458 (45.4) | 1643 (49.9) |
| One child | 297 (39.9) | 255 (31.6) | 245 (33.5) | 325 (32.2) | 1122 (34.1) |
| Two children | 115 (15.4) | 73 (9.0) | 57 (7.8) | 155 (15.4) | 400 (12.1) |
| Three or more children | 24 (3.2) | 15 (1.9) | 19 (2.6) | 70 (6.9) | 128 (3.9) |
| Furry pets in the home (n/N (%)) | |||||
| Pets | 428/749 (57.1) | 320/807 (39.7) | 310/731 (42.4) | 542/1010 (53.7) | 1600/3297 (48.5) |
| Pests noticed in the home in the past year (n/N (%)) | |||||
| Any pests | 254/749 (33.9) | 368/808 (45.5) | 363/731 (49.7) | 407/1009 (40.3) | 1392/3297 (42.2) |
| Rodents | 70/749 (9.3) | 117/808 (14.5) | 89/731 (12.2) | 162/1009 (16.1) | 438/3297 (13.3) |
| Cockroaches | 3/749 (0.4) | 29/808 (3.6) | 10/731 (1.4) | 4/1008 (0.4) | 46/3296 (1.4) |
Note: sample sizes within each center differ for some characteristics owing to differences in missing values, in which case data are presented as n/N (%) where N is the total sample available for that variable in that center.
Housing characteristics derived from the prenatal questionnaire are summarized in Table 4b based on 3303 homes. The age of the housing stock varies geographically with the greatest percentage of new homes (built after 1989) in Edmonton (51%) and more families living in older homes (built before 1970) in Manitoba and Toronto (52% each), after excluding those unsure of the date of construction. Edmonton had the largest number of homes with attached garages (41%) and Vancouver the fewest (13%). Gas was the primary heating fuel in Edmonton, Toronto, and Manitoba but electric heat was equally as common in Vancouver. Nearly 71% had homes with basements, and 24% of these basements were reported to be damp. Basements were being used as living space by 58% of the families with a basement, and 24% of these families considered their basement damp. Renovations in the year prior to the birth of the index child were completed in the majority of homes, ranging from 50% to 66% across the four cities.
Table 4b. Characteristics of houses in the prenatal period by city.
| Edmonton | Toronto | Vancouver | Manitoba | All centers | |
|---|---|---|---|---|---|
| Year the house was originally built (n (%)) | |||||
| 1939 or earlier | 12 (1.6) | 230 (28.5) | 128 (17.5) | 170 (16.9) | 540 (16.4) |
| 1940–49 | 22 (2.9) | 44 (5.4) | 17 (2.3) | 60 (6.0) | 143 (4.3) |
| 1950–59 | 56 (7.5) | 58 (7.2) | 40 (5.5) | 118 (11.8) | 272 (8.3) |
| 1960–69 | 55 (7.3) | 37 (4.6) | 42 (5.8) | 87 (8.7) | 221 (6.7) |
| 1970–79 | 102 (13.6) | 26 (3.2) | 88 (12.1) | 12a7 (12.7) | 343 (10.4) |
| 1980–89 | 72 (9.6) | 64 (7.9) | 81 (11.1) | 98 (9.8) | 315 (9.6) |
| 1990 or later | 332 (44.3) | 250 (30.9) | 261 (35.8) | 181 (18.0) | 1024 (31.1) |
| Don't know | 98 (13.1) | 99 (12.3) | 72 (9.9) | 162 (16.1) | 431 (13.1) |
| Does the house have an attached garage? (n (%)) | |||||
| No | 352 (47.5) | 351 (43.5) | 327 (45.0) | 589 (58.4) | 1619 (49.3) |
| Yes | 301 (40.6) | 228 (28.3) | 92 (12.7) | 298 (29.6) | 919 (28.0) |
| Apartment | 88 (11.9) | 227 (28.2) | 308 (42.4) | 121 (12.0) | 744 (22.7) |
| Does the house have a basement? | |||||
| No basement | 103 (14.6) | 229 (30.2) | 419 (61.8) | 156 (16.2) | 907 (29.2) |
| Basement | 603 (85.4) | 530 (69.8) | 259 (38.2) | 807 (83.8) | 2199 (70.8) |
| Basement used as living space (* % of those with basement) | 353 (58.8)* | 285 (54.1)* | 154 (61.6)* | 471 (59.2)* | 1263 (58.1)* |
| Visible signs of mold (* % of those using basement as living space) | 21 (3.5)* | 33 (6.3)* | 16 (6.4)* | 85 (10.6)* | 155 (7.1)* |
| Damp (* % of those using basement as living space) | 126 (20.9)* | 143 (27.0)* | 49 (19.0)* | 213 (26.6)* | 531 (24.2)* |
| Renovations or additions in the last 12 months | |||||
| Yes | 414 (55.7) | 469 (58.2) | 365 (50.1) | 666 (66.1) | 1914 (58.2) |
| No | 293 (39.4) | 312 (38.7) | 326 (44.7) | 288 (28.6) | 1219 (37.1) |
| Don't know | 36 (4.8) | 25 (3.1) | 38 (5.2) | 54 (5.3) | 153 (4.7) |
| Types of fuel used in the house (n/N (%)) | |||||
| Gas/propane | 639/750 (85.2) | 597/808 (73.9) | 402/732 (54.9) | 635/1013 (62.7) | 2273/3303 (68.8) |
| Oil | 0/750 (0.0) | 6/808 (0.7) | 7/632 (1.0) | 7/1013 (0.7) | 20/3303 (0.6) |
| Electric | 82/750 (10.9) | 123/808 (15.2) | 406/732 (55.5) | 334/1013 (33.0) | 945/3303 (28.6) |
| Wood | 20/750 (2.7) | 4/808 (0.5) | 7/732 (1.0) | 26/1013 (2.6) | 57/3303 (1.7) |
| Other | 18/707 (2.5) | 21/760 (2.8) | 43/680 (6.3) | 31/964 (3.2) | 113/3111 (3.6) |
| Don't know | 41/707 (5.8) | 83/760 (10.9) | 30/680 (4.4) | 51/964 (3.2) | 113/3111 (3.6) |
| Household gas appliances (n/N (%)) | |||||
| Gas fireplace | 236/742 (31.8) | 146/805 (18.1) | 212/731 (29.0) | 91/1000 (9.1) | 685/3278 (20.9) |
| Gas stove or oven for heating | 26/744 (3.5) | 56/805 (7.0) | 47/731 (6.4) | 25/997 (2.5) | 154/3277 (4.7) |
| Gas space heater | 16/744 (2.2) | 20/804 (2.5) | 23/730 (3.2) | 23/1000 (2.3) | 82/3278 (2.5) |
| Gas water heater | 557/749 (74.4) | 492/806 (61.0) | 355/731 (48.6) | 431/1003 (43.0) | 1835/3289 (55.8) |
| Gas stove for cooking | 97/748 (13.0) | 257/808 (31.8) | 214/732 (29.2) | 41/1009 (4.1) | 609/3297 (18.5) |
Note: sample sizes within each center differ for some characteristics owing to differences in missing values, in which case data are presented as n/N (%) where N is the total sample available for that variable in that center.
Cleaning habits did not vary widely with most people cleaning four or fewer times per month (Table 4c). Over 80% of mothers worked during pregnancy (89% in Toronto), and 17% of working mothers reported that they were exposed to dust or fumes in the air and/or were dermally exposed to chemicals on the job. Chemical scents, a source of volatile organic compounds, were commonly used, with 59% using scented candles, 49% spray air fresheners, and 29% liquid or solid air fresheners.
Table 4c. Cleaning habits and examples of potential chemical exposures in the prenatal period by city.
| Edmonton | Toronto | Vancouver | Manitoba | All centers | |
|---|---|---|---|---|---|
| Cleaning frequency per month (n (%)) | |||||
| 4 or less times | 591 (79.7) | 671 (83.3) | 625 (85.6) | 762 (75.8) | 2649 (80.7) |
| 5–14 times | 116 (15.7) | 111 (13.7) | 91 (12.5) | 197 (19.6) | 515 (15.7) |
| 15 or more times | 34 (4.6) | 24 (3.0) | 14 (1.9) | 46 (4.6) | 118 (3.6) |
| Mother's work and hobby exposures (n (%) or n/N (%)) | |||||
| Did not work | 124 (17.5) | 86 (11.3) | 96 (14.1) | 186 (19.4) | 492 (15.8) |
| Mother worked during pregnancy | 583 (82.5) | 674 (88.7) | 583 (85.9) | 775 (80.6) | 2615 (84.2) |
| Mother exposed to dust, fumes or chemicals on skin | 129 (22.1) | 88 (13.1) | 78 (13.4) | 159 (20.5) | 454 (17.4) |
| Fumes, dust or vapor with hobbies | 69/707 (9.8) | 33/760 (4.3) | 48/679 (7.1) | 77/961 (8.0) | 227/3107 (7.3) |
| Selected chemical exposures (n/N (%)) | |||||
| Liquid or solid air freshener | 235/750 (31.3) | 235/808 (29.1) | 141/731 (19.3) | 346/1009 (34.3) | 957/3298 (29.0) |
| Spray air freshener | 408/750 (54.4) | 373/808 (46.2) | 248/731 (33.9) | 595/1009 (59.0) | 1624/3298 (49.2) |
| Scented candle | 496/750 (66.1) | 405/808 (50.1) | 364/731 (49.8) | 675/1009 (66.9) | 1940/3298 (58.8) |
Note: sample sizes within each center differ for some characteristics owing to differences in missing values, in which case data are presented as n/N (%) where N is the total sample available for that variable in that center.
The LUR model has been applied for a large subset of the children's homes to assess the association between TRAP and atopy.49 Figure 2 shows how LUR-NO2 exposure assigned to the children varied between and within the cities. Homes outside the monitored areas were excluded from the data presented. The overall average outdoor concentration among the homes assessed to date was 14.6 ppb. This is notably higher than the average observed for the urban monitoring sites in each of the CHILD cities and the median on-road NO2 measured on a wide range of road segments across Montreal.48, 85 These higher values for the CHILD subjects may be because some residential locations are closer to roadways than monitoring sites, which are situated to represent urban background conditions. The highest average LUR-NO2 exposures were in the larger cities of Toronto and Vancouver and the lowest in Winnipeg. Figure 2 shows considerable between- and within-city variability in residential outdoor NO2 concentrations.
Figure 2.

Temporally adjusted (bi-weekly averages) estimates of Land-use Regression (LUR) derived NO2 in the four participating cities (dotted lines represent the mean, the box plots bars show the 25th, median, and 75th percentiles).
DISCUSSION
This paper describes the methods used in the CHILD study for collecting environmental exposure information related to the physical environment at multiple time points prenatally and during early life. We have presented selected results from the baseline environmental questionnaire to demonstrate our ability to collect a broad spectrum of information on well over 3000 babies and to provide an initial look at the exposure characteristics of the CHILD cohort. Related papers3, 80 provide complementary details regarding the cohort and methods, characteristics and assessments of other exposures, such as diet, drugs, stress, and infections, thereby leading to a comprehensive characterization of potential risk factors considered in the CHILD study.
Multiple birth cohorts are in progress around the world. Several of these cohorts have logged over a generation of data,86, 87 whereas others are more recent (e.g., Swedish Environmental Longitudinal, mother and child, asthma and allergy, the Urban Environment and Childhood Asthma, Stockholm Children Allergy and Environmental Prospective Birth Cohort Study Cohort, Prevention and Incidence of Asthma and Mite Allergy (PIAMA), Avon Longitudinal Study of Parents And Children).20, 88, 89, 90, 91, 92 By-and-large, these studies rely upon self-report for exposures and have limited data on the multiplicity of exposures (e.g. early life infections, microbiome) and have significant differential loss to follow-up. The CHILD study is unique in that no other birth cohort of its size (total 3624 recruited) has included the comprehensive suite of environmental exposures measured prospectively from the prenatal period through 5 years. Different individual aspects of environmental exposures have been explored in past cohorts,11, 20, 93 but these have been limited in the number of exposures considered, in age at enrollment, by a specific focus (e.g., passive smoking) or by sub-optimal exposure assessment methods. Frequently, these studies rely on retrospective assessment for key exposures (e.g., traffic air pollution exposures for the PIAMA cohort90) adding to potential exposure misclassification. The comprehensive, prospective, and longitudinal approach to exposure assessment in the CHILD study is expected to offer considerable improvement over many past studies in assessments of the environmental origins of allergy, asthma, and other chronic diseases.
Challenges and Limitations
Many limitations remain in our exposure assessment. For example, we do not know how well our intensive home assessment at 3–4 months represents the early life “window of vulnerability” we are attempting to assess. Single measurements of house dust can be a reasonable representation of several exposures over time, but precision is lacking.59, 94, 95, 96, 97 Indoor air measurements of biological and chemical contaminants can be more precise than inferences from dust, questionnaires, and LUR modeling. The CHILD study does not include indoor air measurements due to cost, extra burden placed on the family, and limitations in methods and knowledge of what time points are most appropriate for sample collection. However, aliquots of blood, urine, and breast milk are archived for analysis of biomarkers.80
The episodic and categorical nature of the questionnaire data restricts the use of continuous measures of exposure. We plan to address this latter issue at least partially with some of the analytic methods described below. Whereas residence changes and major residential renovations during the first 5 years of life are documented, we could not make a second home visit or repeat sampling for dust. Fortunately, relatively few subjects moved during the first year of life (~17%). Analyses restricted to children who did not move will therefore be possible.
Time-activity information is obtained by recall and this reduces confidence in the data. However, requesting families to complete activity diaries adds burden and still represents a snapshot in time. We thus restricted the time-activity information acquired to that which mothers are more likely able to recall and ask for such information on multiple occasions at intervals of only 6 months during the first 3 years of life. This should lead mothers to become more familiar with the information desired and so we can compare the information over time. The relatively frequent repetition of the detailed and update questionnaires allows us to combine the information at multiple time points to improve precision and/or compare adjacent time periods and identify major changes. This level of detail might signal difficulty in recall for one of the periods and thereby be used to improve assessments. However, the goal is to retain as much valid information as possible about behavioral changes across time that could influence exposure.
Analytical Plans
The exposure assessments in the CHILD study generate an enormous amount of data, thus posing inherent analytical challenges. The large number of exposure-related variables and their interactions potentially lead to high-dimension covariates in regression models. Colinearity among these exposures adds to the difficulty of high dimensional variable selection. Consequently, the traditional statistical methods, such as forward, backward, and best subset selection, may suffer from being unstable with increased prediction errors and computational demands. Therefore, prior to more complex longitudinal and multi-interaction analyses, simpler analytical approaches will be undertaken. Data from individual exposure domains will be integrated into single categorical or continuous variables representing potentially important harmful or protective factors. For example, observations from the home assessment pertaining to mold, such as the presence of mold, and combined area and density of mold by room are used to quantify differences among homes in mold exposure. These integrated house-specific estimates of exposure are validated with the available measurements of beta-(1,3)-d-glucan and endotoxin in dust. Respiratory health outcomes can subsequently be examined in relation to categories of mold exposure (none, low, medium, high) or in relation to a continuous measure based on presence, coverage, and density of mold. These continuous measures are adjusted by modifying factors for indoor mold exposure, such as room volume and ventilation. Longitudinal questionnaire data on home dampness, leaks, and persistent wet areas will be synthesized into simple summary variables.
Taking into account the factors described above, a composite index based on a mold-exposure matrix will be developed, where various combinations of room type, area, density, dampness, and ventilation will be considered. The index values for mold exposure will be determined using data from both RA and home assessment questionnaires, and the more objective measures of endotoxin and beta-(1,3)-d-glucan in house dust samples (n=537 homes). They can then be used as dependent variables regressed against model scenarios (multiple variables) using nonparametric regression methods98 and/or mixture models,99 and their resulting coefficients will be used to weigh and calibrate the index values. For other exposure domains (e.g., pests, moisture), indices based on corresponding exposure matrices will be derived using similar approaches. These indices can then be included independently and in combination with other exposures in subsequent analyses. Similarly, exposure data related to traffic air pollution are being approached in stages. First, simple assignment of LUR-NO2 based on home address with and without stratification based on time spent at home is used49 and then additional sources of TRAP-related exposure arising from time in transit and very local sources such as exhaust arising from housing characteristics, for example, attached garages, will be considered.
After systematic exploratory analyses focusing on single exposure time windows and following the simpler approach described above, exposures from key domains and quantified risk factors will be combined to characterize the longitudinal exposure for each subject. Ultimately, results from this focus on individual exposures and their correlations are expected to lead to identification of the main interacting factors quantified in CHILD that individually or in concert impart risk or protection for allergy and asthma for inclusion in multivariate analytic models.
To address the challenges expected in applying models assessing associations between outcomes and multiple exposures across time, a range of more sophisticated approaches, are also being evaluated for potential application to the CHILD data. For example, statistical methods such as Least Absolute Shrinkage and Selection Operator (LASSO)100 have been widely used for high dimensional variable selection in modern applications (e.g., in genetic studies). If one considers a linear regression model with the log-transformed phthalate metabolites level as the outcome, and the large pool of exposure-related variables collected through the questionnaires as the explanatory variables, LASSO can be used to fit the model and to identify the most important risk factors. When the onset of chronic disease (e.g., allergy or asthma) is the primary outcome of interest, LASSO-penalized logistic regression analysis can be adopted to identify the significant exposures and characterize the precise contribution of each to the outcome.
In addition, to both consider multiple exposures while reducing the number of variables included in the analyses we are developing an a priori classification strategy that combines multiple exposure variables into an index; the a priori Exposure Index (AEI). At present, the AEI takes a simple “tree-branch” approach to classification of risk of inflammatory exposure within the exposure domains described in Table 1. More sophisticated weighting schemes using a weight-of-evidence approach will also be developed, informed by the regression approaches described above. Initial attempts at an AEI have shown potential with intermediate asthma end points such as wheeze, exhaled nitric oxide at 1 year, and interleukin-6 in cord blood.13, 101, 102
Advanced multivariate analysis techniques will also be considered for constructing an informative exposure index. Specifically, statistical classification and dimension reduction methods such as Correspondence Analysis, an analog of Principal Component Analysis for categorical variables, can be used to detect underlying structures among exposure sources and to create the indices, summarizing multiple domains of the exposure. These exposure domain indices can then be used as potential independent variables in the multiple regression analysis with a biomarker concentration, for example, phthalate metabolite or cotinine in urine as the dependent variable in the model. The best small subset regression model that explains maximum variation in the selected dependent exposure variable is used to predict the particular phthalate exposure, for example, and hence acts as a summary index. Alternatively, Fisher Linear Discriminant Analysis may serve the same purpose, with the exception that the principal components identified from the exposure variables can be guided by an outcome, for example, asthma at 5 years or one of several intermediate end points. The first principal component in this approach could then be chosen as a summary index for the exposures initially considered.
CONCLUSIONS
Unraveling the complex interacting risk factors for the development of asthma and allergies continues to be a major challenge for public health. The prospective environmental exposure assessment methods described here has unprecedented breadth and detail across different growth periods with a focus on exposures in early life. These data will be linked independently and collectively to health outcomes from infancy to age 5 years (atopic dermatitis, recurrent wheeze, rhinitis, allergic sensitization, lung function, specialist-diagnosed asthma), as well as to other possible effectors such as epigenetic modifications. The primary limitations of the study relate to the cost to participants for their time and expense of measurement in a large cohort. Our single home visit for deep exposure assessment at 3 months may not represent the most vulnerable period in development, and though we have multiple time points for some biomarkers and questionnaires, precision could always be increased. GEWIS require detailed environmental assessments like those described here. In combination with longitudinal epigenetic data, assessments of the diversity and changes in the gut microbiome and psychosocial factors, CHILD has the potential to detect and understand the complex interactions between multiple environmental factors, genetic variants, and heritable epigenetic imprints that confer susceptibility for the development of asthma and allergy and potentially other chronic diseases throughout the life course.
Acknowledgments
We are grateful to all the families who are participating in this study, and the whole CHILD study team, which includes interviewers, nurses, computer and laboratory technicians, clerical workers, research scientists, volunteers, managers, and receptionists. The Canadian Institutes of Health Research (CIHR) and the Allergy, Genes and Environment (AllerGen) Network of Centres of Excellence provided core support for the CHILD study. Additional support was given by Health Canada, Environment Canada and Canada Mortgage and Housing Corporation. We acknowledge the significant contributions of all CHILD study investigators who are listed below and Chinthanie Ramasundarahettige who assisted with the final tables. Support was provided by CIHR; AllerGen Network of Centres of Excellence; Health Canada, Environment Canada and Canada Mortgage and Housing Corporation. CHILD study investigators: Sears MR, (Director), McMaster University; Subbarao P (co-Director), Hospital for Sick Children; Allen R, Simon Fraser University; Anand SS, McMaster University; Becker AB, University of Manitoba; Befus AD, University of Alberta; Brauer M, University of British Columbia; Brook JR, Environment Canada and the University of Toronto; Chen E, Northwestern University, Chicago; Cyr M, McMaster University; Daley D, University of British Columbia; Dell S, Hospital for Sick Children; Denburg JA, McMaster University; Elliott S, University of Waterloo; Grasemann H, Hospital for Sick Children; HayGlass K, University of Manitoba; Hegele R, Hospital for Sick Children; Holness DL, University of Toronto; Lou WYW, University of Toronto; Kobor M, University of British Columbia; Kollman TR, University of British Columbia; Kozyrskyj AL, University of Alberta; Laprise C, Université du Québec à Chicoutimi; Larché M, McMaster University; Macri J, McMaster University; Mandhane PM, University of Alberta; Miller G, Northwestern University, Chicago; Moqbel R (deceased), University of Alberta; Moraes T, Hospital for Sick Children; Paré P, University of British Columbia; Ramsey C, University of Manitoba; Ratjen F, Hospital for Sick Children; Sandford A, University of British Columbia; Scott JA, University of Toronto; Scott J, University of Toronto; Silverman F, University of Toronto; Takaro TK, Simon Fraser University; Tang P, University of British Columbia; Tebbutt S, University of British Columbia; To T, Sick Children's Hospital; Turvey SE, University of British Columbia.
The authors declare no conflict of interest.
Footnotes
Supplementary Information accompanies the paper on the Journal of Exposure Science and Environmental Epidemiology website (http://www.nature.com/jes)
Supplementary Material
References
- 1Eder W, Ege MJ, von Mutius E. The asthma epidemic. N Engl J Med 2006; 355: 2226–2235. [DOI] [PubMed] [Google Scholar]
- 2Wang HY, Wong GW, Chen YZ, Ferguson AC, Greene JM, Ma Y et al. Prevalence of asthma among Chinese adolescents living in Canada and in China. CMAJ 2008; 179: 1133–1142. [DOI] [PMC free article] [PubMed] [Google Scholar]
- 3Subbarao P, Anand SS, Becker AB, Befus AD, Brauer M, Brook JR et al. The Canadian Healthy Infant Longitudinal Development (CHILD) Study: examining developmental origins of asthma and allergy. J Allergy Clin Immunol, (in review). [DOI] [PubMed]
- 4Martino D, Prescott S. Epigenetics and prenatal influences on asthma and allergic airways disease. Chest 2011; 139: 640–647. [DOI] [PubMed] [Google Scholar]
- 5Kauffmann F, Demenais F. Gene-environment interactions in asthma and allergic diseases: challenges and perspectives. J Allergy Clin Immunol 2012; 130: 1229–1240. [DOI] [PubMed] [Google Scholar]
- 6Canadian Institutes of Health Research. Inventory of Pregnancy and Birth Cohort Studies in Canada. 2009. Available at. http://www.cihr-irsc.gc.ca/e/40516.html, (accessed 6 May 2013).
- 7Hancox RJ, Subbarao P, Sears MR. Relevance of birth cohorts to assessment of asthma persistence. Curr Allergy Asthma Rep 2012; 12: 175–184. [DOI] [PubMed] [Google Scholar]
- 8Thomas D. Gene—environment-wide association studies: emerging approaches. Nat Rev Genet 2010; 11: 259–272. [DOI] [PMC free article] [PubMed] [Google Scholar]
- 9Khoury MJ, Wacholder S. Invited commentary: from genome-wide association studies to gene-environment-wide interaction studies—challenges and opportunities. Am J Epidemiol 2009; 169: 227–305. [DOI] [PMC free article] [PubMed] [Google Scholar]
- 10Thomas D. Methods for investigating gene-environment interactions in candidate pathway and genome-wide association studies. Annu Rev Public Health 2010; 31: 21–36. [DOI] [PMC free article] [PubMed] [Google Scholar]
- 11Arrandale VH, Brauer M, Brook JR, Brunekreef B, Gold DR, London SJ et al. Exposure assessment in cohort studies of childhood asthma. Environ Health Perspect 2011; 119: 591–597. [DOI] [PMC free article] [PubMed] [Google Scholar]
- 12Takaro TK, Stanojevic S, Shu H, Brook J, Allen R, Scott J, McLean K, Subbarao P. Environmental exposures and exhaled nitric oxide at three months of age. Am J Respir Crit Care Med 2012; 185: A3362. [Google Scholar]
- 13Sears MR. The Canadian Healthy Infant Longitudinal Development (CHILD) study. Can Respir J 2010; 17 (Suppl A): 36A–37A. [Google Scholar]
- 14Douwes J, Gibson P, Pekkanen J, Pearce N. Non-eosinophilic asthma: importance and possible mechanisms. Thorax 2002; 57: 643–648. [DOI] [PMC free article] [PubMed] [Google Scholar]
- 15Simpson JL, Grissell TV, Douwes J, Scott RJ, Boyle MJ, Gibson PG. Innate immune activation in neutrophilic asthma and bronchiectasis. Thorax 2007; 62: 211–218. [DOI] [PMC free article] [PubMed] [Google Scholar]
- 16Zock JP, Plana E, Jarvis D, Anto JM, Kromhout H, Kennedy SM et al. The use of household cleaning sprays and adult asthma: an international longitudinal study. Am J Respir Crit Care Med 2007; 176: 735–741. [DOI] [PMC free article] [PubMed] [Google Scholar]
- 17Bernard A, Carbonnelle S, Nickmilder M. de Burbure C. Non-invasive biomarkers of pulmonary damage and inflammation: application to children exposed to ozone and trichloramine. Toxicol Appl Pharmacol 2005; 206: 185–190. [DOI] [PubMed] [Google Scholar]
- 18Miller JD, Sun M, Gilyan A, Roy J, Rand TG. Inflammation-associated gene transcription and expression in mouse lungs induced by low molecular weight compounds from fungi from the built environment. Chem Biol Interact 2010; 183: 113–124. [DOI] [PubMed] [Google Scholar]
- 19Belanger K, Gent JF, Triche EW, Bracken MB, Leaderer BP. Association of indoor nitrogen dioxide exposure with respiratory symptoms in children with asthma. Am J Respir Crit Care Med 2006; 173: 297–303. [DOI] [PMC free article] [PubMed] [Google Scholar]
- 20Bornehag CG, Moniruzzaman S, Larsson M, Lindstrom CB, Hasselgren M, Bodin A et al. The SELMA study: a birth cohort study in Sweden following more than 2000 mother-child pairs. Paediatr Perinat Epidemiol 2012; 26: 456–467. [DOI] [PubMed] [Google Scholar]
- 21U.S. Department of Health and Human Services. The Health Consequences of Involuntary Exposure to Tobacco Smoke: A Report of the Surgeon General 2006. [PubMed]
- 22Phipatanakul W. Environmental factors and childhood asthma. Pediatr Ann 2006; 35: 646–656. [PubMed] [Google Scholar]
- 23Larsson M, Hagerhed-Engman L, Kolarik B, James P, Lundin F, Janson S et al. PVC—as flooring material—and its association with incident asthma in a Swedish child cohort study. Indoor Air 2010; 20: 494–501. [DOI] [PubMed] [Google Scholar]
- 24Miranda ML, Galeano MA, Hale B, Thomann WR. Crawl spaces as reservoirs for transmission of mold to the livable part of the home environment. Rev Environ Health 2011; 26: 205–213. [DOI] [PubMed] [Google Scholar]
- 25Parat S, Fricker-Hidalgo H, Perdrix A, Bemer D, Pelissier N, Grillot R. Airborne fungal contamination in air-conditioning systems: effect of filtering and humidifying devices. Am Ind Hyg Assoc J 1996; 57: 996–1001. [Google Scholar]
- 26Janssen NA, Schwartz J, Zanobetti A, Suh HH. Air conditioning and source-specific particles as modifiers of the effect of PM(10) on hospital admissions for heart and lung disease. Environ Health Perspect 2002; 110: 43–49. [DOI] [PMC free article] [PubMed] [Google Scholar]
- 27Dillon HK, Heinsohn PA, Miller JD (eds). Field guide for the determination of biological contaminants in environmental samples, 2nd edn, AIHA Press: Fairfax Virginia. 2005. [Google Scholar]
- 28Ferro AR, Kopperud RJ, Hildemann LM. Elevated personal exposure to particulate matter from human activities in a residence. J Expo Anal Environ Epidemiol 2004; 14 (Suppl 1): S34–S40. [DOI] [PubMed] [Google Scholar]
- 29Durand KT, Muilenberg ML, Burge HA, Seixas NS. Effect of sampling time on the culturability of airborne fungi and bacteria sampled by filtration. Ann Occup Hyg 2002; 46: 113–118. [DOI] [PubMed] [Google Scholar]
- 30Morris KJ. Modern microscopic methods of bioaerosol analysis. In: Cox CS, Wathes CM (eds). Bioaerosols handbook Boca Raton. CRC Press: Florida. 1995. pp 285–316. [Google Scholar]
- 31Foto M, Vrijmoed LL, Miller JD, Ruest K, Lawton M, Dales RE. A comparison of airborne ergosterol, glucan and Air-O-Cell data in relation to physical assessments of mold damage and some other parameters. Indoor Air 2005; 15: 257–266. [DOI] [PubMed] [Google Scholar]
- 32Dales RE, Miller D, McMullen E. Indoor air quality and health: validity and determinants of reported home dampness and moulds. Int J Epidemiol 1997; 26: 120–125. [DOI] [PubMed] [Google Scholar]
- 33Haverinen-Shaughnessy U, Hyvärinen A, Pekkanen J, Nevalainen A, Husman T, Korppi M et al. Occurrence and characteristics of moisture damage in residential buildings as a function of occupant and engineer observations. Indoor Built Environ 2005; 14: 133–140. [Google Scholar]
- 34Wheeler AJ, Wong SL, Khouri C, Zhu J. Predictors of indoor BTEX concentrations in Canadian residences. Health Rep 2013; 24: 11–17. [PubMed] [Google Scholar]
- 35Zielinska B, Fujita E, Ollison W, Campbell D, Sagebiel J, Merritt P et al. Relationships of attached garage and home exposures to fuel type and emission levels of garage sources. Air Qual Atmos Health 2012; 5: 89–100. [Google Scholar]
- 36Bernard A, Carbonnelle S, de Burbure C, Michel O, Nickmilder M. Chlorinated pool attendance, atopy, and the risk of asthma during childhood. Environ Health Perspect 2006; 114: 1567–1573. [DOI] [PMC free article] [PubMed] [Google Scholar]
- 37Bernard A, Carbonnelle S, Dumont X, Nickmilder M. Infant swimming practice, pulmonary epithelium integrity, and the risk of allergic and respiratory diseases later in childhood. Pediatrics 2007; 119: 1095–1103. [DOI] [PubMed] [Google Scholar]
- 38Weisel CP, Richardson SD, Nemery B, Aggazzotti G, Baraldi E, Blatchley ER, 3rd et al. Childhood asthma and environmental exposures at swimming pools: state of the science and research recommendations. Environ Health Perspect 2009; 117: 500–507. [DOI] [PMC free article] [PubMed] [Google Scholar]
- 39Heinrich J. Influence of indoor factors in dwellings on the development of childhood asthma. Int J Hyg Environ Health 2011; 214: 1–25. [DOI] [PubMed] [Google Scholar]
- 40Tagiyeva N, Anua SM, Semple S, Dick F, Devereux G. The 'take home' burden of workplace sensitizers: flour contamination in bakers' families. Environ Int 2012; 46: 44–49. [DOI] [PubMed] [Google Scholar]
- 41Strong LL, Thompson B, Koepsell TD, Meischke H, Coronado GD. Reducing the take-home pathway of pesticide exposure: behavioral outcomes from the Para Ninos Saludables study. J Occup Environ Med 2009; 51: 922–933. [DOI] [PMC free article] [PubMed] [Google Scholar]
- 42Statistics Canada. North American Industry Classification System (NAICS) 2007. 2012; Available at: http://www.statcan.gc.ca/subjects-sujets/standard-norme/naics-scian/2007/list-liste-eng.htm. (accessed 5 June 2013).
- 43Hoek G, Beelen R, de Hoogh K, Vienneau D, Gulliver J, Fischer P et al. A review of land-use regression models to assess spatial variation of outdoor air pollution. Atmos Environ 2008; 42: 7561–7578. [Google Scholar]
- 44Jerrett M, Arain MA, Kanaroglou P, Beckerman B, Crouse D, Gilbert NL et al. Modeling the intraurban variability of ambient traffic pollution in Toronto, Canada. J Toxicol Environ Health A 2007; 70: 200–212. [DOI] [PubMed] [Google Scholar]
- 45Allen RW, Amram O, Wheeler AJ, Brauer M. The transferability of NO and NO2 land use regression models between cities and pollutants. Atmos Environ 2011; 45: 369–378. [Google Scholar]
- 46Henderson SB, Beckerman B, Jerrett M, Brauer M. Application of land use regression to estimate long-term concentrations of traffic-related nitrogen oxides and fine particulate matter. Environ Sci Technol 2007; 41: 2422–2428. [DOI] [PubMed] [Google Scholar]
- 47Wang R, Henderson SB, Sbihi H, Allen RW, Brauer M. Temporal stability of land use regression models for traffic-related air pollution. Atmos Environ 2013; 64: 312–319. [Google Scholar]
- 48Brook JR, Levy I, Mihele C. From near-road to urban background: lessons learned from mobile lab monitoring. Air Waste Manage Assoc EM Magazine 2013; 63: 12–16. [Google Scholar]
- 49Sbihi H, Allen RW, Becker AB, Brook JR, Mandhane PJ, Scott JA et al. Perinatal exposure to traffic-related air pollution and development of atopy in a Canadian birth cohort study. Environ Health Perspect 2014. (in final revision). [DOI] [PMC free article] [PubMed]
- 50Kaur S, Nieuwenhuijsen MJ. Determinants of personal exposure to PM2.5, ultrafine particle counts, and CO in a transport microenvironment. Environ Sci Technol 2009; 43: 4737–4743. [DOI] [PubMed] [Google Scholar]
- 51Zuurbier M, Hoek G, Oldenwening M, Lenters V, Meliefste K, van den Hazel P et al. Commuters' exposure to particulate matter air pollution is affected by mode of transport, fuel type, and route. Environ Health Perspect 2010; 118: 783–789. [DOI] [PMC free article] [PubMed] [Google Scholar]
- 52Bisgaard H, Bonnelykke K. Long-term studies of the natural history of asthma in childhood. J Allergy Clin Immunol 2010; 126: 187–197. [DOI] [PubMed] [Google Scholar]
- 53Physick W, Powell J, Cope M, Boast K, Lee S. Measurements of personal exposure to NO2 and modelling using ambient concentrations and activity data. Atmos Environ 2011; 45: 2095–2102. [Google Scholar]
- 54Van Ryswyk K, Wheeler AJ, Wallace L, Kearney J, You H, Kulka R et al. Impact of microenvironments and personal activities on personal PM2.5 exposures among asthmatic children. J Expo Sci Environ Epidemiol 2014; 24: 260–268. [DOI] [PubMed] [Google Scholar]
- 55Nethery E, Leckie SE, Teschke K, Brauer M. From measures to models: an evaluation of air pollution exposure assessment for epidemiological studies of pregnant women. Occup Environ Med 2008; 65: 579–586. [DOI] [PubMed] [Google Scholar]
- 56Setton E, Marshall JD, Brauer M, Lundquist KR, Hystad P, Keller P et al. The impact of daily mobility on exposure to traffic-related air pollution and health effect estimates. J Expo Sci Environ Epidemiol 2011; 21: 42–48. [DOI] [PubMed] [Google Scholar]
- 57Allen RW, Adar SD, Avol E, Cohen M, Curl CL, Larson T et al. Modeling the residential infiltration of outdoor PM(2.5) in the Multi-Ethnic Study of Atherosclerosis and Air Pollution (MESA Air). Environ Health Perspect 2012; 120: 824–830. [DOI] [PMC free article] [PubMed] [Google Scholar]
- 58Miller JD, Laflamme AM, Sobol Y, Lafontaine P, Greenhalgh R. Fungi and fungal products in some Canadian houses. Int Biodeter 1988; 24: 103–120. [Google Scholar]
- 59Elliott L, Arbes SJ, Harvey ES, Lee RC, Salo PM, Cohn RD et al. Dust weight and asthma prevalence in the National Survey of Lead and Allergens in Housing (NSLAH). Environ Health Perspect 2007; 115: 215–220. [DOI] [PMC free article] [PubMed] [Google Scholar]
- 60Macher JM. Review of methods to collect settled dust and isolate culturable microorganisms. Indoor Air 2001; 11: 99–110. [DOI] [PubMed] [Google Scholar]
- 61Liu C, Shi S, Weschler C, Zhao B, Zhang Y. Analysis of the dynamic interaction between SVOCs and airborne particles. Aerosol Sci Technol 2013; 47: 125–136. [Google Scholar]
- 62Ferro AR, Kopperud RJ, Hildemann LM. Source strengths for indoor human activities that resuspend particulate matter. Environ Sci Technol 2004; 38: 1759–1764. [DOI] [PubMed] [Google Scholar]
- 63Beko G, Weschler CJ, Langer S, Callesen M, Toftum J, Clausen G. Children's phthalate intakes and resultant cumulative exposures estimated from urine compared with estimates from dust ingestion, inhalation and dermal absorption in their homes and daycare centers. PLoS One 2013; 8: e62442. [DOI] [PMC free article] [PubMed] [Google Scholar]
- 64Sanitaire. MODEL S3686. 2012; Available at http://www.sanitairevac.com/professional/products/canister/s3686.jsp. (accessed 13 May 2013).
- 65Hyvarinen A, Roponen M, Tiittanen P, Laitinen S, Nevalainen A, Pekkanen J. Dust sampling methods for endotoxin - an essential, but underestimated issue. Indoor Air 2006; 16: 20–27. [DOI] [PubMed] [Google Scholar]
- 66Michel O. Systemic and local airways inflammatory response to endotoxin. Toxicology 2000; 152: 25–30. [DOI] [PubMed] [Google Scholar]
- 67Larsson L, Szponar B, Pehrson C. Tobacco smoking increases dramatically air concentrations of endotoxin. Indoor Air 2004; 14: 421–424. [DOI] [PubMed] [Google Scholar]
- 68Sebastian A, Pehrson C, Larsson L. Elevated concentrations of endotoxin in indoor air due to cigarette smoking. J Environ Monit 2006; 8: 519–522. [DOI] [PubMed] [Google Scholar]
- 69Gereda JE, Klinnert MD, Price MR, Leung DY, Liu AH. Metropolitan home living conditions associated with indoor endotoxin levels. J Allergy Clin Immunol 2001; 107: 790–796. [DOI] [PubMed] [Google Scholar]
- 70Heinrich J, Holscher B, Douwes J, Richter K, Koch A, Bischof W et al. Reproducibility of allergen, endotoxin and fungi measurements in the indoor environment. J Expo Anal Environ Epidemiol 2003; 13: 152–160. [DOI] [PubMed] [Google Scholar]
- 71Phipatanakul W, Celedon JC, Sredl DL, Weiss ST, Gold DR. Mouse exposure and wheeze in the first year of life. Ann Allergy Asthma Immunol 2005; 94: 593–599. [DOI] [PMC free article] [PubMed] [Google Scholar]
- 72Waser M, Schierl R, von Mutius E, Maisch S, Carr D, Riedler J et al. Determinants of endotoxin levels in living environments of farmers' children and their peers from rural areas. Clin Exp Allergy 2004; 34: 389–397. [DOI] [PubMed] [Google Scholar]
- 73Maertens RM, Bailey J, White PA. The mutagenic hazards of settled house dust: a review. Mutat Res 2004; 567: 401–425. [DOI] [PubMed] [Google Scholar]
- 74Mahler BJ, Metre PC, Wilson JT, Musgrove M, Burbank TL, Ennis TE et al. Coal-tar-based parking lot sealcoat: an unrecognized source of PAH to settled house dust. Environ Sci Technol 2010; 44: 894–900. [DOI] [PMC free article] [PubMed] [Google Scholar]
- 75Heudorf U, Mersch-Sundermann V, Angerer J. Phthalates: toxicology and exposure. Int J Hyg Environ Health 2007; 210: 623–634. [DOI] [PubMed] [Google Scholar]
- 76Jedrychowski WA, Perera FP, Maugeri U, Mrozek-Budzyn D, Mroz E, Klimaszewska-Rembiasz M et al. Intrauterine exposure to polycyclic aromatic hydrocarbons, fine particulate matter and early wheeze. Prospective birth cohort study in 4-year olds. Pediatr Allergy Immunol 2010; 21 (4 Pt 2): e723–e732. [DOI] [PMC free article] [PubMed] [Google Scholar]
- 77Jung KH, Yan B, Moors K, Chillrud SN, Perzanowski MS, Whyatt RM et al. Repeated exposure to polycyclic aromatic hydrocarbons and asthma: effect of seroatopy. Ann Allergy Asthma Immunol 2012; 109: 249–254. [DOI] [PMC free article] [PubMed] [Google Scholar]
- 78Brook JR, Graham L, Charland JP, Cheng Y, Fan X, Lu G et al. Investigation of the motor vehicle exhaust contribution to primary fine particle organic carbon in urban air. Atmos Environ 2007; 41: 119–135. [Google Scholar]
- 79Sbihi H, Brook JR, Allen RW, Curran JH, Dell S, Mandhane P et al. A new exposure metric for traffic-related air pollution? An analysis of determinants of hopanes in settled indoor house dust. Environ Health 2013; 12: 48–59. [DOI] [PMC free article] [PubMed] [Google Scholar]
- 80Moraes TJ, Lefebvre DL, Chooniedass R, Becker AB, Brook JR, Denburg J et al. The Canadian Healthy Infant Longitudinal Development (CHILD) birth cohort study: Biological samples and biobanking. Paediatr Perinat Epidemiol 2014; 29: 84–92. [DOI] [PubMed] [Google Scholar]
- 81Wild CP. The exposome: from concept to utility. Int J Epidemiol 2012; 41: 24–32. [DOI] [PubMed] [Google Scholar]
- 82Shu H, Allen RW, Zeng L, Lanphear BP, Bornehag CG, Brauer M et al. Potential sources of phthalate exposure in three month old infants identified though the Canadian Healthy Infant Longitudinal Development Study. Environ Health Perspect 2014. (in review).
- 83Kato K, Silva MJ, Needham LL, Calafat AM. Determination of 16 phthalate metabolites in urine using automated sample preparation and on-line preconcentration/high-performance liquid chromatography/tandem mass spectrometry. Anal Chem 2005; 77: 2985–2991. [DOI] [PubMed] [Google Scholar]
- 84Whitney CW, Lind BK, Wahl PW. Quality assurance and quality control in longitudinal studies. Epidemiol Rev 1998; 20: 71–80. [DOI] [PubMed] [Google Scholar]
- 85Brook JR, Dann TF, Galarneau E, Herod D, Charland JP. The State of Air Quality in Canada: National Patterns. In: Taylor E, McMillan A (eds). Air Quality Management: Canadian Perspectives on a Global Issue Dordrecht. Springer: Netherlands. 2014. pp 43–67. [Google Scholar]
- 86Sears MR, Greene JM, Willan AR, Wiecek EM, Taylor DR, Flannery EM et al. A longitudinal, population-based, cohort study of childhood asthma followed to adulthood. N Engl J Med 2003; 349: 1414–1422. [DOI] [PubMed] [Google Scholar]
- 87Lowe L, Murray CS, Custovic A, Simpson BM, Kissen PM, Woodcock A et al. Specific airway resistance in 3-year-old children: a prospective cohort study. Lancet 2002; 359: 1904–1908. [DOI] [PubMed] [Google Scholar]
- 88Gern JE, Visness CM, Gergen PJ, Wood RA, Bloomberg GR, O'Connor GT et al. The Urban Environment and Childhood Asthma (URECA) birth cohort study: design, methods, and study population. BMC Pulm Med 2009; 9: 17–32. [DOI] [PMC free article] [PubMed] [Google Scholar]
- 89Vrijheid M, Casas M, Bergstrom A, Carmichael A, Cordier S, Eggesbo M et al. European birth cohorts for environmental health research. Environ Health Perspect 2012; 120: 29–37. [DOI] [PMC free article] [PubMed] [Google Scholar]
- 90Brunekreef B, Smit J, de Jongste J, Neijens H, Gerritsen J, Postma D et al. The prevention and incidence of asthma and mite allergy (PIAMA) birth cohort study: design and first results. Pediatr Allergy Immunol 2002; 13 (Suppl 15): 55–60. [DOI] [PubMed] [Google Scholar]
- 91Wickman M, Kull I, Pershagen G, Nordvall SL. The BAMSE project: presentation of a prospective longitudinal birth cohort study. Pediatr Allergy Immunol 2002; 13 (Suppl 15): 11–13. [DOI] [PubMed] [Google Scholar]
- 92Fraser A, Macdonald-Wallis C, Tilling K, Boyd A, Golding J, Smith GD et al. Cohort Profile: The Avon Longitudinal Study of Parents and Children: ALSPAC mothers cohort. Int J Epidemiol 2013; 42: 97–110. [DOI] [PMC free article] [PubMed] [Google Scholar]
- 93Subbarao P, Becker A, Brook JR, Daley D, Mandhane PJ, Miller GE et al. Epidemiology of asthma: risk factors for development. Expert Rev Clin Immunol 2009; 5: 77–95. [DOI] [PubMed] [Google Scholar]
- 94Portnoy JM, Barnes CS, Kennedy K. Sampling for indoor fungi. J Allergy Clin Immunol 2004; 113: 189–198. [DOI] [PubMed] [Google Scholar]
- 95Ren P, Jankun TM, Belanger K, Bracken MB, Leaderer BP. The relation between fungal propagules in indoor air and home characteristics. Allergy 2001; 56: 419–424. [DOI] [PubMed] [Google Scholar]
- 96Lioy PJ, Freeman NC, Millette JR. Dust: a metric for use in residential and building exposure assessment and source characterization. Environ Health Perspect 2002; 110: 969–983. [DOI] [PMC free article] [PubMed] [Google Scholar]
- 97Egeghy PP, Quackenboss JJ, Catlin S, Ryan PB. Determinants of temporal variability in NHEXAS-Maryland environmental concentrations, exposures, and biomarkers. J Expo Anal Environ Epidemiol 2005; 15: 388–397. [DOI] [PubMed] [Google Scholar]
- 98Hastie T, Tibshirani R, Friedman JH. The Elements of Statistical Learning. Springer: Stanford, CA, USA. 2009. [Google Scholar]
- 99McLaughlan GJ. Finite Mixture Models. Wiley: New York. 2000. [Google Scholar]
- 100Tibshirani R. Regression shrinkage and selection via the Lasso. J Royal Statistical Society. Series B (Methodological) 1996; 58: 267–288. [Google Scholar]
- 101Takaro TK, Miller G, Shu H, McLean K, Kollmann TR, Fortuno ES, III et al. Peri-natal environmental exposures and IL-6 measured in cord blood: early expression of the hygiene hypothesis? Am J Respir Crit Care Med 2012; 185: A2221. [Google Scholar]
- 102Takaro TK, McLean K, Brook JR, Allen RW, Scott JA, Turvey S et al. Environmental exposures and wheeze at three and twelve months of age in the Canadian Healthy Infant Longitudinal Development Study. Am J Respir Crit Care Med 2014; 189: A3848. [Google Scholar]
- 103Takaro TK, Krieger JW, Song L, Beaudet N. Effect of environmental interventions to reduce asthma triggers in homes of low-income children in Seattle. J Expo Anal Environ Epidemiol 2004; 14 (Suppl 1): S133–S143. [DOI] [PubMed] [Google Scholar]
- 104ASTM Standard D5438Standard Practice for Collection of Dust from carpeted Floors for Chemical Analysis. ASTM International: West Conshohocken, PA.. 1994. [Google Scholar]
- 105Langer S, Weschler CJ, Fischer A, Bekö G, Toftum J, Clausen G. Phthalate and PAH concentrations in dust collected from Danish homes and daycare centers. Atmos Environ 2010; 44: 2294–2301. [Google Scholar]
- 106Graham LA, Tong A, Poole G, Ding L, Ke F, Wang D et al. A comparison of direct thermal desorption with solvent extraction for gas chromatography-mass spectrometry analysis of semivolatile organic compounds in diesel particulate matter. Int J Environ Anal Chem 2010; 90: 511–534. [Google Scholar]
Associated Data
This section collects any data citations, data availability statements, or supplementary materials included in this article.