Abstract
AIM: In human sepsis, a prominent component of the hypermetabolite is impaired glucose tolerance (IGT) and hyperglycemia. Elevations in plasma glucose concentration impair immune function by altering cytokine production from macrophages. We assessed the role of glucose in the regulation of circulating levels of insulin, glucagon, cortisol, IL-6 and TNF-α in human sepsis with normal or impaired glucose tolerance.
METHODS: According to the results of intravenous glucose tolerance test, forty patients were classified into two groups: control group (n = 20) and IGT group (n = 20). Plasma glucose levels were acutely raised in two groups and maintained at 15 mmol/L for 3 hours. Plasma insulin, glucagon and cortisol levels were measured by radioimmunoassay, the levels of TNF-α and IL-6 were detected by ELISA.
RESULTS: In IGT group, the fasting concentrations of plasma glucose, insulin, glucagon, cortisol, IL-6 and TNF-α levels were significantly higher than those in control group (P < 0.05). During clamp, the control group had a higher average amount of dextrose infusion than the IGT group (P < 0.01). In control group, plasma insulin levels rose from a basal value to a peak at an hour (P < 0.05) and maintained at high levels. Plasma glucagon levels descended from a basal value to the lowest level within an hour (P < 0.01) and low levels were maintained throughout the clamp. In IGT group, plasma insulin was more significantly elevated (P < 0.01), and plasma glucagon levels were not significantly declined. Plasma cortisol levels were not significantly changed in two groups. In control group, plasma IL-6 and TNF-α levels rose (P < 0.01) within 2 hours of the clamp and returned to basal values at 3 hours. In IGT group, increased levels of plasma cytokine lasted longer than in control group (3 hours vs. 2 hours, P < 0.05), and the cytokine peaks of IGT group were higher (P < 0.05) than those of control group.
CONCLUSION: Acute hyperglycemia pricks up hyperinsulinemia and increases circulating cytokine concentrations and these effects are more pronounced in sepsis with IGT. This suggests a potential modulation of immunoinflammatory responses in human sepsis by hyperglycemia.
INTRODUCTION
Severe human sepsis is associated with hypermetabolic stress response, and affects protein, carbohydrate and lipid metabolism throughout the body[1-7]. A prominent component of hypermetabolic stress response is hyperglycemia and impaired glucose tolerance (IGT). The mechanisms of stress hyperglycemia are well known[8]. Counterreglulatory hormone and excess cytokine result in insulin resistance, and many hospitalized patients are insulin deficient for a variety of reasons (e.g. old age, pancreatitis, hypothermia, hypoxemia). Excess dextrose infusion is an often-overlooked contributor to hyperglycemia[9].
The harm of acute hyperglycemia in stress response patients has been demonstrated in several clinical and experimental conditions[10-12]. An increased susceptibility to infections in the presence of hyperglycemia has long been known in patients with diabetes[10,11,13]. And recent investigations have demonstrated that elevations in plasma glucose concentration impair immune function by altering cytokine production from macrophages, diminishing lymphocyte proliferation, and depressing intracellular bactericidal activity of leukocytes[14-17]. Furthermore, in the issue of circulation, Esposito K. argued hyperglycemia acutely increased circulating cytokine concentrations, and this effect was more pronounced in group with IGT[18]. But former researches focused on normal human being, diabetes or critically ill patients, etc. and rarely concentrated on severe human sepsis.
The present study was to test whether circulating levels of hormones and cytokines are regulated by glucose levels in sepsis, and to measure serum insulin, glucagon, cortisol, TNF-α, and IL-6 concentrations during acute hyperglycemia in septic patients with normal or impaired glucose tolerance (IGT).
MATERIALS AND METHODS
Subjects
The subjects of this study were the patients admitted from January 5 to November 1, 2002 to the medical SICU of Jinling Hospital in Nanjing. Forty patients (23 men, 17 women) with a mean (s.d.) age of 52.2 (15.6) years with abdominal or pelvic sepsis were studied. Patients with diabetes mellitus, trauma, human immunodeficiency virus disease, end-stage renal disease, end-stage hepatic disease, the patients receiving immunosuppressive agents were excluded. Forty patients were divided into two groups according to normal (control group, n = 20) or impaired (IGT group, n = 20) glucose tolerance (Table 1). The patients’ glucose tolerance was assessed by intravenous glucose tolerance test (IVGTT). After an overnight fast each patient underwent IVGTT: a 50% glucose solution (glucose 0.5 gm/kg of body weight) was injected into the femoral vein for 2 minutes. Patients in IGT group had a 2-hour plasma glucose value between 7.7 mmol/L and 11 mmol/L, and the control group had normal glucose tolerance (2-hour plasma glucose value below 7.7 mmol/L). Informed consent was obtained from all participating patients or their surrogates.
Table 1.
Details of control and IGT groups
| Variable | Control group (n = 20) | IGT subject (n = 20) |
| Age, y | 41 ± 4 | 42 ± 6 |
| Sex, M/F, n | 13 / 7 | 12 / 8 |
| Body mass index, kg/m2 | 21.11 ± 1.22 | 20.12 ± 1.43 |
| Plasma glucose, mmol/L | 5.22 ± 0.89 | 7.23 ± 0.73a |
| Plasma insulin, pmol/L | 72.00 ± 14.83 | 82.95 ± 10.23a |
| Plasma glucagon, pmol/L | 80.75 ± 12.98 | 90.90 ± 15.54a |
| Plasma cortisol, mmol/L | 0.68 ± 0.11 | 0.79 ± 0.12b |
| IL-6, pg/ml | 3.18 ± 0.64 | 3.63 ± 0.43a |
| TNF-α, pg/ml | 4.66 ± 0.70 | 5.99 ± 0.76b |
| APACHE ‖ score | 7(4 - 10) | 10(7 - 15)a |
| Sepsis score | 10(8 - 16) | 15(10 - 25)a |
All data were the mean (s.d.), except APACHE‖ score and sepsis score which were the median (range). APACHE, acute physiology and chronic health evaluation.
P < 0.05 vs. control group.
P < 0.01 vs control group.
Severity of sepsis and underlying diagnosis
Sepsis was defined by the American College of Chest Physicians-Society of Critical Care Medicine consensus statement by an identifiable site of infection and evidence of a systemic inflammatory response manifested by at least three of the following criteria: (1) temperature, > 38 °C or < 36 °C; (2) heart rate, > 90 beats per minute; (3) respiratory rate, > 20 breaths per minute; (4) white blood cell count, > 12000/mm3 or < 4000/mm3[19]. Patients meeting enrollment criteria were entered within 24 h. The cause of sepsis was severe acute pancreatitis (n = 11), colorectal anastomotic dehiscence (n = 9), perforated diverticular disease (n = 9), gastroduodenal perforation (n = 7), gallbladder perforation (n = 3) and spontaneous splenic abscess (n = 1). Sepsis severity was scored using the method of Elebute and Stoner[20]. This scoring procedure takes into account the site of infection, bacteriology, body temperature, secondary effects (e.g. jaundice) and various haematological and biochemical variables, such as white cell count and plasma albumin concentration.
Study protocol
After 12-hour fast overnight, the patients were placed in a supine comfortable position with the sickroom temperature between 20 °C and 24 °C. Intravenous lines were inserted into a large antecubital vein of one arm for infusions and into a dorsal vein of the contralateral arm for blood sampling. Patency was preserved in a slow saline infusion (0.9% NaCl). After withdrawal of baseline blood samples, plasma glucose concentrations were acutely raised with a bolus injection of 0.25 g/kg glucose followed by a varying 30% glucose infusion to achieve steady-state plasma glucose concentrations of about 15 mmol/L for 180 minutes.
Analysis
Samples for analysis of plasma glucose were collected in tubes containing a trace of sodium fluoride. Plasma glucose was determined according to the glucose oxidase method with an autoanalyzer (Beckman Instruments). Serum samples for measuring hormone and cytokine level were stored at -80 °C until assay. Commercially available kits were used for radioimmunoassay of plasma insulin, glucagon and cortisol concentrations. Serum concentrations of TNF-α, IL-6 were determined in duplicate with commercially available kits (R&D Systems). Dilution curves of serum samples were parallel to those of standard. Intra-assay and interassay coefficients of variation were 3.8% and 5.8% for TNF-α, 2.8% and 3.3% for IL-6.
Statistical analysis
Results were given as mean ± SD. One-way ANOVA was used to compare baseline data, followed by Scheffé’s test for pairwise comparisons. Multiple comparison tests were made with ANOVA, followed by post hoc analysis (Student-Newman-Keuls test) to locate the significant difference indicated by ANOVA. A value of P < 0.05 was considered statistically significant. Data were analysed using Statistical Package for the Social Sciences computer software (SPSS 11.0).
RESULTS
During the 7-month study period 46 patients were collected, however analysis was limited to 40 patients with complete and available data. IGT group had higher admission severity scores than control group (APACHE‖, 10 (7-15) vs. 7 (4-10), sepsis score, 13 (8-19) vs. 8 (6-13); P < 0.05). In IGT group, the levels of fasting plasma glucose, insulin, glucagon, cortisol, IL-6 and TNF-α levels were significantly higher than those in control group (Table 1). During the clamp, plasma glucose became stabilized at 15 mmol/L with oscillations not exceeding 5% of the prefixed value. The control group had a higher average amount of dextrose infusion than IGT group (0.68 ± 0.31 g/kg vs. 0.42 ± 0.16 g/kg; P < 0.01).
Counterregulatory hormone
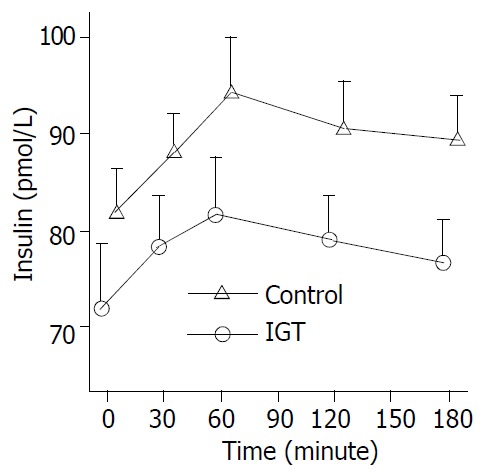
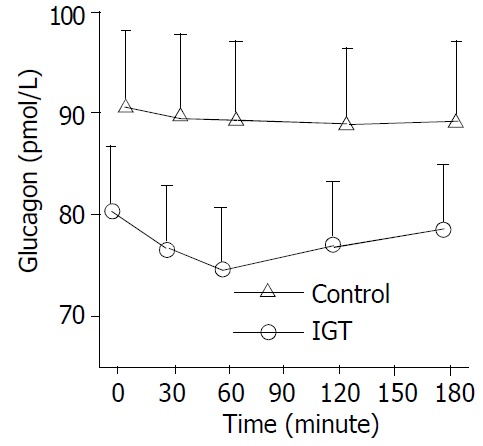
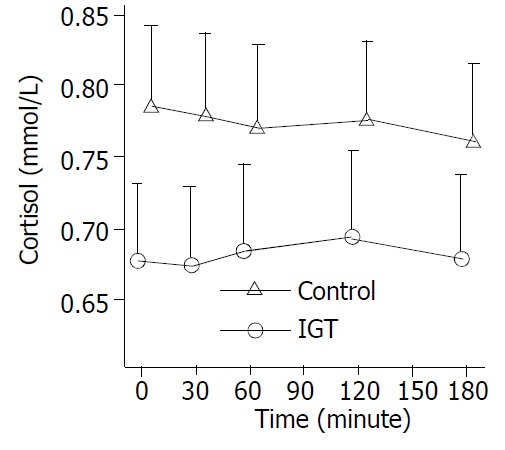
During the clamp, plasma insulin levels increased from a basal level of 72.00 ± 14.83 pmol/L to a peak of 83.40 ± 14.29pmol/L within one hour (P < 0.05) and maintained at high levels in control group. Whereas, plasma insulin levels increased more significantly in IGT group (P < 0.01) (Figure 1). In control group, plasma glucagon levels decreased from a basal value of 80.75 ± 12.98 pmol/L to the lowest level of 74.70 ± 11.40 pmol/L within an hour (P < 0.01) and low levels maintained, and was not significantly declined in IGT group during the entire observation period (Figure 2). Plasma cortisol was not significantly changed in two groups (Figure 3).
Figure 1.

Circulation insulin levels during hyperglycemia clamps in 20 patients of control group (○-○) and in 20 pa-tients of IGT group (△-△). Mean ± S.E.M. in human sepsis. Plasma insulin levels rose from a basal value to a peak within an hour (P < 0.01) and high levels maintained in two groups.
Figure 2.

Circulation glucagon levels during hyperglycemia clamps in 20 patients of control group (○-○) and in 20 pa-tients of IGT group (△-△). Mean ± S.E.M. in human sepsis. In control group, plasma glucagon levels decreased from a basal value to the lowest level within half an hour (P < 0.01) and a low level maintained, and was not significantly declined in IGT group in the entire observation period.
Figure 3.

Circulation cortisol levels during hyperglycemia clamps in 20 patients of control group (○-○) and in 20 pa-tients of IGT group (△-△). Mean ± S.E.M. in human sepsis. There were no significant changes in two groups.
Inflammatory cytokine
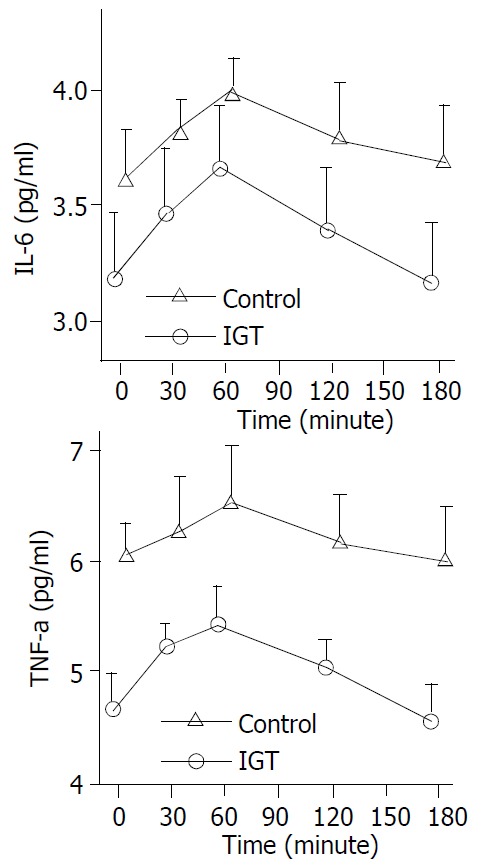
In control group, plasma IL-6 levels increased from a basal value of 3.18 ± 0.64 pg/mL to a peak of 3.67 ± 0.57 pg/mL within 1 hour (P < 0.01) and returned to basal level at 3 hours. Fasting plasma TNF-α levels were 4.66 ± 0.70 pg/mL, they peaked at 1 hour (5.4 ± 0.64 pg/mL, P < 0.01), and returned to baseline at 3 hours. In IGT group, increased levels of plasma cytokine during the clamp lasted longer than in control group (3 hours vs. 2 hours; P < 0.05) (Figure 4).
Figure 4.

Circulation IL-6, TNF-α levels during hyperglyce-mia clamps in 20 patients of control group (○-○) and in 20 patients of IGT group (△-△). Mean ± S.E.M. in human sepsis. In two groups, plasma IL-6, TNF-α levels rose from a basal value to a peak within 1 hour (P < 0.01). In IGT group, increased level of plasma TNF-α, IL-6 during the clamping lasted longer than in control group (3 hours vs. 2 hours; P < 0.05).
DISCUSSION
In this study, we found that IGT group had higher admission severity scores than control group, and had high plasma concentrations of counterregulatory hormones and inflammatory cytokines. During the clamp, IGT group had a less average amount of dextrose infusion than control group. In IGT patients, a short term of hyperglycemia after glucose infusion failed to adjust the plasma concentration of counterregulatory hormones to maintain glucose homeostasis. Acute hyperglycemia in control and in IGT patients induced an increase in plasma IL-6, TNF-α concentrations and insulin levels, and the effect was amplified by IGT group. These results indicate that hyperglycemia in human sepsis with IGT is more easy to be revoked, and plays a potential modulation role in immunoinflammatory responses.
The mechanisms for “stress IGT” are well known. Human sepsis is accompanied by a marked increase in plasma concentration of counterregulatory hormones, i.e. glucagons, epinephrine, cortisol and growth hormone that affect glucose homeostasis. These hormones can lead to significant reductions in insulin sensitivity through poorly understood mechanisms likely related to alterations in insulin signal pathway[21]. Counterregulatory hormones also enhance lipolysis and level of free fatty acids (FFA) which may contribute additional defects to the defective insulin action. Cytokine, TNF-α and IL-6 may exert their influence indirectly by stimulating counterregulatory hormone secretion and by direct action themselves[22-24]. TNF- α and IL -6 individually and synergistically increase net glucose flux through resistance to insulin actions in muscle and liver via poorly understood post-receptor mechanisms[25]. Hepatic insulin resistance leads to ongoing glucose production even in hyperglycemia[26]. Peripheral insulin resistance decreases sketetal muscle glucose uptake and reduces glucose clearance, which leads to the development of IGT and even hyperglycemia.
After glucose infusion, in normal group, glucagon and glucose concentrations reduced by host insulin were sufficient and inhibited hepatic gluconeogenesis and glycogenolysis and prevented glucose production[27]. In contrast, in IGT group, glucose infusion failed to suppress endogenous glucose production despite accompanying hyperinsulinemia. Using stable isotopes, it was demonstrated that hepatic glucose production was -150% of the normal resting post-absorptive values of healthy subjects in spite of provision of total parenteral nutrition with dextrose at rates exceeding the basal energy expenditure[28].
Glucose-based nutrition in septic patients may cause marked hyperinsulinemia due to peripheral insulin resistance[29]. Hyperinsulinemia associated with glucose-based nutrition in sepsis might augment proinflammatory cytokine production and stress response in septic patients[30]. The present findings also demonstrated that acute hyperglycemia affected concentration of plasma cytokines in human sepsis, and this effect was more pronounced in IGT patients. In vitro studies using supraphysiological glucose concentration ( > 22 mmol/l) showed an increase in TNF-α and IL-6 secretion from healthy human mononuclear cells[31]. Furthermore, increased synthesis of TNF-α has been reported both in rat uterine cells cultured in vitro with increasing concentrations of glucose[32] and in placental tissue explants from women with gestational diabetes incubated with high glucose (25 mmol/l)[33]. Human monocytes produced by IL-6 in healthy volunteers increased during 24-hour incubation in high-glucose medium[34]. These findings are in accordance with our observations in vivo, suggesting a potential modulation of immunoinflammatory response by carbohydrates.
In summary, IGT in sepsis is associated with marked changes in plasma concentrations of counterregulatory hormones and inflammatory cytokines, and these changes partially account for the fact that IGT easily develops acute hyperglycemia during glucose infusion. Acute hyperglycemia pricks up hyperinsulinemia and increases circulating cytokine concentrations. This suggests a potential role of hyperglycemia in inflammatory responses in human sepsis.
Footnotes
Supported by the Key Project of the Tenth-Five-year plan Foundation of PLA, No. 01Z011
Edited by Ren SY and Wang XL
References
- 1.Wu XN. Current concept of pathogenesis of severe acute pancreatitis. World J Gastroenterol. 2000;6:32–36. doi: 10.3748/wjg.v6.i1.32. [DOI] [PMC free article] [PubMed] [Google Scholar]
- 2.Ronco C, Bellomo R, Lonneman G. Sepsis--theory and therapies. N Engl J Med. 2003;348:1600–162; author reply 1600-162;. doi: 10.1056/NEJM200304173481616. [DOI] [PubMed] [Google Scholar]
- 3.Han DW. Intestinal endotoxemia as a pathogenetic mechanism in liver failure. World J Gastroenterol. 2002;8:961–965. doi: 10.3748/wjg.v8.i6.961. [DOI] [PMC free article] [PubMed] [Google Scholar]
- 4.Douglas RG, Shaw JH. Metabolic response to sepsis and trauma. Br J Surg. 1989;76:115–122. doi: 10.1002/bjs.1800760205. [DOI] [PubMed] [Google Scholar]
- 5.Wray CJ, Mammen JM, Hasselgren PO. Catabolic response to stress and potential benefits of nutrition support. Nutrition. 2002;18:971–977. doi: 10.1016/s0899-9007(02)00985-1. [DOI] [PubMed] [Google Scholar]
- 6.Wu XN. Treatment revisited and factors affecting prognosis of severe acute pancreatitis. World J Gastroenterol. 2000;6:633–635. doi: 10.3748/wjg.v6.i5.633. [DOI] [PMC free article] [PubMed] [Google Scholar]
- 7.Chen QP. Enteral nutrition and acute pancreatitis. World J Gastroenterol. 2001;7:185–192. doi: 10.3748/wjg.v7.i2.185. [DOI] [PMC free article] [PubMed] [Google Scholar]
- 8.Mesotten D, Van den Berghe G. Clinical potential of insulin therapy in critically ill patients. Drugs. 2003;63:625–636. doi: 10.2165/00003495-200363070-00001. [DOI] [PubMed] [Google Scholar]
- 9.Hirsch IB. In-patient hyperglycemia--are we ready to treat it yet. J Clin Endocrinol Metab. 2002;87:975–977. doi: 10.1210/jcem.87.3.8401. [DOI] [PubMed] [Google Scholar]
- 10.Beckman JA, Goldfine AB, Gordon MB, Creager MA. Ascorbate restores endothelium-dependent vasodilation impaired by acute hyperglycemia in humans. Circulation. 2001;103:1618–1623. doi: 10.1161/01.cir.103.12.1618. [DOI] [PubMed] [Google Scholar]
- 11.Mizock BA. Alterations in fuel metabolism in critical illness: hyperglycaemia. Best Pract Res Clin Endocrinol Metab. 2001;15:533–551. doi: 10.1053/beem.2001.0168. [DOI] [PubMed] [Google Scholar]
- 12.Vasa FR, Molitch ME. Endocrine problems in the chronically critically ill patient. Clin Chest Med. 2001;22:193–208. doi: 10.1016/s0272-5231(05)70034-4. [DOI] [PubMed] [Google Scholar]
- 13.Alexiewicz JM, Kumar D, Smogorzewski M, Massry SG. Elevated cytosolic calcium and impaired proliferation of B lymphocytes in type II diabetes mellitus. Am J Kidney Dis. 1997;30:98–104. doi: 10.1016/s0272-6386(97)90570-9. [DOI] [PubMed] [Google Scholar]
- 14.Losser MR, Bernard C, Beaudeux JL, Pison C, Payen D. Glucose modulates hemodynamic, metabolic, and inflammatory responses to lipopolysaccharide in rabbits. J Appl Physiol (1985) 1997;83:1566–1574. doi: 10.1152/jappl.1997.83.5.1566. [DOI] [PubMed] [Google Scholar]
- 15.Reinhold D, Ansorge S, Schleicher ED. Elevated glucose levels stimulate transforming growth factor-beta 1 (TGF-beta 1), suppress interleukin IL-2, IL-6 and IL-10 production and DNA synthesis in peripheral blood mononuclear cells. Horm Metab Res. 1996;28:267–270. doi: 10.1055/s-2007-979789. [DOI] [PubMed] [Google Scholar]
- 16.Gregory R, McElveen J, Tattersall RB, Todd I. The effects of 3-hydroxybutyrate and glucose on human T cell responses to Candida albicans. FEMS Immunol Med Microbiol. 1993;7:315–320. doi: 10.1111/j.1574-695X.1993.tb00413.x. [DOI] [PubMed] [Google Scholar]
- 17.Moises RS, Heidenreich KA. Glucose regulates the expression of Gi-proteins in cultured BC3H-1 myocytes. Biochem Biophys Res Commun. 1992;182:1193–1200. doi: 10.1016/0006-291x(92)91858-n. [DOI] [PubMed] [Google Scholar]
- 18.Esposito K, Nappo F, Marfella R, Giugliano G, Giugliano F, Ciotola M, Quagliaro L, Ceriello A, Giugliano D. Inflammatory cytokine concentrations are acutely increased by hyperglycemia in humans: role of oxidative stress. Circulation. 2002;106:2067–2072. doi: 10.1161/01.cir.0000034509.14906.ae. [DOI] [PubMed] [Google Scholar]
- 19.American College of Chest Physicians/Society of Critical Care Medicine Consensus Conference: definitions for sepsis and organ failure and guidelines for the use of innovative therapies in sepsis. Crit Care Med. 1992;20:864–874. [PubMed] [Google Scholar]
- 20.Elebute EA, Stoner HB. The grading of sepsis. Br J Surg. 1983;70:29–31. doi: 10.1002/bjs.1800700111. [DOI] [PubMed] [Google Scholar]
- 21.Shamoon H, Hendler R, Sherwin RS. Altered responsiveness to cortisol, epinephrine, and glucagon in insulin-infused juvenile-onset diabetics. A mechanism for diabetic instability. Diabetes. 1980;29:284–291. doi: 10.2337/diab.29.4.284. [DOI] [PubMed] [Google Scholar]
- 22.Zhang GL, Wang YH, Teng HL, Lin ZB. Effects of aminoguanidine on nitric oxide production induced by inflammatory cytokines and endotoxin in cultured rat hepatocytes. World J Gastroenterol. 2001;7:331–334. doi: 10.3748/wjg.v7.i3.331. [DOI] [PMC free article] [PubMed] [Google Scholar]
- 23.Webber J. Abnormalities in glucose metabolism and their relevance to nutrition support in the critically ill. Curr Opin Clin Nutr Metab Care. 1998;1:191–194. doi: 10.1097/00075197-199803000-00009. [DOI] [PubMed] [Google Scholar]
- 24.Wang P, Li N, Li JS, Li WQ. The role of endotoxin, TNF-alpha, and IL-6 in inducing the state of growth hormone insensitivity. World J Gastroenterol. 2002;8:531–536. doi: 10.3748/wjg.v8.i3.531. [DOI] [PMC free article] [PubMed] [Google Scholar]
- 25.Chang HR, Bistrian B. The role of cytokines in the catabolic consequences of infection and injury. JPEN J Parenter Enteral Nutr. 1998;22:156–166. doi: 10.1177/0148607198022003156. [DOI] [PubMed] [Google Scholar]
- 26.Wolfe RR. Substrate utilization/insulin resistance in sepsis/trauma. Baillieres Clin Endocrinol Metab. 1997;11:645–657. doi: 10.1016/s0950-351x(97)80926-3. [DOI] [PubMed] [Google Scholar]
- 27.Rizza RA, Mandarino LJ, Gerich JE. Dose-response characteristics for effects of insulin on production and utilization of glucose in man. Am J Physiol. 1981;240:E630–E639. doi: 10.1152/ajpendo.1981.240.6.E630. [DOI] [PubMed] [Google Scholar]
- 28.Tappy L, Schwarz JM, Schneiter P, Cayeux C, Revelly JP, Fagerquist CK, Jéquier E, Chioléro R. Effects of isoenergetic glucose-based or lipid-based parenteral nutrition on glucose metabolism, de novo lipogenesis, and respiratory gas exchanges in critically ill patients. Crit Care Med. 1998;26:860–867. doi: 10.1097/00003246-199805000-00018. [DOI] [PubMed] [Google Scholar]
- 29.Saeed M, Carlson GL, Little RA, Irving MH. Selective impairment of glucose storage in human sepsis. Br J Surg. 1999;86:813–821. doi: 10.1046/j.1365-2168.1999.01140.x. [DOI] [PubMed] [Google Scholar]
- 30.Soop M, Duxbury H, Agwunobi AO, Gibson JM, Hopkins SJ, Childs C, Cooper RG, Maycock P, Little RA, Carlson GL. Euglycemic hyperinsulinemia augments the cytokine and endocrine responses to endotoxin in humans. Am J Physiol Endocrinol Metab. 2002;282:E1276–E1285. doi: 10.1152/ajpendo.00535.2001. [DOI] [PubMed] [Google Scholar]
- 31.Morohoshi M, Fujisawa K, Uchimura I, Numano F. Glucose-dependent interleukin 6 and tumor necrosis factor production by human peripheral blood monocytes in vitro. Diabetes. 1996;45:954–959. doi: 10.2337/diab.45.7.954. [DOI] [PubMed] [Google Scholar]
- 32.Pampfer S, Vanderheyden I, De Hertogh R. Increased synthesis of tumor necrosis factor-alpha in uterine explants from pregnant diabetic rats and in primary cultures of uterine cells in high glucose. Diabetes. 1997;46:1214–1224. doi: 10.2337/diab.46.7.1214. [DOI] [PubMed] [Google Scholar]
- 33.Coughlan MT, Oliva K, Georgiou HM, Permezel JM, Rice GE. Glucose-induced release of tumour necrosis factor-alpha from human placental and adipose tissues in gestational diabetes mellitus. Diabet Med. 2001;18:921–927. doi: 10.1046/j.1464-5491.2001.00614.x. [DOI] [PubMed] [Google Scholar]
- 34.Morohoshi M, Fujisawa K, Uchimura I, Numano F. The effect of glucose and advanced glycosylation end products on IL-6 production by human monocytes. Ann N Y Acad Sci. 1995;748:562–570. doi: 10.1111/j.1749-6632.1994.tb17362.x. [DOI] [PubMed] [Google Scholar]


