Significance
In mammals, both T and B lymphocytes possess a large repertoire of antigen receptors. Although this repertoire is critical for coping with potentially any foreign antigen the immune system encounters, it may also be critical to maintain peripheral tolerance by a subset of T cells, termed regulatory T cells. Using mutant mice expressing a restricted T-cell receptor repertoire, we show that the development of spontaneous colitis, a T-helper type 17 cell-mediated inflammation driven by gut microbiota, is accompanied by a paucity of peripherally derived regulatory T cells and hyperactivation of migratory dendritic cells. Our study reveals a new facet of the full T-cell receptor repertoire requirement in intestinal homeostasis.
Keywords: TCR repertoire, colitis, Treg, Helios, migratory DCs
Abstract
The regulation of intestinal homeostasis by the immune system involves the dynamic interplay between gut commensal microbiota and resident immune cells. It is well known that a large and diverse lymphocyte antigen receptor repertoire enables the immune system to recognize and respond to a wide range of invading pathogens. There is also an emerging appreciation for a critical role the T-cell receptor (TCR) repertoire serves in the maintenance of peripheral tolerance by regulatory T cells (Tregs). Nevertheless, how the diversity of the TCR repertoire in Tregs affects intestinal homeostasis remains unknown. To address this question, we studied mice whose T cells express a restricted TCR repertoire. We observed the development of spontaneous colitis, accompanied by the induction of T-helper type 17 cells in the colon that is driven by gut commensal microbiota. We provide further evidence that a restricted TCR repertoire causes a loss of tolerogenicity to microbiota, accompanied by a paucity of peripherally derived, Helios− Tregs and hyperactivation of migratory dendritic cells. These results thus reveal a new facet of the TCR repertoire in which Tregs require a diverse TCR repitoire for intestinal homeostasis, suggesting an additional driving force in the evolutional significance of the TCR repertoire.
It is estimated that the diversity of T-cell receptor (TCR) repertoire is as high as 2 × 10⁶ and 2.5 × 10⁸ in the periphery of mice and human, respectively. Whereas this diversity is critical for the generation of highly specific immune responses to cope with a wide range of pathogen-derived antigens (1), recent studies also indicate that it could be required for a subset of T cells, termed regulatory T cells (Tregs), to suppress autoimmune and graft-versus-host diseases (2–4). Tregs, which represent about 10% of total T cells in the periphery, are essential for maintaining peripheral tolerance to suppress autoimmune and chronic inflammatory diseases. They are characterized by the expression of the Foxp3 transcription factor, which is essential for their development and maintenance (5, 6). Two in vivo subpopulations of Tregs have been described, thymus-derived Tregs (tTregs), which develop in the thymus, and peripherally derived Tregs (pTregs), which are generated in the periphery from naïve T cells (7, 8).
These two Treg subpopulations may differ in surface-expression molecules, cytokine dependence, suppressive activity, and mechanisms by which they suppress T-cell responses. However, because no reliable markers have been identified, the physiological importance of pTregs is still debatable. A recent report has shown that tTregs express a Helios transcription factor, whereas pTregs do not (9). On the other hand, it has been proposed that the development of pTregs is critical to control immune response against environmental challenges, whereas tTregs are involved in maintenance of self-tolerance and prevention of autoimmunity (8). In fact, several reports have shown that pTregs accumulate at tissues that are exposed to external antigens, such as intestinal mucosa and maternal placenta during pregnancy (10–12).
A mechanism by which Tregs enforce immune tolerance is through suppression of dendritic cells (DCs) (13). Consistent with this, experimental depletion of Tregs leads DCs to expand in number, increase expression of costimulatory molecules, such as CD80 and CD86, and enhance priming ability of T cells (14, 15). In this regard, the coinhibitory molecule CTLA-4 expressed by Tregs interacts with CD80 and CD86 on DCs via transendocytosis, leading to down-regulation of expression of these molecules in vitro (16, 17). However, Treg-mediated DC suppression has not been studied in an in vivo setting. Intestinal CD103+ DCs, termed migratory DCs (migDCs), seem to contribute to the maintenance of peripheral tolerance for a wide range of antigens, including those from commensal microbiota. These CD103+ migDCs also enhance pTreg induction by providing retinoic acid (RA) (18, 19) and express several genes encoding immunomodulatory molecules (20).
This immunological tolerance is highlighted in the intestinal mucosa, where exposure to symbiotic microorganisms and food antigens continuously leads to immune cell activation, but does not result in damage to host tissues. In this context, Tregs are implicated to serve an important role. Indeed, microbiota colonization results in significantly more accumulation of Tregs in the steady-state colon, which is mediated by factors such as bacteria-derived short fatty acid butyrate or propionate, and food-derived vitamin A (18, 19, 21, 22). However, it remains unclear whether and how TCR repertoire in Tregs affects the maintenance of intestinal homeostasis.
In the present study, we ask what effect the diversity of the TCR repertoire has on intestinal homeostasis using genetically engineered mice, termed “Limited mice,” which express only a limited number of TCR genes (23). Our results provide evidence that a diverse TCR repertoire is indeed required for Tregs to maintain intestinal homeostasis through an intricate interaction between pTregs and migDCs. We discuss our findings in relation to how the acquisition of the TCR repertoire is critical for the maintenance of peripheral tolerance.
Results
Development of Spontaneous Colitis with T-Helper Type 17 Inflammation in Limited Mice.
To study diversity of the TCR repertoire in maintaining intestinal homeostasis, we first exaimined Limited mice that are transgenic for the TCRVβ5 and TCRVα2 mini locii (Vαr), single Vα region, and two Jα elements (23). The endogenous Vα locus is inactivated by crossing TCRα-null (Cαo/o) mice and, transgenic TCRβ which, because of the dictates of allelic exclusion, prevents the rearrangement of endogenous TCRβ genes. Interestingly, all Limited mice exhibit diarrhea and rectal prolapse, typical symptoms of chronic colitis, after the age of 8 wk (Fig. 1 A and B).
Fig. 1.
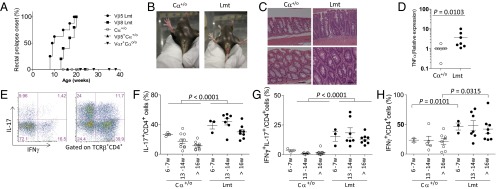
Limited mice spontaneously develop Th17-skewed colitis. (A) Incidence of rectal prolapse of TCRα+/o (Cα+/o, n = 8), Vβ5-transgenic (Vβ5+Cα+/o, n = 8), Vα2-transgenic (Vαr+Cαo/o, n = 7), Vβ5+.Vα2Vαr+.TCRαo/o (Vβ5Lmt, n = 8), and Vβ8+.Vα2Vαr+.TCRαo/o (Vβ8Lmt, n = 5). (B) Photographs of perianal region of Cα+/o and Limited mice with 27 wk of age. (C) Histochemical analysis of colonic tissues from Cα+/o or Limited mouse at 13 wk of age. (Scale bar, 50 μm.) (D) Quantitative RT-PCR analysis of whole colon for TNF-α. Control (ctrl) samples are from littermate Cα+/o. (E) cLP cells were isolated from Cα+/o or Limited mice at age between 6 and 27 wk and examined for intracellular staining of IL-17 and IFN-γ after stimulation of PMA and ionomycin for 4 h. Representative cytograms from mice at 13 wk of age. Cells are gated on TCRβ+CD4+ T cells. (F–H) Frequency of IL-17+ (F), IL-17+ IFN-γ+ (G), and IFN-γ+ (H) cells among TCRβ+CD4+ T cells for pooled mice (n = 3–7 per each group).
To exclude the possibility that colitis development is the consequence of T-cell activation that results from the interaction of Vβ5 chain with superantigen (24, 25), we also examined mice carrying the Vβ5 transgene or Vαr mutation and found that these mice did not develop colitis (Fig. 1A). In addition, mice that carry a TCRVβ8 transgene in lieu of the TCRVβ5 transgene were also observed to develop spontaneous colitis (Fig. 1A). Therefore, the colonic inflammation found in Limited mice is unlikely to be a consequence of nonspecific T-cell activation by superantigen. Rather, these observations indicate a possible critical role for TCR repertoire diversity in the suppression of colonic inflammation.
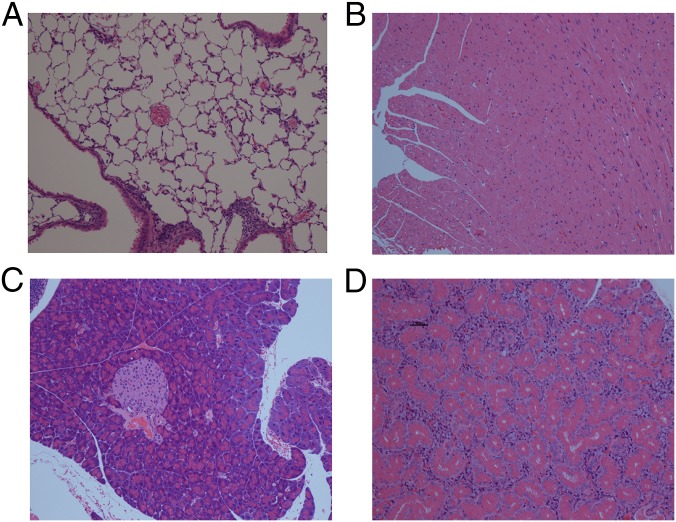
Histological analysis of the Limited mice showed infiltrates in the colonic lamina propria (cLP) and mild hyperplasia of the epithelial layer (Fig. 1C), which was accompanied by an elevation of TNF-α expression (Fig. 1D). In contrast, no infiltration was observed in other organs (Fig. S1). Intracellular cytokine staining of CD4+ T cells from the cLP revealed that Limited mice display a significant increase in the frequency of Th17 cells compared with WT mice throughout the examined period, including prodromal stages between 6 and 7 wk (Fig. 1 E and F). Of note, the mutant mice displayed a marked increase in IFN-γ+IL-17+ cells, which are implicated as pathogenic T cells in the context of mouse models of colitis as well as human patients of ulcerative colitis (Fig. 1 E and G) (26, 27). In contrast to T-helper type 17 (Th17) cells, the difference was not so remarkable for Th1 cells (Fig. 1 E and H). As such, colitis development in Limited mice may resemble inflammatory bowel disease. Given that the increase in IFN-γ+IL-17+ cells occurs even during the precolitis stage (Fig. 1G), we speculate that T cells with a narrow diversity of the TCR repertoire may initially trigger the colitis development.
Fig. S1.
Limited mice do not develop systemic tissue infiltration. Histochemical analysis of lung (A), heart (B), pancreas and islet (C), and thyroid (D) from a Limited mouse at 25 wk of age.
Contribution of Commensal Microbiota Colonization to Colonic Inflammation.
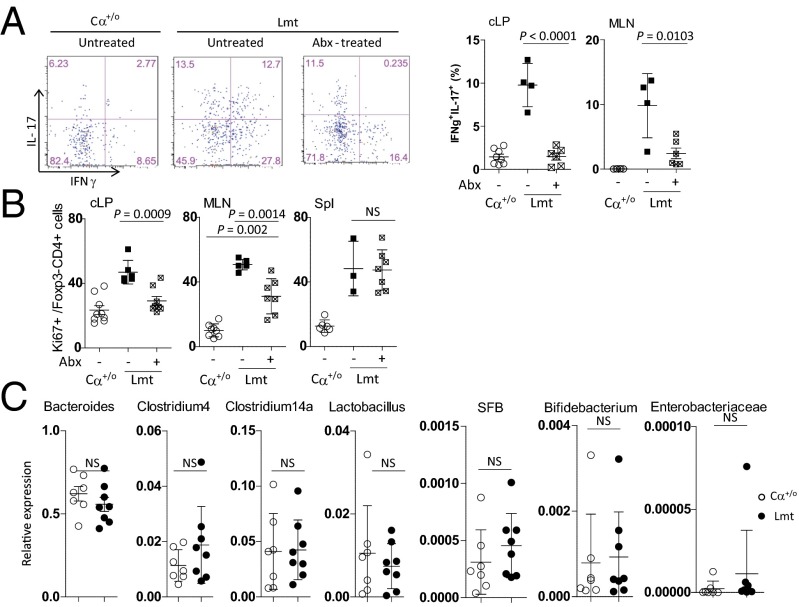
In view of previous reports indicating that an abnormal relationship between microbiota and the mucosal immune system of the intestine drives Th17 inflammation (28), we next examined the effect of antibiotics (Abx) on the development of colonic Th17 inflammation in Limited mice. As shown in Fig. 2A, Abx-treated mice exhibited a decrease in the frequency of pathogenic IFN-γ+IL-17+ cells in both the cLP and mesenteric lymph node (MLN), attaining levels comparable to those of the mice carrying the TCRCα locus as a single allele (Cα+/o mice). These observations therefore indicate that the Th17 inflammation in Limited mice is mediated by microbial colonization.
Fig. 2.
Colonic inflammation in Limited mice reverted to the steady-state by treatment with antibiotics. The mice were administered with ampicillin, neomycin, vancomycin, and metronidazole in drinking water for 4 wk. Expression of IL-17 and IFN-γ (A) and Ki67 (B) of TCRβ+CD4+ Foxp3− cells isolated from the cLP or MLN of untreated Ca+/o or untreated or antibiotic-treated LimitedhCD2 mice (n = 4–7). (C) Bacterial 16S ribosomal RNA analysis of feces from Cα+/o (n = 7) or Limited (n = 8) mice.
Consistent with this finding, vigorous expansion of conventional T (Tconv) cells in the colon were attenuated upon Abx treatment of Limited mice (Fig. 2B). It is worth noting that, although colonic Tconv cells from Abx-treated Limited mice show equivalent levels of proliferation to those of Cα+/o mice, MLN Tconv cells still proliferate more vigorously (Fig. 2B). We speculate that this Tconv proliferation in the MLN is homeostatic expansion driven by the lymphopenic environment of Limited mice. Accordingly, splenic Tconv cells from untreated and Abx-treated Limited mice showed more vigorous proliferation than those from Cα+/o mice (Fig. 2B).
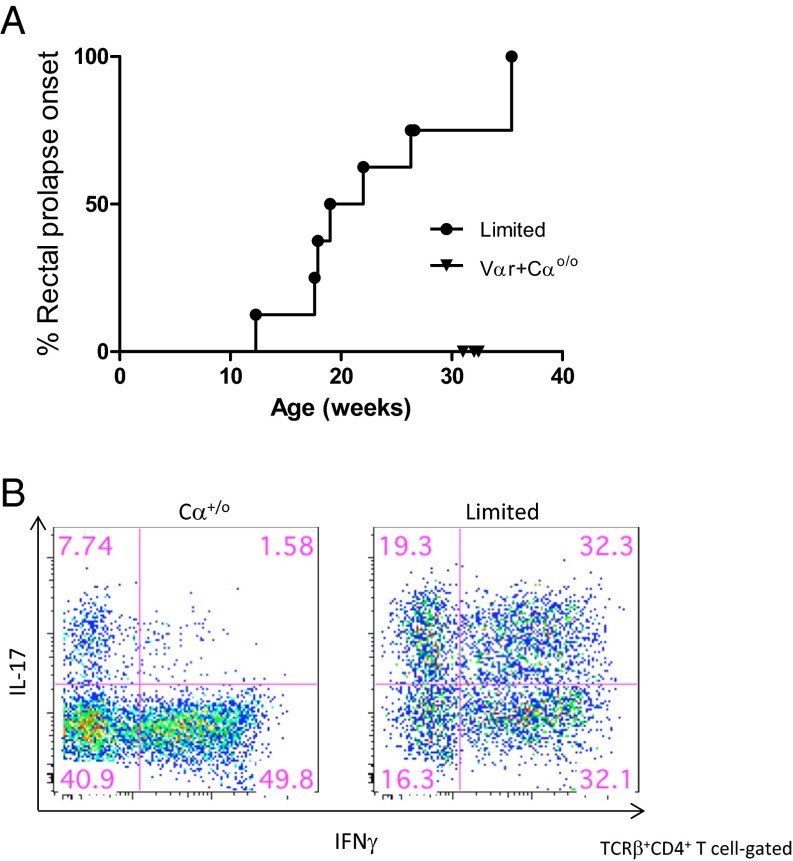
Because alteration in the composition of commensal microbiota could result in colitis (29, 30), the possibility remains that the microbiota of our animal facility may affect the colonic phenotype above. This possibility is unlikely because Limited mice also developed spontaneous colitis, characterized by rectal prolapse and Th17 inflammation, when they were bred in another mouse facility (Fig. S2). We also compared the composition of the microbiota using primers specific for most major genera of bacterial 16S ribosomal RNA. As shown in Fig. 2C, Limited mice displayed no overt alteration in the composition of intestinal microbiota for the genera tested. These include segmented filamentous bacteria, which are known to cause the accumulation of Th17 cells in steady-state intestines (31).
Fig. S2.
Incidence of rectal prolapse of Vαr+Cαo/o and Limited mice in the different mouse facility. Vαr+Cαo/o and Limited mice were bred in the mouse facility of the Graduate School of Medicine, The University of Tokyo. (A) Incidence of rectal prolapse of Vαr+Cαo/o and Limited mice. (B) Representative plots of intracellular staining of IL-17 and IFN-γ after stimulation of PMA and ionomycin for 4 h.
Taken together, these results suggest that colonic Th17 inflammation in Limited mice occurs not as a result of homeostatic proliferation, but rather as a consequence of the loss of T-cell tolerance. In other words, sufficient diversity of TCR repertoire is required for the maintenance of intestinal homeostasis through T-cell tolerance to stimuli from commensal microbiota.
Suppression of Colitis Development by the Transfer of Tregs to Limited Mice.
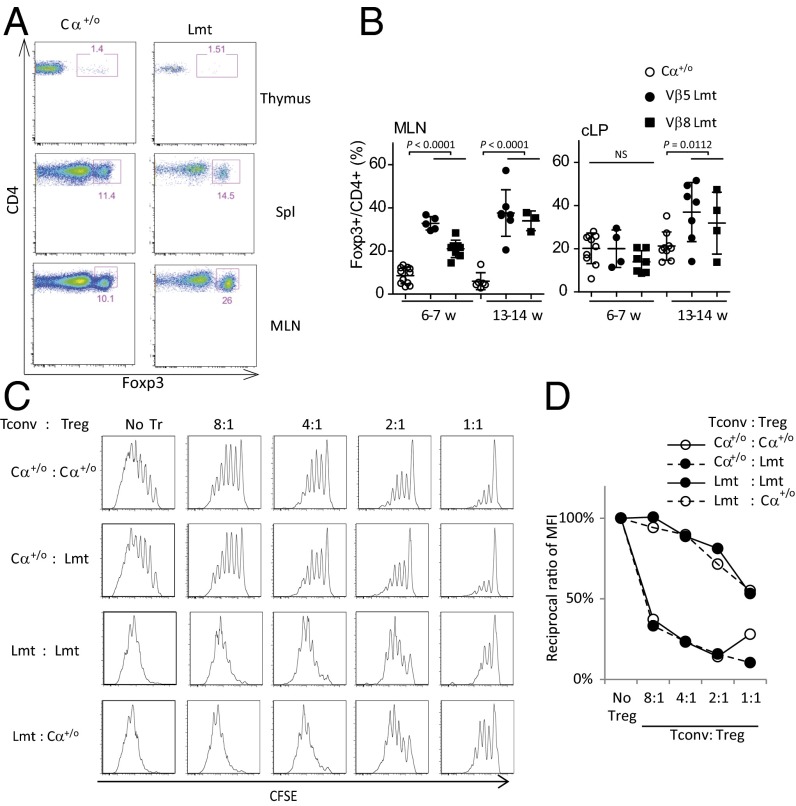
Because Tregs are known to accumulate to high frequencies in the cLP to maintain immune tolerance to commensal bacteria (10), we next analyzed the frequency and functional competency of Tregs in Limited mice. Consistent with a previous study (23), Limited mice displayed comparable frequencies of thymic and splenic Tregs to that of Cα+/o mice (Fig. 3A). Although the frequency of Tregs in the cLP of Limited mice was comparable to that of Cα+/o mice at 6–7 wk of age, they significantly increased at 13–14 wk, the period when colitis symptoms become notable (Fig. 3B).
Fig. 3.
Frequency and in vitro suppression activity of Foxp3+ Treg cells from Limited mice are comparable to those from Cα+/o mice. (A) Representative plots of Foxp3 expression of TCRβ+CD4+ cells isolated from the thymus, spleen (Spl) and MLN of Cα+/o or Limited mice at 4 wk of age. (B) Frequency of Foxp3+CD4+ Treg cells (Tregs) from the MLN and cLP of Cα+/o or Limited mice at indicating age. (C) Suppression assay of splenic Tregs for proliferation of Tconv cells. 2.5 × 10⁴ 5-(and 6)-Carboxyfluorescein diacetate succinimidyl ester (CFSE)-labeled Tconv cells were cocultured with Tregs at indicating cell ratio during stimulation with anti-CD3/CD28 beads. (D) A plot of the reciprocal ratio of mean intensity (MI) of diluted CFSE at indicating cell ratio when that at no Treg condition is 100%. Representative data from three independent experiments are shown.
These observations suggest that Tregs in the Limited mice are competent in their proliferative potential and maintain normal ratios to activated Tconv cells. Indeed, Tregs isolated from Limited mice (Lmt Tregs) suppress proliferation of anti-CD3/CD28-stimulated Tconv cells to an extent similar to Tregs from Cα+/o mice (Cα+/o Tregs) in vitro (Fig. 3 C and D). As such, Th17 colonic inflammation observed in Limited mice is likely not because of their inability to directly suppress Tconv cells. Interestingly, Tconv cells from Limited mice (Lmt Tconv) were more resistant to suppression by Cα+/o Tregs or Lmt Tregs (Fig. 3 C and D), indicating that Lmt Tregs are hyperactivated (see below).
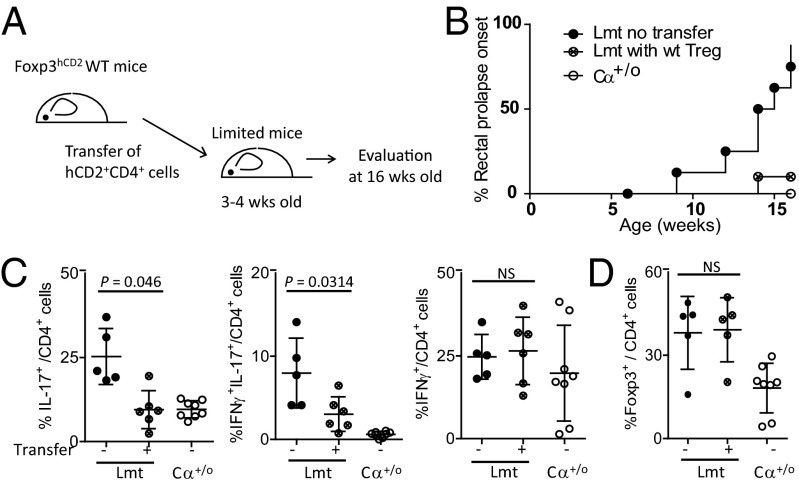
When equivalent numbers of Tregs isolated from spleen and peripheral lymph nodes of control (WT or Cα+/o) or Limited mice were adoptively transferred to the Limited mice at 3–4 wk of age, colitis development, as monitored by 16 wk after birth, was suppressed by transfer of Tregs from control mice, but not Tregs from Limited mice (Fig. 4 A and B). Consistent with this, the transfer of control mouse-derived, fully diverse Tregs to the Limited mice resulted in a decrease of the IFN-γ+IL-17+ cell frequency to comparable levels as to Cα+/o mice (Fig. 4C). That there is no significant difference in the frequency of Tregs in the colon of transferred and nontransferred mice (Fig. 4D) suggests that colitis is suppressed by an increase in the number of highly tolerogenic Treg cell subsets rather than the total Treg cell number. These results further indicate that TCR diversity is required for Tregs to maintain tolerance to the intestinal microbiota (see below).
Fig. 4.
Transfer of WT Foxp3+ Tregs supresses colitis progression. Foxp3+ CD4+ cells collected from Foxp3hCD2 WT mice were transferred to Limited mice at between 3 and 4 wk of age. Lamina propria cells were analyzed at 16 wk of age. (A) Schema of experimental design. (B) Incidence of rectal prolapse of Cα+/o (n = 9), untreated Limited (n = 8), or WT Treg-transferred Limited mice (n = 6). (C) Frequency of IL-17+ cells, IL-17+IFN-γ+ cells, and IFN-γ+ cells among TCRβ+CD4+ Foxp3− cells. (D) Frequency of Foxp3+ Tregs.
Paucity of Helios− Tregs in the Limited Mice.
Tregs lacking the Helios transcription factor (Helios− Tregs), a population of pTregs, represent about half of the total number of Tregs in the colon and are able to respond to microbiota stimuli (10, 11). Indeed, the number of colonic Helios− Tregs in germ-free mice was far less than that of conventional mice (10, 11). Interestingly, we observed that Limited mice displayed a striking decrease in the frequency of Helios− Tregs in the cLP as well as MLN. Abx-treatment did not recover the frequency of Helios− Tregs (Fig. 5A), showing that inflammation does not lead to the attenuation of this population. Moreover, because both Helios+ and Helios− populations from these mice proliferate similarly (Fig. 5B), it is unlikely that the decrease of Helios− Tregs is a consequence of their defective proliferation, but rather a developmental defect of these cells in the colon. The defect in the differentiation of Helios− Tregs may, at least in part, account for the development of colonic Th17 inflammation of these mice expressing a limited TCR repertoire.
Fig. 5.

Attenuation of gut Helios− Tregs in Limited mice. (A) TCRβ+CD4+ gated cells from the cLP and MLN of Cα+/o or untreated or Abx-treated Limited mice were stained for Foxp3 and Helios. Representative cytograms for expression of Foxp3 and Helios are shown (Left). The percentage of Helios− fraction in CD4+Foxp3+ cells is plotted (Right). (B) Expression of Ki67 of MLN Helios+ (H+) or Helios− (H−) Tregs from Cα+/o or Limited mice.
Loss of Steady-State Tolerogenic Phenotype of Intestinal migDCs in the Limited Mice.
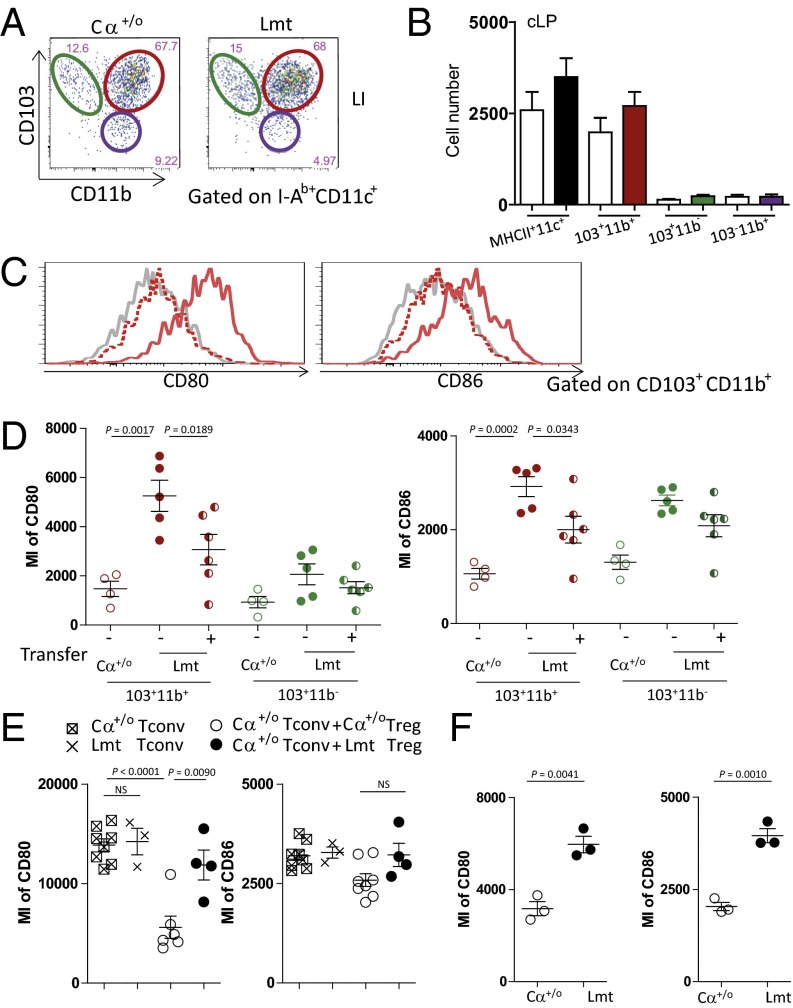
In light of several recent studies indicating that Tregs are required for the regulation of DCs in the maintenance of tissue homeostasis (14, 15), we next examined the activation status of DCs in the colon of Limited mice. Intestinal conventional DCs consist of two main classes, migDCs and lymphoid-tissue resident DCs, which can be distinguished on the basis of cell surface expression of CD103. MigDCs are CD103+ and further subdivided into CD103+CD11b+ DCs and CD103+CD11b− DCs, wherein CD103+CD11b+ DCs represents the major migDC subset in the gut (32, 33). Because intestinal CD103+ migDCs are known to induce pTregs (18, 19), we next examined the status of CD103+ migDCs. Both Cα+/o and Limited mice showed comparable numbers of total DCs and their subsets in the cLP before the onset of colitis in Limited mice (Fig. 6 A and B). Interestingly, however, the surface expression of CD80 and CD86 were markedly enhanced on CD103+CD11b+ DCs in the cLP of Limited mice (Fig. 6 C and D). Expectedly, the expression level of CD80 and CD86 on CD103+CD11b+ DCs in Limited mice was declined upon the transfer of Tregs from Cα+/o mice (Fig. 6 C and D).
Fig. 6.
Gut migDCs from Limited mice were activated. (A and B) Representative FACS dot plot of CD11b and CD103 of I-Ab+CD11c+-gated cells (A) and the number of individual DC subsets, CD103+CD11b+ DCs, CD103+CD11b− DCs, and CD103+CD11b− DCs (B) from the cLP in Cα+/o (white bar) or Limited mice (filled bar). (C) Representative histograms of the expression of CD80 and CD86 of the cLP from Cα+/o (gray line), Limited mice untreated (red line) or 4 wk after WT Treg transfer (red dot line). (D) MI of CD80 or CD86 of each DC subset from Cα+/o (open circle), untreated Limited mice (closed circle), or Limited mice 4 wk after WT Treg transfer (half-closed circle). Data are combined from two independent experiments (n = 2–4 per each group for each experiment). (E) MI of CD80 or CD86 of CD103+CD11b+ DCs of Cαo/o mice after transfer with Cα+/o Tconv cells only, Lmt Tconv cells only, Cα+/o Tconv cells plus Cα+/o Tregs, or Cα+/o Tconv cells plus Lmt Tregs 4 wk. Data are combined from two independent experiments (n = 3–8 per each group). (F) MI of CD80 or CD86 of CX3CR1hi DCs from Cα+/o or Limited mice (n = 3 per each group).
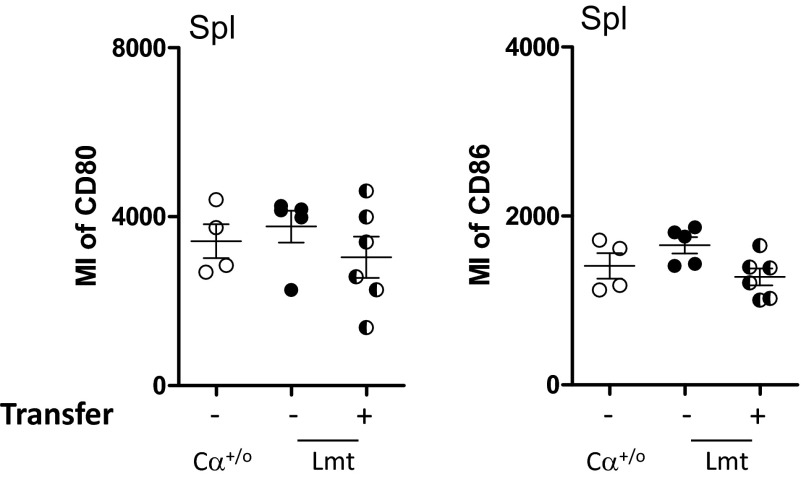
Given that Lmt Tconv cells are hyperactivated (Fig. 3C), the above described activation of CD103+CD11b+ DCs may be mediated by Tconv cells rather than Tregs in Limited mice. To test this hypothesis, we transferred Cα+/o or Lmt Tconv cells into Cαo/o mice that lack all αβ T cells and then examined the activation status of CD103+CD11b+ DCs in the cLP. As shown in Fig. 6E, we observed similar expression levels of CD80 and CD86 in the CD103+ migDCs from both mice, indicating that these Tconv cells do not differ in terms of DC activation, at least in this experimental setting. On the other hand, when Cα+/o Tconv cells were cotransferred with Cα+/o or Lmt Tregs, the expressions of CD80 and CD86 on CD103+ migDCs were suppressed in mice cotransferred with Ca+/o Tregs, but not in those cotransferred with Lmt Tregs (Fig. 6E). These results support the notion that CD103+ migDCs become activated under conditions in which the TCR repertoire of Tregs is restricted. In this context, it is worth noting that expression of CD80 or CD86 did not increase on splenic DCs of Limited mice, suggesting gut migDCs are locally activated in the colon (Fig. S3).
Fig. S3.
Splenic DCs from Limited mice express equivalent level of CD80 and CD86 to those from Cα+/o mice. Graphs show CD80 or CD86 of I-Ab+CD11c+ DCs from spleens of Cα+/o (open circle), Limited mice (closed circle) and WT Treg-tranferred Limited mice (half-closed circle). Data are combined from two independent experiments (n = 2–4 per each experiment).
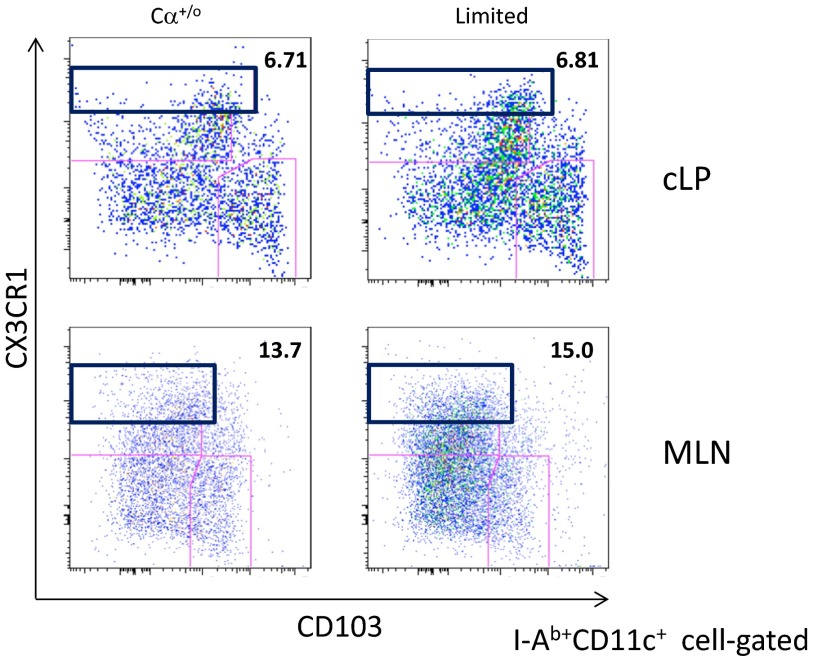
In addition to CD103+ migDCs, CX3CR1hi monocyte-derived DCs which reside in the lamina propria and do not migrate to MLN, have been recently reported to have migratory function in some situations (34). We therefore next examined the status of these cells and found that their expression of CD80 and CD86 also increased in the Limited mice (Fig. 6F). The frequency of CX3CR1hi DCs however, remained the same in the cLP as well as MLN (Fig. S4). As such, we infer that CX3CR1hi DCs may also be involved in the pathogenesis of colitis.
Fig. S4.
Frequency of CX3CR1hi monocyte-derived DCs at precolitis stage. Flow cytometric analysis for CD103 and CX3CR1 expression on I-Ab+CD11c+-gated cells from the cLP or MLN from Cα+/o or Limited mice. A representative plot of three mice per each group is shown.
Gene Expression Profiles in migDCs.
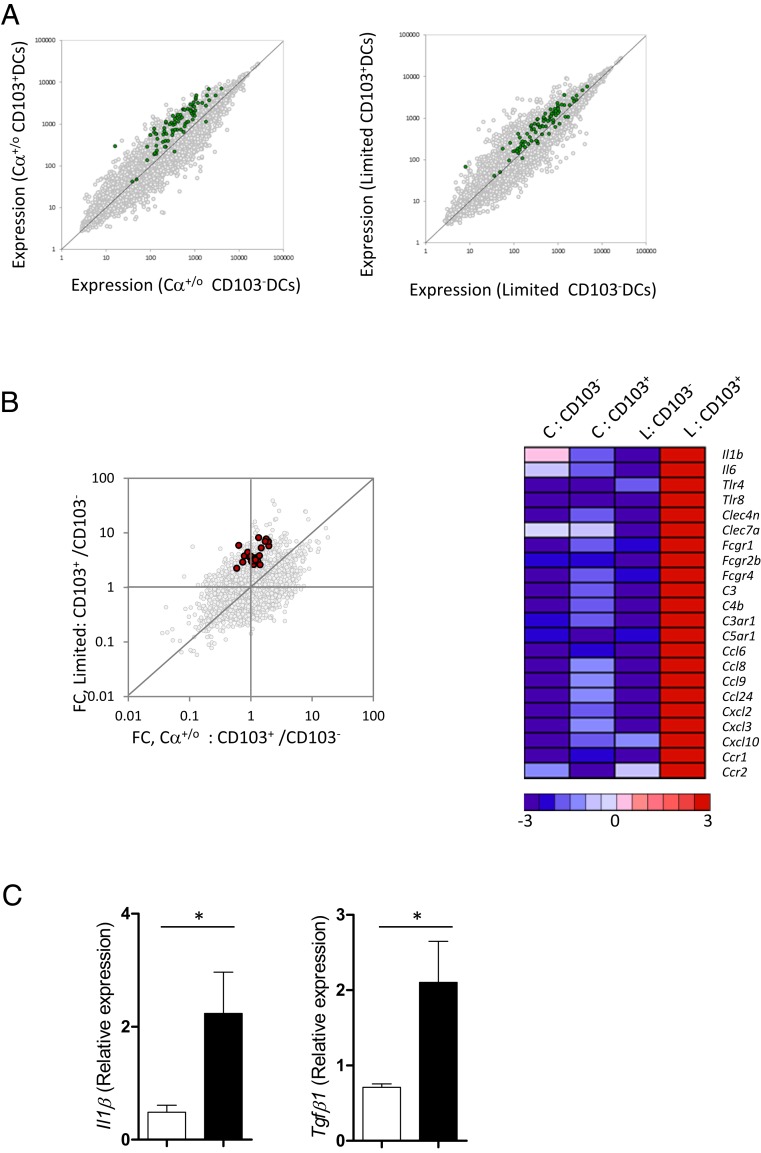
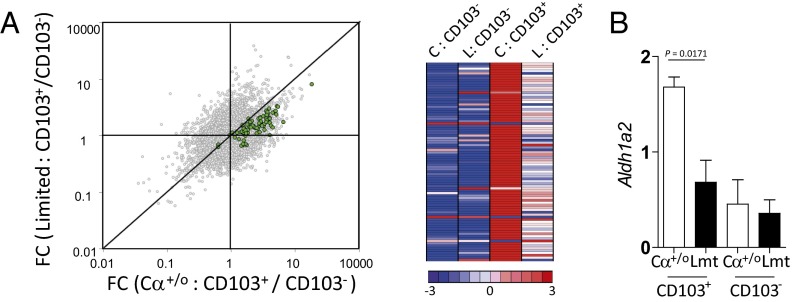
To gain additional insight into the activation of migDCs in Limited mice, we compared genome-wide expression profiles between CD103+ migDCs along with CD103− DCs from the MLN of Cα+/o and Limited mice. We used a set of top 50 up-regulated genes shared by steady-state migDCs across various tissues and their draining LNs, as shown in a recent report (20). This signature gene set was more highly expressed in CD103+ migDCs than in CD103− resident DCs in both Limited and Cα+/o mice, suggesting CD103+ DCs in both mice express a more pronounced migDC phenotype relative to CD103− resident DCs (Fig. S5A and Table S1). Interestingly, however, the expression of migDC signature genes was down-regulated in CD103+ DCs from Limited mice in comparison with those from Cα+/o mice (Fig. 7A), indicating that migDCs in the mutant mice lose the characteristics of steady-state migDCs.
Fig. S5.
Gut migDCs from Limited mice lost expression of steady-state migDC signature, instead up-regulated DC activation-related genes. (A) Comparison in gene-expression profile between CD103+ DCs and CD103− DCs from Cα+/o mice and Limited mice. Top 50 steady-state migDC signature genes (22) are highlighted in green (Table S1). (B) A dot plot shows comparison between FC of CD103+ DCs/CD103− DCs of Limited mice vs. that of Cα+/o mice. Genes encoding cytokines, pattern recognition receptors, complements, Fc receptors, and chemokines that meet the following conditions are highlighted in red; 0.5 < FC of CD103+ DCs/CD103− DCs of Cα+/o mice < 2, and FC of CD103+ DCs/CD103− DCs of Limited mice > 2 (Left). A heatmap (Right) shows the relative expression of genes red-highlighted in the dot plot (Left) among CD103+ DCs and CD103− DCs from Cα+/o mice (C) or Limited mice (L). (C) Quantitative RT-PCR analysis of Il1b and Tgfb1 of CD103+ DCs from Cα+/o or Limited mice.
Table S1.
Expression levels of steady-state migDC signature genes expressed by CD103− or CD103+ migDCs from Cα+/o or Limited mice
| Probe ID | Gene symbol | Expression of each DC subset | Fold-change analysis | |||||
| Cα+/o CD103− | Cα+/o CD103+ | Limited CD103− | Limited CD103+ | Cα+/o CD103+/CD103− | Limited CD103+/CD103− | CD103+ Limited/Cα+/o | ||
| 1416432_at | Pfkfb3 | 1065.88 | 3905.76 | 986.85 | 2332.73 | 3.66 | 2.36 | 0.60 |
| 1416514_a_at | Fscn1 | 4063.09 | 7067.36 | 4638.01 | 5780.29 | 1.74 | 1.25 | 0.82 |
| 1416515_at | Fscn1 | 1053.33 | 4258.05 | 2653.58 | 2747.82 | 4.04 | 1.04 | 0.65 |
| 1416516_at | Fscn1 | 217.65 | 398.95 | 253.15 | 283.72 | 1.83 | 1.12 | 0.71 |
| 1417220_at | Fah | 122.48 | 187.96 | 157.78 | 107.63 | 1.53 | 0.68 | 0.57 |
| 1417222_a_at | Tmem123 | 1484.91 | 3256.73 | 1380.31 | 2073.10 | 2.19 | 1.50 | 0.64 |
| 1418128_at | Adcy6 | 386.56 | 1451.07 | 518.39 | 966.56 | 3.75 | 1.86 | 0.67 |
| 1418219_at | Il15 | 122.56 | 631.54 | 124.54 | 420.99 | 5.15 | 3.38 | 0.67 |
| 1418507_s_at | Socs2 | 1194.93 | 3213.74 | 998.85 | 2021.16 | 2.69 | 2.02 | 0.63 |
| 1418626_a_at | Clu | 196.56 | 558.23 | 148.16 | 247.13 | 2.84 | 1.67 | 0.44 |
| 1418829_a_at | Eno2 | 470.38 | 1677.11 | 341.31 | 943.97 | 3.57 | 2.77 | 0.56 |
| 1420150_at | Spsb1 | 224.75 | 1079.13 | 244.09 | 637.90 | 4.80 | 2.61 | 0.59 |
| 1421103_at | Bmp2k | 314.66 | 552.76 | 623.66 | 423.16 | 1.76 | 0.68 | 0.77 |
| 1421321_a_at | Net1 | 926.63 | 2718.72 | 804.22 | 1410.92 | 2.93 | 1.75 | 0.52 |
| 1421399_at | Insm1 | 414.13 | 1663.13 | 256.72 | 533.32 | 4.02 | 2.08 | 0.32 |
| 1421457_a_at | Samsn1 | 859.73 | 2038.51 | 1061.49 | 1462.17 | 2.37 | 1.38 | 0.72 |
| 1421474_a_at | Spsb1 | 312.83 | 717.35 | 316.06 | 453.44 | 2.29 | 1.43 | 0.63 |
| 1421488_at | Rabgap1l | 609.16 | 1014.89 | 869.63 | 619.66 | 1.67 | 0.71 | 0.61 |
| 1421646_a_at | Pias3 | 226.25 | 283.33 | 213.41 | 240.31 | 1.25 | 1.13 | 0.85 |
| 1422031_a_at | Zfand6 | 662.63 | 1106.04 | 782.02 | 779.80 | 1.67 | 1.00 | 0.71 |
| 1422032_a_at | Zfand6 | 1781.09 | 2734.53 | 1845.89 | 2093.11 | 1.54 | 1.13 | 0.77 |
| 1422397_a_at | Il15ra | 552.75 | 2231.24 | 839.12 | 1701.64 | 4.04 | 2.03 | 0.76 |
| 1422742_at | Hivep1 | 728.19 | 1145.20 | 637.66 | 900.00 | 1.57 | 1.41 | 0.79 |
| 1423305_at | Extl1 | 135.93 | 192.31 | 123.83 | 144.86 | 1.41 | 1.17 | 0.75 |
| 1423615_at | Rnf115 | 427.47 | 1143.64 | 598.64 | 856.28 | 2.68 | 1.43 | 0.75 |
| 1423790_at | Dap | 346.90 | 218.55 | 353.42 | 250.01 | 0.63 | 0.71 | 1.14 |
| 1424148_a_at | Stap2 | 556.43 | 2226.36 | 727.70 | 1233.11 | 4.00 | 1.69 | 0.55 |
| 1424412_at | Ogfrl1 | 952.27 | 1724.59 | 1016.13 | 1309.98 | 1.81 | 1.29 | 0.76 |
| 1424413_at | Ogfrl1 | 942.83 | 1849.80 | 791.40 | 1282.39 | 1.96 | 1.62 | 0.69 |
| 1424414_at | Ogfrl1 | 855.51 | 1802.73 | 717.83 | 1304.40 | 2.11 | 1.82 | 0.72 |
| 1427519_at | Adora2a | 251.33 | 397.70 | 340.86 | 281.14 | 1.58 | 0.82 | 0.71 |
| 1428472_at | Spsb1 | 191.89 | 369.95 | 140.41 | 203.29 | 1.93 | 1.45 | 0.55 |
| 1429196_at | Rabgap1l | 887.88 | 1292.86 | 1105.37 | 738.45 | 1.46 | 0.67 | 0.57 |
| 1429197_s_at | Rabgap1l | 592.06 | 874.30 | 528.38 | 630.42 | 1.48 | 1.19 | 0.72 |
| 1429564_at | Pcgf5 | 318.13 | 659.02 | 439.75 | 660.18 | 2.07 | 1.50 | 1.00 |
| 1431308_at | Ankrd33b | 208.15 | 669.88 | 180.88 | 272.92 | 3.22 | 1.51 | 0.41 |
| 1433571_at | Serinc5 | 565.38 | 647.66 | 442.56 | 413.39 | 1.15 | 0.93 | 0.64 |
| 1434062_at | Rabgap1l | 482.75 | 726.38 | 390.52 | 601.32 | 1.50 | 1.54 | 0.83 |
| 1434666_at | Pcgf5 | 1045.34 | 2098.84 | 1008.72 | 1777.25 | 2.01 | 1.76 | 0.85 |
| 1436223_at | Itgb8 | 16.31 | 295.68 | 8.18 | 67.28 | 18.13 | 8.22 | 0.23 |
| 1437009_a_at | Rnf115 | 476.30 | 1363.81 | 470.78 | 993.32 | 2.86 | 2.11 | 0.73 |
| 1437304_at | Cblb | 693.25 | 2339.45 | 905.58 | 1510.13 | 3.37 | 1.67 | 0.65 |
| 1437419_at | Bmp2k | 2958.08 | 4882.84 | 2668.99 | 3469.57 | 1.65 | 1.30 | 0.71 |
| 1437458_x_at | Clu | 297.88 | 1090.80 | 136.91 | 345.38 | 3.66 | 2.52 | 0.32 |
| 1437689_x_at | Clu | 206.51 | 812.33 | 82.62 | 253.57 | 3.93 | 3.07 | 0.31 |
| 1438470_at | Socs2 | 84.95 | 281.88 | 97.13 | 159.02 | 3.32 | 1.64 | 0.56 |
| 1439531_at | E130311K13Rik | 138.30 | 298.94 | 107.81 | 162.32 | 2.16 | 1.51 | 0.54 |
| 1439588_at | Slco5a1 | 795.88 | 2221.82 | 657.63 | 1067.13 | 2.79 | 1.62 | 0.48 |
| 1439599_at | Gal3st2 | 136.58 | 573.64 | 121.45 | 182.02 | 4.20 | 1.50 | 0.32 |
| 1440874_at | Slco5a1 | 794.63 | 2084.24 | 888.66 | 1191.88 | 2.62 | 1.34 | 0.57 |
| 1441476_at | Socs2 | 130.94 | 582.67 | 160.89 | 227.21 | 4.45 | 1.41 | 0.39 |
| 1441610_at | N28178 | 84.81 | 136.86 | 78.54 | 96.17 | 1.61 | 1.22 | 0.70 |
| 1442236_at | Zfand6 | 215.17 | 283.65 | 325.09 | 285.35 | 1.32 | 0.88 | 1.01 |
| 1442586_at | Socs2 | 126.22 | 199.12 | 119.40 | 159.36 | 1.58 | 1.33 | 0.80 |
| 1445465_at | N28178 | 39.72 | 42.00 | 35.66 | 40.55 | 1.06 | 1.14 | 0.97 |
| 1446085_at | 144.84 | 438.87 | 232.16 | 347.55 | 3.03 | 1.50 | 0.79 | |
| 1448378_at | Fscn1 | 2069.06 | 6821.86 | 3633.95 | 4692.45 | 3.30 | 1.29 | 0.69 |
| 1448429_at | Gyg | 326.79 | 946.35 | 470.51 | 842.48 | 2.90 | 1.79 | 0.89 |
| 1448623_at | Tmem123 | 1905.77 | 4810.82 | 2198.96 | 3047.71 | 2.52 | 1.39 | 0.63 |
| 1448656_at | Cacnb3 | 1090.72 | 4888.50 | 1417.51 | 3658.24 | 4.48 | 2.58 | 0.75 |
| 1448681_at | Il15ra | 223.26 | 1130.16 | 300.21 | 726.11 | 5.06 | 2.42 | 0.64 |
| 1449109_at | Socs2 | 970.87 | 2649.96 | 1014.00 | 1669.48 | 2.73 | 1.65 | 0.63 |
| 1449152_at | Cdkn2b | 230.68 | 577.81 | 178.17 | 197.83 | 2.50 | 1.11 | 0.34 |
| 1449752_at | Spsb1 | 324.54 | 1604.47 | 350.17 | 967.38 | 4.94 | 2.76 | 0.60 |
| 1451112_s_at | Dap | 1812.14 | 1142.41 | 1713.00 | 1085.67 | 0.63 | 0.63 | 0.95 |
| 1451115_at | Pias3 | 396.71 | 734.10 | 346.38 | 697.22 | 1.85 | 2.01 | 0.95 |
| 1451261_s_at | Stap2 | 397.26 | 1395.38 | 357.61 | 716.97 | 3.51 | 2.00 | 0.51 |
| 1452995_at | Nudt17 | 588.07 | 2219.01 | 521.48 | 1286.18 | 3.77 | 2.47 | 0.58 |
| 1453004_at | Slc22a23 | 269.77 | 974.48 | 287.62 | 545.09 | 3.61 | 1.90 | 0.56 |
| 1453287_at | Ankrd33b | 121.04 | 785.63 | 155.63 | 274.66 | 6.49 | 1.76 | 0.35 |
| 1453365_at | Rabgap1l | 139.00 | 231.94 | 136.73 | 170.69 | 1.67 | 1.25 | 0.74 |
| 1453636_at | Pcgf5 | 362.01 | 732.43 | 461.21 | 642.00 | 2.02 | 1.39 | 0.88 |
| 1453782_at | Ankrd33b | 363.04 | 1330.05 | 253.73 | 670.86 | 3.66 | 2.64 | 0.50 |
| 1454849_x_at | Clu | 355.56 | 1011.55 | 202.56 | 419.63 | 2.84 | 2.07 | 0.41 |
| 1455023_at | N28178 | 49.34 | 46.67 | 49.10 | 50.43 | 0.95 | 1.03 | 1.08 |
| 1455082_at | Cblb | 910.95 | 1636.91 | 701.25 | 1125.45 | 1.80 | 1.60 | 0.69 |
| 1455865_at | Insm1 | 99.76 | 544.09 | 56.92 | 184.13 | 5.45 | 3.23 | 0.34 |
| 1456676_a_at | Pfkfb3 | 953.02 | 3352.57 | 1232.35 | 2143.36 | 3.52 | 1.74 | 0.64 |
| 1458370_at | Bmp2k | 2139.24 | 3668.58 | 2305.44 | 2534.17 | 1.71 | 1.10 | 0.69 |
| 1458469_at | Cblb | 518.89 | 1458.74 | 786.84 | 908.93 | 2.81 | 1.16 | 0.62 |
| 1459522_s_at | Gyg | 350.91 | 1124.38 | 469.55 | 1041.62 | 3.20 | 2.22 | 0.93 |
| 1460330_at | Anxa3 | 813.72 | 2926.17 | 685.80 | 1612.49 | 3.60 | 2.35 | 0.55 |
| 1460710_at | Adora2a | 1013.37 | 1566.97 | 1499.02 | 1073.41 | 1.55 | 0.72 | 0.69 |
Fig. 7.
Gut migDCs from Limited mice lost the steady-state migDC signature. (A) Gene expression profile of FACS-sorted CD103+ DCs and CD103− DCs from the MLN of Cα+/o or Limited mice. A dot plot shows the comparison between fold-change (FC) of CD103+ DCs/CD103− DCs of Limited mice vs. that of Cα+/o mice (Left). Top 50 genes of the signature genes set of steady-state migDCs (22) is highlighted in green (Table S1). A heatmap shows the relative expression of migDC signature genes among CD103− DCs and CD103+ DCs from Cα+/o mice (C) or Limited mice (L) (Right). (B) Quantative RT-PCR analysis for Aldh1a2 of sorted CD103+ DCs or CD103− DCs from MLN of Cα+/o or Limited mice (n = 3 per each group).
Intestinal CD103+ migDCs also have capability to induce pTregs by supplying RA that is converted from vitamin A by retinaldehyde dehydrogenase 2 (RALDH2) (18, 19). Interestingly, the expression of Aldh1a2 encoding RALDH2 was markedly reduced in CD103+ DCs from Limited mice (Fig. 7B), suggesting that migDCs in these mice are unable to produce sufficient RA to induce pTreg. We also analyzed genes up-regulated specifically in CD103+ DCs from Limited mice (Fig. S5B). Many of the up-regulated genes are found to be associated with DC activation (Fig. S5B and Table S2). Of note, mRNAs for Il-6, IL-1β, and TGF-β1, cytokines critical for Th17 differentiation, are highly expressed in CD103+ DCs from Limited mice (Fig. S5 B and C). Additionally, mRNAs for C-type lectin Receptors, known to mediate Th17 response (35), are also highly expressed (Fig. S5B). These observations in toto support the notion that Tregs that develop in Limited mice are incapable of effectively restraining the activation of gut migDC in response to exposure to commensal microbiota.
Table S2.
Genes specifically up-regulated in CD103+ migDCs from or Limited mice
| Probe ID | Gene symbol | Expression in each DC subset | Fold-change | ||||
| Cα+/o CD103− | Cα+/o CD103+ | Limited CD103− | Liimited 103+ | Cα+/o CD103+/CD103− | Limited CD103+/CD103− | ||
| 1422953_at | Fpr2 | 73.87 | 86.27 | 98.91 | 1583.00 | 1.168 | 16.004 |
| 1450826_a_at | Saa3 | 72.45 | 76.27 | 95.41 | 1309.52 | 1.053 | 13.724 |
| 1419598_at | Ms4a6d | 116.84 | 142.21 | 80.64 | 1018.08 | 1.217 | 12.625 |
| 1448061_at | Msr1 | 54.84 | 70.52 | 23.36 | 260.79 | 1.286 | 11.164 |
| 1448929_at | F13a1 | 39.09 | 47.17 | 36.29 | 369.09 | 1.207 | 10.171 |
| 1456563_at | 4933429F08Rik | 37.81 | 44.52 | 27.81 | 276.80 | 1.177 | 9.952 |
| 1420249_s_at | Ccl6 | 74.47 | 99.73 | 61.51 | 501.45 | 1.339 | 8.152 |
| 1429954_at | Clec4a3 | 210.29 | 223.27 | 139.28 | 1094.30 | 1.062 | 7.857 |
| 1435748_at | Gda | 36.37 | 53.77 | 61.89 | 453.57 | 1.479 | 7.329 |
| 1419394_s_at | S100a8 | 177.67 | 241.62 | 821.62 | 5405.04 | 1.360 | 6.578 |
| 1425295_at | Ear11 | 7.02 | 6.64 | 6.46 | 41.78 | 0.945 | 6.469 |
| 1420330_at | Clec4e | 20.49 | 17.93 | 17.11 | 105.56 | 0.875 | 6.170 |
| 1438377_x_at | Slc13a3 | 20.21 | 22.99 | 18.67 | 113.63 | 1.138 | 6.088 |
| 1420804_s_at | Clec4d | 49.66 | 50.41 | 35.87 | 216.59 | 1.015 | 6.039 |
| 1440527_at | 14.94 | 10.93 | 9.89 | 57.04 | 0.731 | 5.767 | |
| 1459876_at | 75.61 | 81.88 | 90.44 | 503.50 | 1.083 | 5.567 | |
| 1419872_at | Csf1r | 2354.39 | 2343.46 | 982.63 | 5432.88 | 0.995 | 5.529 |
| 1426930_at | Celf4 | 248.21 | 216.20 | 111.50 | 610.92 | 0.871 | 5.479 |
| 1451798_at | Il1rn | 265.86 | 331.74 | 231.73 | 1247.11 | 1.248 | 5.382 |
| 1422781_at | Tlr3 | 59.55 | 84.72 | 22.17 | 118.73 | 1.423 | 5.355 |
| 1427256_at | Vcan | 19.25 | 15.19 | 21.30 | 113.70 | 0.789 | 5.338 |
| 1425951_a_at | Clec4n | 51.13 | 75.58 | 49.13 | 260.60 | 1.478 | 5.304 |
| 1424998_at | Emr4 | 191.29 | 257.18 | 103.99 | 548.91 | 1.344 | 5.278 |
| 1419873_s_at | Csf1r | 419.99 | 584.21 | 261.21 | 1370.31 | 1.391 | 5.246 |
| 1420331_at | Clec4e | 12.28 | 10.75 | 16.63 | 86.60 | 0.875 | 5.208 |
| 1442339_at | Stfa2l1 | 20.36 | 13.68 | 10.04 | 52.15 | 0.672 | 5.195 |
| 1425663_at | Il1rn | 73.62 | 74.79 | 76.81 | 378.94 | 1.016 | 4.934 |
| 1420118_s_at | 14.45 | 14.83 | 10.75 | 52.90 | 1.026 | 4.919 | |
| 1449305_at | F10 | 60.05 | 84.12 | 66.00 | 311.13 | 1.401 | 4.714 |
| 1423933_a_at | 1600029D21Rik | 29.78 | 37.78 | 25.30 | 116.62 | 1.269 | 4.610 |
| 1425548_a_at | Lst1 | 1603.79 | 1269.05 | 728.39 | 3274.05 | 0.791 | 4.495 |
| 1442576_at | Creb5 | 25.40 | 28.30 | 19.18 | 85.60 | 1.114 | 4.463 |
| 1420699_at | Clec7a | 325.45 | 289.40 | 131.49 | 580.24 | 0.889 | 4.413 |
| 1454824_s_at | Mtus1 | 28.52 | 35.62 | 33.37 | 146.38 | 1.249 | 4.387 |
| 1445196_at | C79595 | 201.67 | 191.88 | 44.63 | 195.44 | 0.951 | 4.379 |
| 1416572_at | Mmp14 | 49.25 | 65.60 | 45.64 | 199.70 | 1.332 | 4.376 |
| 1431056_a_at | Lpl | 47.99 | 70.77 | 45.30 | 194.24 | 1.475 | 4.288 |
| 1442118_at | 145.26 | 148.84 | 76.58 | 327.88 | 1.025 | 4.282 | |
| 1457145_at | Plekhg4 | 34.89 | 31.01 | 26.64 | 114.01 | 0.889 | 4.280 |
| 1448055_at | Fndc7 | 315.17 | 469.72 | 93.27 | 389.60 | 1.490 | 4.177 |
| 1419906_at | Hpgd | 85.53 | 125.64 | 35.14 | 146.66 | 1.469 | 4.174 |
| 1427102_at | Slfn4 | 76.07 | 65.02 | 106.08 | 436.46 | 0.855 | 4.115 |
| 1425037_at | Fgd4 | 30.52 | 34.47 | 17.76 | 71.75 | 1.129 | 4.040 |
| 1450731_s_at | Tnfrsf21 | 263.13 | 250.10 | 191.88 | 774.87 | 0.950 | 4.038 |
| 1417266_at | Ccl6 | 245.71 | 345.53 | 198.07 | 795.09 | 1.406 | 4.014 |
| 1425468_at | Plp1 | 35.77 | 41.70 | 27.55 | 109.63 | 1.166 | 3.980 |
| 1422868_s_at | Gda | 45.48 | 66.34 | 47.21 | 186.61 | 1.458 | 3.953 |
| 1419691_at | Camp | 85.48 | 115.37 | 159.69 | 623.99 | 1.350 | 3.908 |
| 1422648_at | Slc7a2 | 7.00 | 6.96 | 7.35 | 28.63 | 0.994 | 3.893 |
| 1450967_at | Ptplad2 | 84.93 | 89.89 | 73.81 | 286.91 | 1.058 | 3.887 |
| 1450808_at | Fpr1 | 35.76 | 39.47 | 36.06 | 137.88 | 1.104 | 3.824 |
| 1438148_at | Cxcl3 | 5.27 | 7.28 | 5.17 | 19.77 | 1.381 | 3.823 |
| 1418806_at | Csf3r | 112.44 | 123.79 | 92.55 | 351.20 | 1.101 | 3.795 |
| 1450297_at | Il6 | 63.22 | 49.49 | 35.93 | 134.91 | 0.783 | 3.755 |
| 1451941_a_at | Fcgr2b | 227.03 | 227.85 | 198.67 | 744.62 | 1.004 | 3.748 |
| 1442049_at | 20.25 | 19.17 | 19.77 | 73.93 | 0.947 | 3.740 | |
| 1447872_at | 36.99 | 45.81 | 23.89 | 88.70 | 1.238 | 3.713 | |
| 1418009_at | Gcfc1 | 88.28 | 131.93 | 41.35 | 153.18 | 1.495 | 3.705 |
| 1422041_at | Pilrb1 | 172.30 | 194.84 | 181.05 | 670.13 | 1.131 | 3.701 |
| 1425434_a_at | Msr1 | 144.38 | 183.09 | 114.63 | 420.67 | 1.268 | 3.670 |
| 1450267_at | Tlr8 | 33.78 | 31.94 | 31.20 | 113.43 | 0.946 | 3.635 |
| 1434559_at | Stx3 | 70.66 | 48.12 | 30.69 | 111.55 | 0.681 | 3.635 |
| 1436576_at | Fam26f | 339.15 | 448.81 | 359.87 | 1307.62 | 1.323 | 3.634 |
| 1454147_at | 2810429I04Rik | 7.51 | 5.63 | 5.58 | 20.19 | 0.750 | 3.620 |
| 1421410_a_at | Pstpip2 | 92.45 | 72.15 | 72.29 | 258.55 | 0.780 | 3.577 |
| 1448655_at | Lrp1 | 76.17 | 80.31 | 71.35 | 253.57 | 1.054 | 3.554 |
| 1427747_a_at | Lcn2 | 58.01 | 72.35 | 157.88 | 556.83 | 1.247 | 3.527 |
| 1445574_at | 92.19 | 113.95 | 81.16 | 285.07 | 1.236 | 3.512 | |
| 1440926_at | Flt1 | 28.54 | 33.82 | 29.79 | 104.42 | 1.185 | 3.506 |
| 1445104_at | E230029C05Rik | 60.16 | 76.42 | 46.14 | 161.67 | 1.270 | 3.504 |
| 1418021_at | C4b | 87.72 | 103.84 | 84.10 | 294.05 | 1.184 | 3.496 |
| 1423166_at | Cd36 | 125.15 | 185.15 | 43.18 | 149.73 | 1.479 | 3.467 |
| 1431251_at | Lrrc3 | 98.07 | 95.38 | 39.21 | 135.89 | 0.973 | 3.466 |
| 1419684_at | Ccl8 | 29.91 | 37.79 | 27.51 | 94.35 | 1.263 | 3.429 |
| 1427996_at | BC028528 | 1098.31 | 1069.62 | 451.90 | 1547.17 | 0.974 | 3.424 |
| 1430439_at | Mctp1 | 104.66 | 100.64 | 61.43 | 206.62 | 0.962 | 3.363 |
| 1447887_x_at | Vcan | 27.71 | 22.94 | 18.89 | 63.36 | 0.828 | 3.355 |
| 1439831_at | 59.53 | 69.20 | 133.56 | 446.94 | 1.163 | 3.346 | |
| 1424832_at | Cd300ld | 299.88 | 220.88 | 201.86 | 674.56 | 0.737 | 3.342 |
| 1448881_at | Hp | 93.76 | 99.46 | 88.00 | 292.43 | 1.061 | 3.323 |
| 1441640_at | 38.37 | 55.78 | 16.73 | 55.25 | 1.454 | 3.303 | |
| 1441516_a_at | C130050O18Rik | 153.86 | 155.21 | 112.96 | 369.22 | 1.009 | 3.269 |
| 1440179_x_at | Rnf217 | 120.96 | 99.50 | 54.16 | 174.07 | 0.823 | 3.214 |
| 1435830_a_at | 5430435G22Rik | 602.18 | 622.00 | 208.15 | 666.86 | 1.033 | 3.204 |
| 1449005_at | Slc16a3 | 116.51 | 120.42 | 87.45 | 279.64 | 1.034 | 3.198 |
| 1419610_at | Ccr1 | 15.03 | 17.87 | 15.98 | 51.05 | 1.189 | 3.195 |
| 1458459_a_at | E230029C05Rik | 72.13 | 65.55 | 73.75 | 233.63 | 0.909 | 3.168 |
| 1434484_at | 1100001G20Rik | 73.97 | 91.72 | 76.65 | 240.79 | 1.240 | 3.142 |
| 1450009_at | Ltf | 87.90 | 80.49 | 184.45 | 576.81 | 0.916 | 3.127 |
| 1448134_at | X99384 | 92.41 | 63.38 | 88.83 | 276.99 | 0.686 | 3.118 |
| 1415960_at | Mpo | 42.63 | 41.73 | 37.49 | 115.88 | 0.979 | 3.091 |
| 1450876_at | Cfh | 13.02 | 9.40 | 16.75 | 51.50 | 0.722 | 3.074 |
| 1427038_at | Penk | 103.40 | 77.44 | 45.83 | 140.33 | 0.749 | 3.062 |
| 1456341_a_at | Klf9 | 232.80 | 216.81 | 171.32 | 519.44 | 0.931 | 3.032 |
| 1457222_at | Creb5 | 43.44 | 55.88 | 53.38 | 161.64 | 1.286 | 3.028 |
| 1449726_at | Glrx3 | 126.82 | 144.48 | 88.68 | 267.77 | 1.139 | 3.019 |
| 1423593_a_at | Csf1r | 111.80 | 156.33 | 139.98 | 422.67 | 1.398 | 3.019 |
| 1442082_at | C3ar1 | 15.05 | 15.41 | 12.52 | 37.63 | 1.024 | 3.007 |
| 1450488_at | Ccl24 | 68.13 | 88.64 | 66.78 | 200.63 | 1.301 | 3.004 |
Discussion
In this study, we demonstrated the importance of a diverse Treg TCR repertoire for maintaining intestinal homeostasis. We revealed that Limited mice, which bear a restricted TCR repertoire, develop spontaneous colitis with Th17 inflammation. Contribution of microbiota to colitis is underscored by the observation that elimination of commensal microbiota with antibiotics suppressed Th17-mediated inflammation in these mice. We also adduced evidence that a paucity of pTregs and hyperactivation of migDCs (and possibly CX3CR1hi monocyte-derived DCs) in these mice contributes to local, Th17-type inflammation in the colon.
How does the limited TCR repertoire affect pTregs and migDCs and account for colitis development? Although Limited mice display lymphopenia and homeostatic expansion, they exhibit normal thymic development and frequencies of tTreg population in the periphery and, accordingly, no infiltration in organs except intestines. These observations suggest that both central and peripheral tolerance to self-tissue is established in the Limited mice. On the other hand, intestinal migDCs constantly present not only self- but also microbiota- or food-derived antigens, and thereby need additional tolerance to these external antigens for tissue homeostasis. Therefore, Limited mice may display a selective defect in the acquisition of tolerance to commensal microbial stimuli, consequently skewing homeostasis toward Th17 inflammation. This notion is also consistent with our data, which show that the cotransfer of Tregs from WT mice—but not those from Limited mice—with WT Tconv cells can suppress the activation of migDCs in the Cαo/o mice (Fig. 6E).
Although we cannot conclusively identify the basis for how a narrow diversity of TCR results in this selective defect, it is interesting to note that the Herios− pTregs are scarce in the colon of the Limited mice and that transfer of WT Tregs inhibits colitis development accompanied by the attenuation of Th17 inflammation. Furthermore, colonic migDCs from Limited mice express CD80 and CD86, and lose the expression of migDC signature genes accompanied by up-regulation of genes associated with DC activation. The expression of CD80 and CD86 on DCs is suppressed by the transfer of WT Tregs, indicating that a “sufficient” TCR repertoire of Tregs is essential to restrain migDCs activated by colonization of commensal microbiota. Thus, the paucity of pTregs and activation of migDCs are closely linked in which a cycle between defective pTregs and the activated of migDCs not only fail to sufficiently induce pTregs but in fact promote Th17 responses (Figs. 5–7 and Fig. S5). As such, this vicious cycle becomes the foundation of the colonic Th17 inflammation over time. To our knowledge, our study may provide the first evidence that diversity of TCR repertoire in Tregs is essential to maintain intestinal homeostasis.
There are several recent reports that support this theory, in particular demonstration that the intestinal DC subset CD103+ migDCs can induce Th17 in the steady-state as well as in inflammation (36–38), whereas the CD103+ migDCs also contribute to enhancing pTreg induction. However, these studies do not elucidate how this subset differentially induces these two counterpart cell populations. Our study identified that sufficient diversity of Tregs restrains CD103+ migDCs activated with microbiota-derived stimuli to maintain a tolerogenic, steady-state phenotype in vivo.
That pTregs induced by microbiota-derived antigens contribute to intestinal homeostasis (11, 39) is controversial. Whether tTregs or pTregs are dominant in the cLP by comparing TCR sequence between colonic Tregs and naïve or thymic Tregs was addressed using different mouse lines with restricted TCR repertoire in these studies. Given our results that the differentiation of colonic pTregs is more severely impaired under a more restricted TCR repertoire size, the discrepancy of colonic pTreg frequency between the groups above might reflect different ranges of TCR repertoire in the strains of mice used. In this context, our present study might lend support to the notion that pTregs play a critical role in intestinal homeostasis.
Because elimination of microbiota by antibiotics apparently suppresses colonic Th17 inflammation in the Limited mice, it is likely that microbiota-specific pTregs are required to restrain migDCs for which full diversity of TCR is critical. However, an alternative scenario, not rigorously excluded, is the case in which colonization with microbiota might impact the quantity or quality of self-antigen presentation in the host intestinal environment, such that Tregs with a more diverse TCR repertoire are required for tolerance to self-tissues. This issue needs to be addressed further, including identification of microbiota-associated antigens.
In summary, our study with Limited mice reveals a unique facet of immune regulation in which Tregs with a sufficient TCR diversity play a key role in the maintenance of intestinal homeostasis by efficiently restraining homeostatic migDC responses against gut microbiota. We envisage that the host immune system has acquired full TCR repertoire not only to evoke highly specific immune responses to cope with a wide range of pathogen-derived antigens, but also to tolerate intestinal microbiota that are otherwise beneficial to the host.
Materials and Methods
Mice.
Vβ5Limited (Vβ5tg+.Vαr+.Cαo/o) and Foxp3hCD2 reporter mice were previously reported (23, 40). Vβ8 Limied (Vβ8tg+.Vαr+.Cαo/o) mice were generated by crossing Vαr+.Cαo/o mice onto C57L/J-Tg(Tcrb)93Vbo/J mice purchased from the Jackson Laboratory. In some experiments, Limited mice were crossed onto Foxp3hCD2 reporter mice. All of the strains were bred in the animal facility of Institute of Industrial Science, The University of Tokyo. A Vβ5Limited mouse strain was also bred in the facility of the Graduate School of Medicine, The University of Tokyo. All animal care and experiments were conformed to the guidelines for animal experiments of The University of Tokyo, and were approved by the animal research committee of The University of Tokyo. Other information is provided in SI Materials and Methods. See Table S3 for primer sets of each bacterial series.
Table S3.
Primer sets for each bacterial species
| Bacteria spp. | Forward/reverse | Primer sequences |
| All bacteria | Forward | GGTGAATACGTTCCCGG |
| Reverse | TACGGCTACCTTGTTACGACTT | |
| Bacteroides | Forward | GAGAGGAAGGTCCCCCAC |
| Reverse | CGCTACTTGGCTGGTTCAG | |
| Clostridium ClusterIV | Forward | GCACAAGCAGTGGAGT |
| Reverse | CTTCCTCCGTTTTGTCAA | |
| Clostridium ClusterXIVa | Forward | AAATGACGGTACCTGACTAA |
| Reverse | CTTTGAGTTTCATTCTTGCGAA | |
| Lactobacillus | Forward | TGGAAACAGRTGCTAATACCG |
| Reverse | GYCCATTGTGGAAGATTCCC | |
| Enterobacteriaceae | Forward | TGCCGTAACTTCGGGAGAAGGCA |
| Reverse | TCAAGGACCAGTGTTCAGTGTC | |
| Bifidobacterium | Forward | CGGGTGAGTAATGCGTGACC |
| Reverse | TGATAGGACGCGACCCCA | |
| Segmented filamentous bacteria | Forward | AGGAGGAGTCTGCGGCACATTAGC |
| Reverse | CGCATCCTTTACGCCCAGTTATTC |
Treatment with Antibiotics.
Mice were administered with drinking water containing 1 mg/L of ampicillin, 1 mg/L of neomycin, 0.5 mg/L of vancomycin, and 1 mg/L of metronidazole for 4 wk.
SI Materials and Methods
Isolation of Intestinal Epithelial Cells and Lamina Propria Cells.
Whole colonic tissue was incubated in 5 mM EDTA/HBSS buffer at 37 °C for 20 min, subsequently to separate intestinal epithelial cells. The remaining lamina propria with muscles was finely cut into small pieces and incubated with collagenase D (750 μg/mL; Roche), DNaseI (40 μg/mL; Roche), and dispase (500 μg/mL; Gibco) for 30 min. After washing in 5 mM EDTA/HBSS buffer, cell suspension was subjected to gradient separation with 40% and 80% Percoll (GE Healthcare) to separate lamina propria cells in the layer between upper and lower phase.
Flow Cytometry.
Cell surface staining was performed by standard procedures and reagents. Intracellular staining for cytokines and Foxp3 staining was performed with the manufacturer’s protocols (eBioscience). Dead cells were eliminated in intracellular staining experiments by LIVE/DEAD Fixable Dead Cell Stain Sampler Kit (Invitrogen). Analysis was performed using LSR Fortessa instrument (BD Biosciences), and FlowJo software (Tree Star). For sorting, FACSAria was used (BD Biosciences).
Quantitative RT-PCR.
Total RNA from tissues or sorted cells was extracted using RNAiso (Takara) or NucleoSpin RNA II (Macherey Nagel) by following manufactural protocols, and was reverse-transcribed with PrimeScript RT Master Mix (Takara). Quantitative RT-PCR was performed on Light Cycler 480 (Roche Bioscience) using the SYBR Green PCR Master Mix (Roche Bioscience) and values were normalized to the expression of Gapdh mRNA. Primer sequences are as follows: Gapdh forward 5′-ctcatgaccacagtccatgc-3′; Gapdh reverse 5′-cacattgggggtaggaacac-3′; Il1β forward 5′- gtggaccttccaggatgagg-3′; Il1β reverse 5′-cggagcctgtagtgcagttg-3′; Tnfα forward 5′-tcataccaggagaaagtcaacctc-3′; Tnfα reverse 5′-gtatatgggctcataccagggttt-3′. Tgfβ forward 5′- tacaaccaacacaacccgggcg -3′; Tgfβ reverse 5′- tgcacttgcaggagcgcacaa -3′.
Quantitative PCR of Bacterial 16S rRNA.
Fresh fecal samples were stored at −20 °C before DNA isolation or ELISA. DNA was extracted using the QIAamp DNA Stool Mini Kit (Qiagen) by following manufactural protocol. Using DNA from each sample, quantitative PCR was carried out for detection and quantification of the following bacterial targets: Clostridium group cluster IV, Clostridium leptum subgroup cluster XIVa, Bacteroides spp., Lactobacillus spp., Enterobacteriaceae spp., Bifidobacterium spp., and segmented filamentous bacteria. Primer sets of each species are shown in Table S3.
In Vitro Cultures.
For intracellular staining, cLP cells, MLN cells, and splenocytes were simulated with PMA (18 ng/mL), ionomycin (500 ng/mL), together with Golgi-stop (BD) for 4 h before staining. For measurement of Treg suppression acitivity, both CD4+hCD2− and CD4+hCD2+ cells were FACS-sorted. CD4+hCD2− cells were incubated with RPMI 1640 containing 10 μmol/L CFSE (Molecular Probes) at 37 °C for 10 min, washed, and resuspended in complete RPMI1640. Next, 2.5 × 10⁴ CFSE-labeled CD4+hCD2− cells and CD4+hCD2+ cells were cocultured with at indicated cell ratio in the presence of anti-CD3/CD28-coated beads (Dynabeads).
Microarray Analysis.
I-Ab+CD11c+CD103+ cells and I-Ab+CD11c+CD103− cells were sorted from the MLN of pooled Vβ8 Limited mice at 6–8 wk of age (n = 5–6), and collected directly into RA1 buffer containing mercaptoethanol from NucleoSpin RNA II (Macherey Nagel). Extracted RNA was amplified for two rounds using Ovation Pico/PicoSL WTA System V2 (NuGEN), followed by biotin labeling using the BioArray High Yield RNA Transcription Labeling kit (Enzo Diagnostics). The resulting cRNAs were hybridized to M430 2.0 chips (Affymetrix). Raw Cel files were background-corrected and RMA-normalized.
Cell Transfer Experiments.
For Treg cell transfer to Limited mice, 2.5–5 × 10⁵ FACS-sorted B220−CD11b−CD11c−NK1.1−CD8α−CD4+hCD2+ cells pooled from spleens, and other peripheral lymph nodes of Foxp3hCD2.wt or Cα+/o mice were intraveonously injected to Limited mice. For cotransfer of Tconv cells with Treg cell into Cαo/o mice, 8 × 10⁵ B220−CD11b−CD11c−NK1.1−CD8α−CD4+hCD2− cells with or without 4 × 10⁵ B220−CD11b−CD11c−NK1.1−CD8α−CD4+hCD2+ cells from Cα+/o or Limited mice were used. In all transfer experiments, cells were FACS-sorted after enrichment of CD4+ cells by CD4-microbeads (Miltenyi Biotec).
Statistical Analysis.
Statistical significance was evaluated using GraphPad Prism software (GraphPad) with unpaired two-tailed Student’s test or Mann–Whitney’s test.
Acknowledgments
We thank Drs. D. Mathis and C. Benoist for providing Limited mice; Drs. D.M., C.B., D.R. Littman, R.A. Flavell, and T. Yamagata for helpful discussions; and S. Chiba, M. Taniguchi, M. Sugahara, H. Tanabe, R. Fujii, K. Adachi, R. Takeda, and M. Shishido for technical assistance. This work was supported by CREST of the Japan Science and Technology Agency; a Grant-In-Aid for Scientific Research from the Ministry of Education, Culture, Sports, and Science; Life Science Foundation of Japan; the Research Foundation for Pharmaceutical Sciences; the Mishima Kaiun Memorial Foundation; the Yakult-Bioscience Foundation; and the Naito Foundation. The Department of Molecular Immunology is supported by BONAC Corporation and Kyowa Hakko Kirin Co., Ltd.
Footnotes
The authors declare no conflict of interest.
This article contains supporting information online at www.pnas.org/lookup/suppl/doi:10.1073/pnas.1516617112/-/DCSupplemental.
References
- 1.Morris GP, Allen PM. How the TCR balances sensitivity and specificity for the recognition of self and pathogens. Nat Immunol. 2012;13(2):121–128. doi: 10.1038/ni.2190. [DOI] [PubMed] [Google Scholar]
- 2.Adeegbe D, Matsutani T, Yang J, Altman NH, Malek TR. CD4(+) CD25(+) Foxp3(+) T regulatory cells with limited TCR diversity in control of autoimmunity. J Immunol. 2010;184(1):56–66. doi: 10.4049/jimmunol.0902379. [DOI] [PMC free article] [PubMed] [Google Scholar]
- 3.Föhse L, et al. High TCR diversity ensures optimal function and homeostasis of Foxp3+ regulatory T cells. Eur J Immunol. 2011;41(11):3101–3113. doi: 10.1002/eji.201141986. [DOI] [PubMed] [Google Scholar]
- 4.Hori S, Haury M, Coutinho A, Demengeot J. Specificity requirements for selection and effector functions of CD25+4+ regulatory T cells in anti-myelin basic protein T cell receptor transgenic mice. Proc Natl Acad Sci USA. 2002;99(12):8213–8218. doi: 10.1073/pnas.122224799. [DOI] [PMC free article] [PubMed] [Google Scholar]
- 5.Fontenot JD, Gavin MA, Rudensky AY. Foxp3 programs the development and function of CD4+CD25+ regulatory T cells. Nat Immunol. 2003;4(4):330–336. doi: 10.1038/ni904. [DOI] [PubMed] [Google Scholar]
- 6.Hori S, Nomura T, Sakaguchi S. Control of regulatory T cell development by the transcription factor Foxp3. Science. 2003;299(5609):1057–1061. doi: 10.1126/science.1079490. [DOI] [PubMed] [Google Scholar]
- 7.Abbas AK, et al. Regulatory T cells: Recommendations to simplify the nomenclature. Nat Immunol. 2013;14(4):307–308. doi: 10.1038/ni.2554. [DOI] [PubMed] [Google Scholar]
- 8.Curotto de Lafaille MA, Lafaille JJ. Natural and adaptive foxp3+ regulatory T cells: More of the same or a division of labor? Immunity. 2009;30(5):626–635. doi: 10.1016/j.immuni.2009.05.002. [DOI] [PubMed] [Google Scholar]
- 9.Shevach EM, Thornton AM. tTregs, pTregs, and iTregs: Similarities and differences. Immunol Rev. 2014;259(1):88–102. doi: 10.1111/imr.12160. [DOI] [PMC free article] [PubMed] [Google Scholar]
- 10.Atarashi K, et al. Induction of colonic regulatory T cells by indigenous Clostridium species. Science. 2011;331(6015):337–341. doi: 10.1126/science.1198469. [DOI] [PMC free article] [PubMed] [Google Scholar]
- 11.Lathrop SK, et al. Peripheral education of the immune system by colonic commensal microbiota. Nature. 2011;478(7368):250–254. doi: 10.1038/nature10434. [DOI] [PMC free article] [PubMed] [Google Scholar]
- 12.Samstein RM, Josefowicz SZ, Arvey A, Treuting PM, Rudensky AY. Extrathymic generation of regulatory T cells in placental mammals mitigates maternal-fetal conflict. Cell. 2012;150(1):29–38. doi: 10.1016/j.cell.2012.05.031. [DOI] [PMC free article] [PubMed] [Google Scholar]
- 13.Probst HC, Muth S, Schild H. Regulation of the tolerogenic function of steady-state DCs. Eur J Immunol. 2014;44(4):927–933. doi: 10.1002/eji.201343862. [DOI] [PubMed] [Google Scholar]
- 14.Kim JM, Rasmussen JP, Rudensky AY. Regulatory T cells prevent catastrophic autoimmunity throughout the lifespan of mice. Nat Immunol. 2007;8(2):191–197. doi: 10.1038/ni1428. [DOI] [PubMed] [Google Scholar]
- 15.Schildknecht A, et al. FoxP3+ regulatory T cells essentially contribute to peripheral CD8+ T-cell tolerance induced by steady-state dendritic cells. Proc Natl Acad Sci USA. 2010;107(1):199–203. doi: 10.1073/pnas.0910620107. [DOI] [PMC free article] [PubMed] [Google Scholar]
- 16.Qureshi OS, et al. Trans-endocytosis of CD80 and CD86: A molecular basis for the cell-extrinsic function of CTLA-4. Science. 2011;332(6029):600–603. doi: 10.1126/science.1202947. [DOI] [PMC free article] [PubMed] [Google Scholar]
- 17.Wing K, et al. CTLA-4 control over Foxp3+ regulatory T cell function. Science. 2008;322(5899):271–275. doi: 10.1126/science.1160062. [DOI] [PubMed] [Google Scholar]
- 18.Coombes JL, et al. A functionally specialized population of mucosal CD103+ DCs induces Foxp3+ regulatory T cells via a TGF-beta and retinoic acid-dependent mechanism. J Exp Med. 2007;204(8):1757–1764. doi: 10.1084/jem.20070590. [DOI] [PMC free article] [PubMed] [Google Scholar]
- 19.Sun CM, et al. Small intestine lamina propria dendritic cells promote de novo generation of Foxp3 T reg cells via retinoic acid. J Exp Med. 2007;204(8):1775–1785. doi: 10.1084/jem.20070602. [DOI] [PMC free article] [PubMed] [Google Scholar]
- 20.Miller JC, et al. Immunological Genome Consortium Deciphering the transcriptional network of the dendritic cell lineage. Nat Immunol. 2012;13(9):888–899. doi: 10.1038/ni.2370. [DOI] [PMC free article] [PubMed] [Google Scholar]
- 21.Furusawa Y, et al. Commensal microbe-derived butyrate induces the differentiation of colonic regulatory T cells. Nature. 2013;504(7480):446–450. doi: 10.1038/nature12721. [DOI] [PubMed] [Google Scholar]
- 22.Smith PM, et al. The microbial metabolites, short-chain fatty acids, regulate colonic Treg cell homeostasis. Science. 2013;341(6145):569–573. doi: 10.1126/science.1241165. [DOI] [PMC free article] [PubMed] [Google Scholar]
- 23.Correia-Neves M, Waltzinger C, Mathis D, Benoist C. The shaping of the T cell repertoire. Immunity. 2001;14(1):21–32. doi: 10.1016/s1074-7613(01)00086-3. [DOI] [PubMed] [Google Scholar]
- 24.Acha-Orbea H, MacDonald HR. Superantigens of mouse mammary tumor virus. Annu Rev Immunol. 1995;13:459–486. doi: 10.1146/annurev.iy.13.040195.002331. [DOI] [PubMed] [Google Scholar]
- 25.Shiobara N, et al. Bacterial superantigens and T cell receptor beta-chain-bearing T cells in the immunopathogenesis of ulcerative colitis. Clin Exp Immunol. 2007;150(1):13–21. doi: 10.1111/j.1365-2249.2007.03443.x. [DOI] [PMC free article] [PubMed] [Google Scholar]
- 26.Annunziato F, et al. Phenotypic and functional features of human Th17 cells. J Exp Med. 2007;204(8):1849–1861. doi: 10.1084/jem.20070663. [DOI] [PMC free article] [PubMed] [Google Scholar]
- 27.Cosmi L, et al. Human interleukin 17-producing cells originate from a CD161+CD4+ T cell precursor. J Exp Med. 2008;205(8):1903–1916. doi: 10.1084/jem.20080397. [DOI] [PMC free article] [PubMed] [Google Scholar]
- 28.Asquith M, Powrie F. An innately dangerous balancing act: Intestinal homeostasis, inflammation, and colitis-associated cancer. J Exp Med. 2010;207(8):1573–1577. doi: 10.1084/jem.20101330. [DOI] [PMC free article] [PubMed] [Google Scholar]
- 29.Elinav E, et al. NLRP6 inflammasome regulates colonic microbial ecology and risk for colitis. Cell. 2011;145(5):745–757. doi: 10.1016/j.cell.2011.04.022. [DOI] [PMC free article] [PubMed] [Google Scholar]
- 30.Garrett WS, et al. Communicable ulcerative colitis induced by T-bet deficiency in the innate immune system. Cell. 2007;131(1):33–45. doi: 10.1016/j.cell.2007.08.017. [DOI] [PMC free article] [PubMed] [Google Scholar]
- 31.Ivanov II, et al. Induction of intestinal Th17 cells by segmented filamentous bacteria. Cell. 2009;139(3):485–498. doi: 10.1016/j.cell.2009.09.033. [DOI] [PMC free article] [PubMed] [Google Scholar]
- 32.Belz GT, Nutt SL. Transcriptional programming of the dendritic cell network. Nat Rev Immunol. 2012;12(2):101–113. doi: 10.1038/nri3149. [DOI] [PubMed] [Google Scholar]
- 33.Broggi A, Zanoni I, Granucci F. Migratory conventional dendritic cells in the induction of peripheral T cell tolerance. J Leukoc Biol. 2013;94(5):903–911. doi: 10.1189/jlb.0413222. [DOI] [PubMed] [Google Scholar]
- 34.Diehl GE, et al. Microbiota restricts trafficking of bacteria to mesenteric lymph nodes by CX(3)CR1(hi) cells. Nature. 2013;494(7435):116–120. doi: 10.1038/nature11809. [DOI] [PMC free article] [PubMed] [Google Scholar]
- 35.Dambuza IM, Brown GD. C-type lectins in immunity: Recent developments. Curr Opin Immunol. 2015;32:21–27. doi: 10.1016/j.coi.2014.12.002. [DOI] [PMC free article] [PubMed] [Google Scholar]
- 36.Denning TL, et al. Functional specializations of intestinal dendritic cell and macrophage subsets that control Th17 and regulatory T cell responses are dependent on the T cell/APC ratio, source of mouse strain, and regional localization. J Immunol. 2011;187(2):733–747. doi: 10.4049/jimmunol.1002701. [DOI] [PMC free article] [PubMed] [Google Scholar]
- 37.Mucida D, et al. Reciprocal TH17 and regulatory T cell differentiation mediated by retinoic acid. Science. 2007;317(5835):256–260. doi: 10.1126/science.1145697. [DOI] [PubMed] [Google Scholar]
- 38.Rivollier A, He J, Kole A, Valatas V, Kelsall BL. Inflammation switches the differentiation program of Ly6Chi monocytes from antiinflammatory macrophages to inflammatory dendritic cells in the colon. J Exp Med. 2012;209(1):139–155. doi: 10.1084/jem.20101387. [DOI] [PMC free article] [PubMed] [Google Scholar]
- 39.Cebula A, et al. Thymus-derived regulatory T cells contribute to tolerance to commensal microbiota. Nature. 2013;497(7448):258–262. doi: 10.1038/nature12079. [DOI] [PMC free article] [PubMed] [Google Scholar]
- 40.Miyao T, et al. Plasticity of Foxp3(+) T cells reflects promiscuous Foxp3 expression in conventional T cells but not reprogramming of regulatory T cells. Immunity. 2012;36(2):262–275. doi: 10.1016/j.immuni.2011.12.012. [DOI] [PubMed] [Google Scholar]


