Significance
What is a number? The answer to this age-old and fundamental question of philosophy has increasingly benefited from recent scientific investigation using psychology and neuroscience. To verify the invariant nature of numerosity perception, we manipulated the numbers of items connected/enclosed in arbitrary and irregular forms while controlling for various low-level visual features in different tasks and across small and large numbers. Results were consistent with the topological account, namely that numbers were strongly influenced by topological invariants (connectivity and the inside/outside relationship): connecting/enclosing items led to robust numerosity underestimation, with the extent of underestimation increasing monotonically with the number of connected/enclosed items. Brain image results also provided evidence that numbers represented in the intraparietal sulcus were influenced by topology.
Keywords: number, numerosity perception, topological invariants, global-first topological perception, functional MRI adaptation
Abstract
What is a number? The number sense hypothesis suggests that numerosity is “a primary visual property” like color, contrast, or orientation. However, exactly what attribute of a stimulus is the primary visual property and determines numbers in the number sense? To verify the invariant nature of numerosity perception, we manipulated the numbers of items connected/enclosed in arbitrary and irregular forms while controlling for low-level features (e.g., orientation, color, and size). Subjects performed discrimination, estimation, and equality judgment tasks in a wide range of presentation durations and across small and large numbers. Results consistently show that connecting/enclosing items led to robust numerosity underestimation, with the extent of underestimation increasing monotonically with the number of connected/enclosed items. In contrast, grouping based on color similarity had no effect on numerosity judgment. We propose that numbers or the primitive units counted in numerosity perception are influenced by topological invariants, such as connectivity and the inside/outside relationship. Beyond the behavioral measures, neural tuning curves to numerosity in the intraparietal sulcus were obtained using functional MRI adaptation, and the tuning curves showed that numbers represented in the intraparietal sulcus were strongly influenced by topology.
What is a number? The answer to this age-old and fundamental question of philosophy has increasingly benefited from recent scientific investigation using psychology and neuroscience. The number sense hypothesis (1, 2) suggests that a number is “a basic property of the environment” (3) and particularly, because of its remarkable adaptation effect, “a primary visual property” (2), like color, contrast, or orientation (2–8). However, exactly what attribute in the environment is the primary property and determines numbers in the number sense, or more concretely, what is counted in numerosity perception? Consider the invariant nature of numerosity perception. It is self-evident that numerosity is invariant to specific features (e.g., orientation, size, shape, and color) of individual items to be counted. In other words, the primitive units to be counted must be invariant with variation in form dimensions and other visual features (2, 3, 7, 9–11). Then, the critical question becomes how to define precisely such abstract and invariant attributes.
Results
Generalizing Connection to a Topological Invariant: Connectivity.
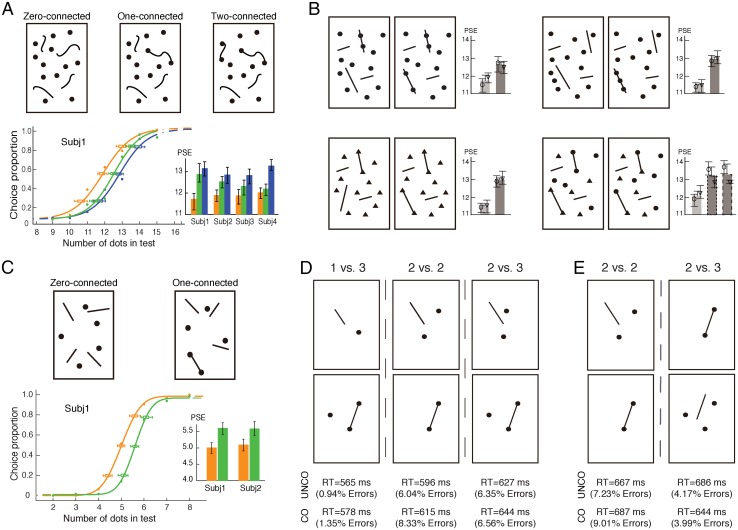
We designed arbitrary and irregular shapes of connecting line segments (Fig. 1A, Upper) to test the invariant effect of connection on numerosity judgement independent of the concrete forms or manners of connection (12, 13). Three conditions of connection were constructed: zero, one, and two connected pairs of dots in the test patterns (Fig. 1A). A typical numerosity discrimination task was adopted, in which two visual patterns of dots were briefly presented on opposite sides of fixation (one serving as a reference and the other one serving as a test), and subjects were asked to indicate which contained more dots. The reference patterns contained a fixed number of 12 dots, whereas the test patterns ranged from 9 to 15 dots. Results show that connecting dots led to robust numerosity underestimation, and the extent of underestimation increased monotonically with the number of connected dots, which was shown by the increased value in the point of subjective equality [PSE; PSEs = 12.01, 12.85, and 13.15, respectively; F(2,6) = 21.63; P < 0.006] (Fig. 1A, Lower). The psychometric functions for three conditions of connectivity were otherwise similar, with no significant differences in slope (0.261, 0.239, and 0.271, respectively; P > 0.49).
Fig. 1.
(A) Illustrations of the zero-, one-, and two-connected test patterns with 12 dots, the fitted psychometric functions of a representative subject, and the PSEs of four subjects for three connected conditions. Irregular lines were used to make connections between dots. The proportion of trials in which the test patterns were judged to contain more dots than the reference pattern is plotted against the actual number of dots in the test patterns. There is a rightward shift of the psychometric functions across the zero-, one-, and two-connected conditions. (B) Illustrations of test patterns in which a line segment protruded through two or three dots and triangles and mixtures of triangles and circular dots were used. Corresponding results are shown under each test pattern. Numerical underestimation was consistently found with all of these test patterns, which represented connectivity in different manners. (C) Illustrations of test patterns extending from large to small numbers (eight to two dots), psychometric functions of a representative subject, and the PSEs of two subjects. Only connected test patterns were illustrated here. (D) Illustrations of test patterns of small numbers (one to three dots). A pair of test patterns to be compared in the equality judgment is depicted vertically. (E) Illustrations of the “augmented 2 vs. 3” conditions. Test patterns are designed specifically to test against the “general difficulty” argument. In A and C, data from individual subjects are shown with their 95% confidence intervals. Orange, green, and blue indicate the zero-, one-, and two-connected conditions, respectively. In B, data from individual subjects are shown with their 95% confidence intervals as well as means and SEMs. The open symbols in B indicate individual subjects. The dark gray in B indicates the connected conditions. The dotted and dashed lines in B indicate the two test patterns connecting identical and different shapes, respectively. CO, connected; Subj, subject; UNCO, unconnected.
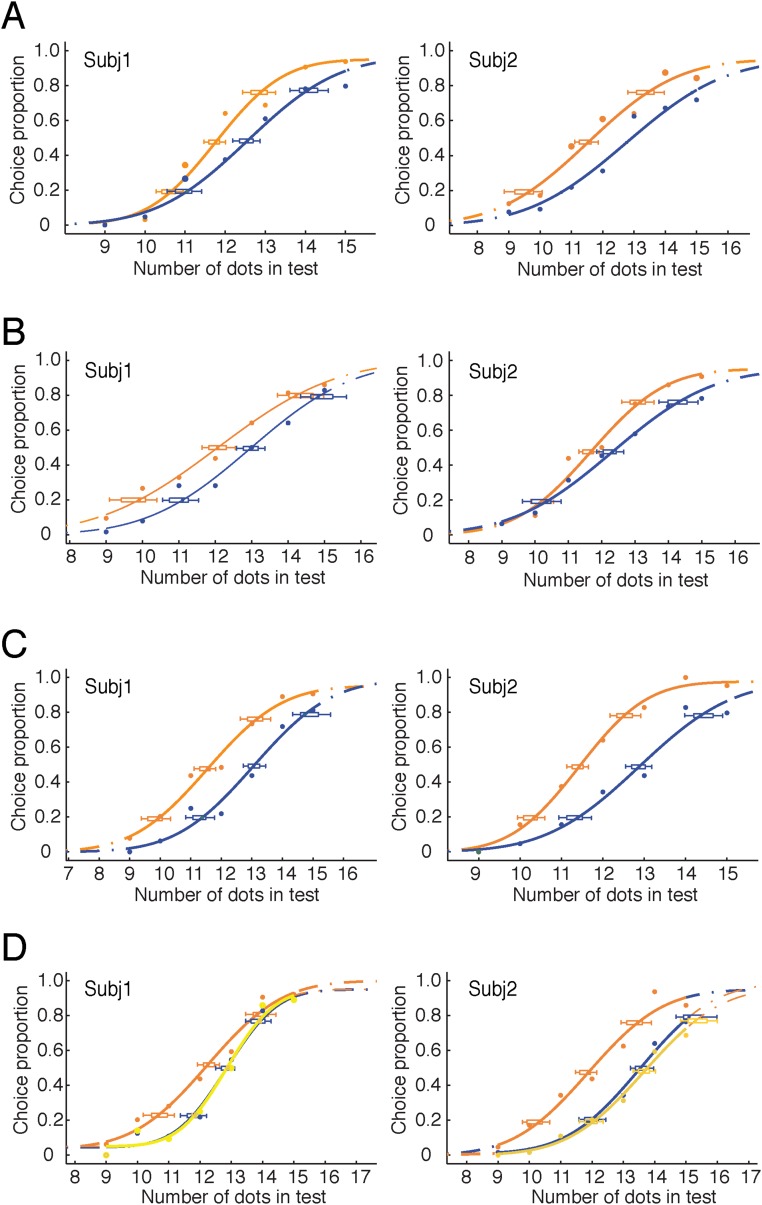
To further test the abstract and invariant nature of the effect of connection on numerosity, we varied the manners of connecting while controlling for the location and number of the dots on the connecting line segments. Connecting line segments protruded through rather than ended on dots (Fig. 1B, Upper Left), and three rather than two dots were connected by a single line segment (Fig. 1B, Upper Right). Regardless of the specific manners of connecting, these connections induced numerosity underestimation in all conditions (Fig. 1B, Upper and Fig. S1 A and B).
Fig. S1.
Data and fitted psychometric functions of individual subjects of four experiments in Fig. 1B. A–D show the results of the four experiments in Fig. 1B, Upper Left, Upper Right, Lower Left, and Lower Right, respectively. The data are shown with their 95% confidence intervals. Orange indicates the zero-connected condition, and both blue and yellow indicate the two-connected conditions. Subj, subject.
We also manipulated the shapes of items connected. In one condition, the reference patterns had circular dots, whereas the dots in the test patterns were changed to triangles (Fig. 1B, Lower Left). In another condition, both the reference and test patterns contained mixed circular dots and triangles, and in the test patterns, either two identical or two different shapes were connected (Fig. 1B, Lower Right); subjects were required to make their judgment based on dots and triangles together. Although different shapes were connected and the shapes remained clearly visible, results again showed numerosity underestimation because of connection (Fig. 1B, Lower and Fig. S1 C and D).
In the experiments above, we manipulated various forms and manners of connections and found robust and systematical numerosity underestimation because of connection. Such arbitrary and irregular forms of connections indicate that the intuitive notion of connection (12, 13) could be understood precisely and generally from the perspective of the invariants over shape change transformations. Topological transformation can be imagined as rubber sheet deformations but disallowing tearing apart or gluing together parts. Topological properties are the ones that remain unchanged by such continuous deformations. In this kind of rubber sheet distortion (smooth shape deformations), connectivity remains invariant and hence, is a topological property. This topological analysis led us to systematically manipulate the topological invariant of connectivity in configural processing (14–16) to measure its effect on numerosity judgments in the above experiments.
Generalizing to Another Topological Invariant: The Inside/Outside Relationship.
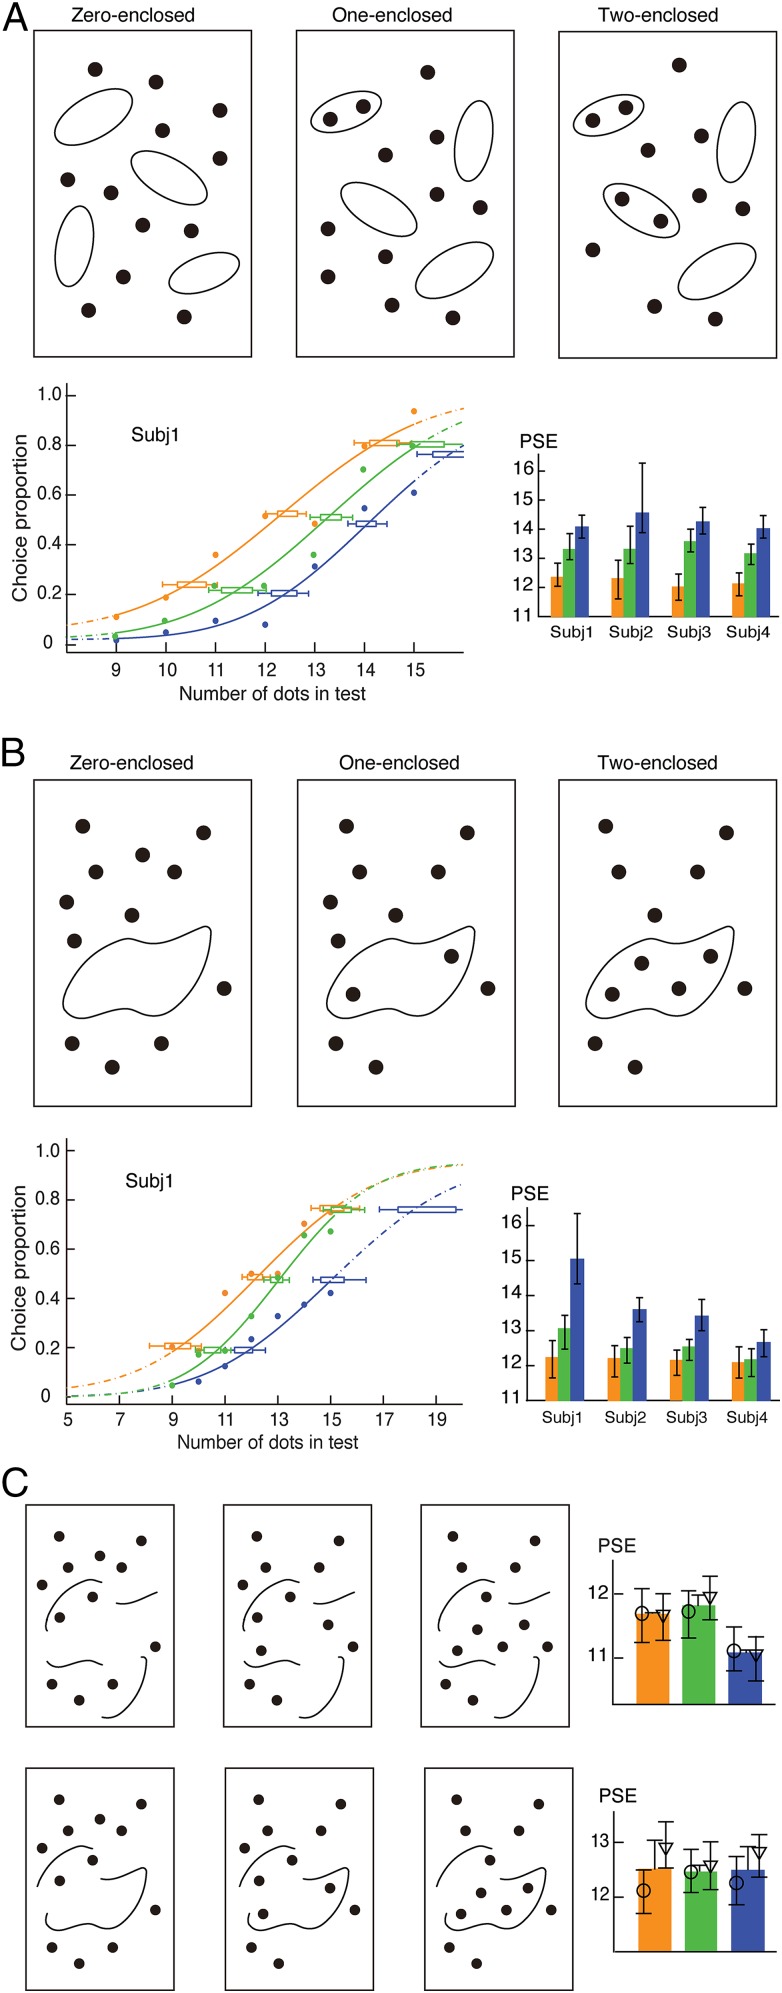
If the primitive units to be counted are essentially influenced by topology, we should predict more experimental phenomena that are not necessarily consistent with our intuition about numerosity perception but are consistent with topology. We tested the topological account further with another topological property (that is, the inside/outside relationship). Intuitively, the inside/outside relationship does not seem to have fundamental effect on numerosity. Nevertheless, the topological analysis predicts that enclosing dots, like connecting dots, might also lead to numerosity underestimation, because multiple dots enclosed within a hollow figure should be perceived as a holistic perceptual unit. Four randomly oriented ovals were distributed in the dot array, with zero, one, or two ovals each enclosing a pair of dots (Fig. 2A, Upper). Results showed that, when dots were enclosed in the ovals, an underestimation of numerosity occurred in a manner that directly depended on the number of enclosed dot pairs [PSEs = 12.19, 13.32, and 14.21, respectively; F(2,6) = 118.26; P < 0.001] (Fig. 2A, Lower). Again, no significant difference of the mean slopes of the psychometric functions was observed (0.157, 0.173 and 0.174, respectively; P > 0.46).
Fig. 2.
(A) Illustrations of the zero-, one-, and two-enclosed test patterns, the psychometric functions of a representative subject, and the PSEs of four subjects. Pairs of neighboring dots were enclosed by randomly oriented ovals. (B) Illustrations of test patterns with dots enclosed by irregular hollow figures (instead of ovals). (C) Illustrations of test patterns in which the inside/outside relationship was removed by breaking the enclosing shape. The enclosing shape was broken into four components; otherwise, the dot distributions are similar to those in A, Upper Left. For further minimizing changes caused by breaking the enclosing shape, only one of four components was moved, but the other three components remained unchanged (A, Lower Left). The results show that no dot underestimation was found under either condition (A, Upper Right and Lower Right). Data from individual subjects are shown with their 95% confidence intervals, and in C, data are also shown with their means and SEMs. The open symbols in C indicate individual subjects. Orange, green, and blue indicate the zero-, one-, and two-enclosed conditions, respectively, and in C, the three corresponding control conditions, respectively. Subj, subject.
According to topology, the inside/outside relationship remains invariant over shape change deformations. The numerosity underestimation caused by the inside/outside relationship should, therefore, survive changes in specific shapes of hollow figures. This principle was tested by replacing the regular oval with an irregular hollow figure (Fig. 2B, Upper). Enclosing zero, two, or four dots by the irregular hollow figure led, once again, to systematic numerosity underestimation [PSEs = 12.22, 12.62, and 13.68, respectively; F(2,6) = 10.72; P < 0.046], with no significant differences in the mean slopes of the psychometric functions (0.150, 0.176, and 0.171, respectively; P > 0.60) (Fig. 2B, Lower).
As a check, we removed the inside/outside relationship by breaking the enclosing contour into four segments while keeping the same dot locations as in Fig. 2B and minimizing changes of the contour in other geometrical features, such as distribution pattern and density (Fig. 2C, Upper Left). Under this condition, no underestimation was found (Fig. 2C, Upper Right). In one additional experiment, for further minimizing changes caused by breaking the enclosing contour, only one of four segments was moved (Fig. 2C, Lower Left). Nevertheless, underestimation was abolished after the inside/outside relationship was removed (Fig. 2C, Lower Right). Together, these results indicate that it is the inside/outside relationship, a topological invariant, that influences the numerosity underestimation.
Task Independence of Connectivity Effect: Numerosity Estimation.
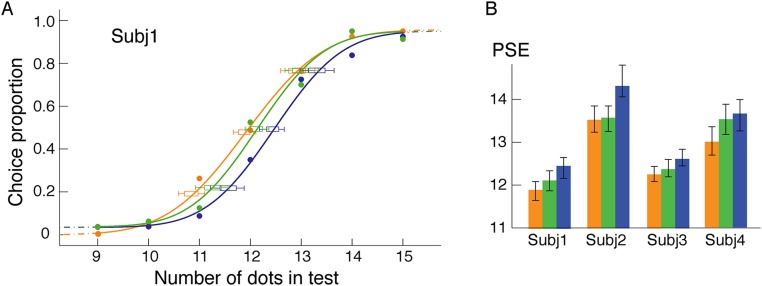
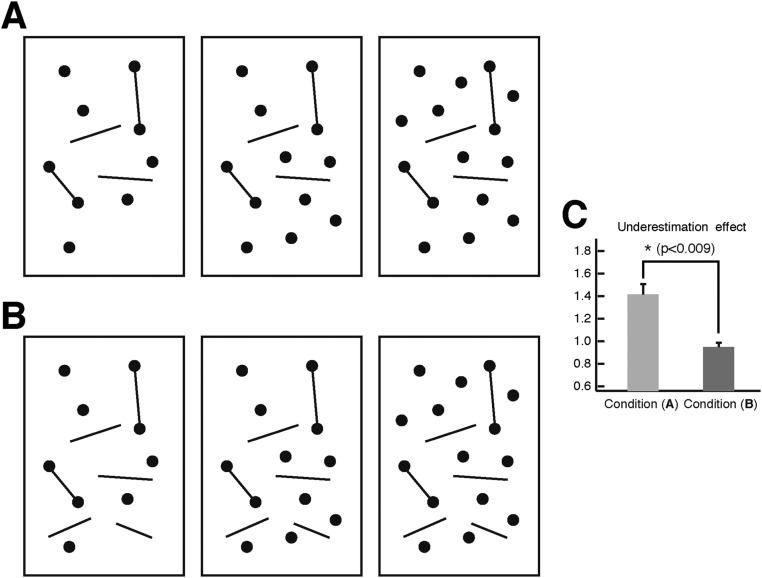
It might be argued that, in the numerosity comparison task performed in the above experiments, the comparison judgment could be confounded by other perceptual attributes of the displays, such as density or area, and other local features rather than being based on the actual representation of dot numerosity (17–24). We, therefore, used, instead of the comparison task, a subjective estimation task, which required observers to report the number of dots directly (19). If the topological account is generally valid, numerosity underestimation caused by connectivity should be task-independent. Results for this task again showed the connectivity effect: dot numerosity underestimation effects were proportional to the numbers of connected pairs of dots [PSEs = 12.68, 12.91, and 13.27, respectively; F(2,6) = 14.64; P < 0.009], and no significant differences in the mean slopes of the psychometric functions were observed (0.31, 0.32, and 0.31, respectively; P > 0.9) (Fig. S2).
Fig. S2.
Results obtained with the subjective estimation task. (A) Data and fitted psychometric functions of a representative subject. (B) PSEs of four subjects for the zero-, one-, and two-connected conditions; the three connected conditions are indicated by orange, green, and blue, respectively. Error bars indicate 95% confidence intervals of numerosity estimation. Subj, subject.
Set Size Independence of Connectivity Effect: Extending from Large to Small Numbers.
The generalizability of the connectivity effect on numerosity was tested across set sizes by reducing the number of dots tested into the range of two to eight (the reference pattern containing five dots), a range that spans the boundary between small and large numbers suggested by previous work (25–33). Simple straight line segments were used to connect dots (Fig. 1C). Once again, a reliable connectivity effect on numerosity discrimination was found (Fig. 1C).
We further zoomed into the typical range of small numbers (one to three dots) and used, as is typical for studying small numbers, reaction times (RTs) to measure the connectivity effect. In an equality judgment task, subjects were required to report whether the left and right dot arrays contained the same or different numbers of dots under either the zero- or one-connected condition (Fig. 1D). With respect to the “same” response to “2 vs. 2” (Fig. 1D, Middle), connecting the two dots changed the units to be counted into “1 vs. 2,” which made it difficult to arrive at the same response, resulting in a longer RT [F(1,11) = 12.53; P < 0.005]. With respect to the “different” response to “1 vs. 3” (Fig. 1D, Left) and “2 vs. 3” (Fig. 1D, Right), two-way ANOVA indicated that there were also significant effects of connectivity [F(1,11) = 20.77; P < 0.001] and numerical distance [F(2,22) = 16.08; P < 0.0004] but no interaction [F(2,22) = 0.194; P > 0.80]. The error data showed corroborating trends. Here, connecting two dots in the three-dot pattern led to a reduced effective numerical distance based on topological units (SI Results, Figs. S3 and S4, and Table S1), resulting in longer RTs compared with unconnected conditions.
Fig. S3.
Free-hanging lines, like dots, figure into numerosity judgments. (A) Illustrations of test patterns (9–15 dots) under two-connected conditions. (B) Two free-hanging lines added to each two-connected test. (C) The underestimation effect was measured by PSE difference between two- and zero-connected conditions. Compared with the underestimation for two-connected patterns with two free-hanging lines (light gray), adding two more free-hanging lines reduced the underestimation effect (dark gray). Error bars indicate SEMs.
Fig. S4.
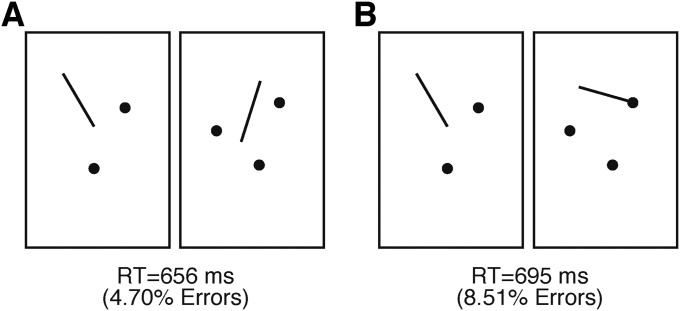
Illustrations of test patterns of small numbers (two vs. three dots) used in the equality judgment task. (A) Illustrations of the unconnected condition, in which no connection between dots and lines was made. (B) Illustrations of the connected condition, in which a pin-like item was made in the three-dot array by connecting a dot with a line segment.
Table S1.
| Probes | Zero-connected adaptors | Three-connected adaptors | ||
| Left IPS | Right IPS | Left IPS | Right IPS | |
| Three connected | 0.31 | 0.37 | 0.11 | 0.22 |
| Zero connected | 0.42 | 0.39 | 0.15 | 0.15 |
Connecting dots did not impair the precision of the numerical representations at the intraparietal sulcus. There is no significant difference in FWHMs between the three- and zero-connected probes (P > 0.55).
It might be argued that the longer RTs, consistently reported in the above experiment, may be caused by general difficulties produced by adding connecting lines onto dots but not caused by connectivity per se. To test against this point, we designed an augmented 2 vs. 3 condition, in which the two dots were connected while the three dots were unconnected (Fig. 1E, Right). If topological connectivity is important, this design will increase the effective numerical distance between the alternatives and should result in a shorter RT in the comparison task (34). The result for the 2 vs. 2 condition from the previous experiment was replicated (Fig. 1E, Left). Nevertheless, the augmented 2 vs. 3 condition, indeed, resulted in a shorter RT [F(1,13) = 5.72; P < 0.03] (Fig. 1E, Right) in contrast to the longer RT with the three-dot array, in which two dots were connected (Fig. 1D, Right). The error data showed corroborating trends. This result ruled out the argument of general difficulties. Together, results from the experiments (Fig. 1 D and E) support the topological account for small numbers as well.
Strong Topological Effects at Short Presentation Durations: Topological Precedence.
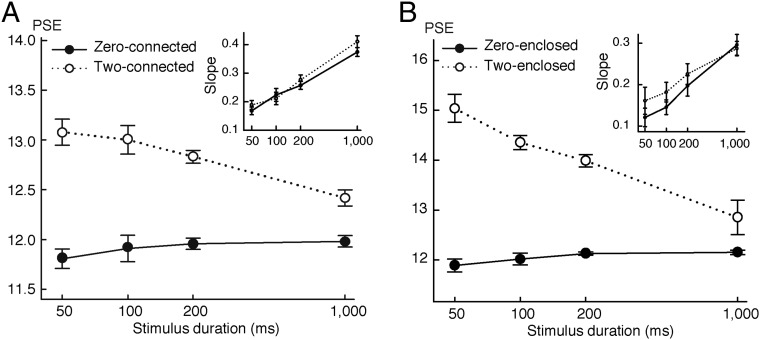
In numerosity perception, potentially different specific mechanisms of numerosity judgment may be engaged at different temporal scales (35, 36). The above experiments mostly used presentation durations of only 200 ms. We extended the temporal span to 50, 100, 200, and 1,000 ms to investigate the time dependence of topological effects on numerosity perception. The stimuli and procedures were otherwise the same as in the experiments (Fig. 1A). In the zero-connected condition, the perceived dot numerosity (PSEs) remained constant across four presentation durations [F(3,15) = 0.89; P > 0.43], whereas in the two-connected condition, underestimation was observed across all four durations [F(1,5) = 55.85; P < 0.001]. More interestingly, however, the underestimation effect interacted with presentation duration [F(3,15) = 13.59; P < 0.001] was strongest at the shortest duration, gradually decreasing with increasing durations (Fig. 3A). The slopes of the psychometric functions increased with duration [F(3,15) = 45.07; P < 0.0003] but were not significantly different between the zero- and two-connected conditions [F(1,5) = 2.04; P > 0.21] (Fig. 3A, Inset).
Fig. 3.
PSEs and slopes of the psychometric functions (Insets) for (A) zero- and two-connected conditions and (B) zero- and two-enclosed conditions at four presentation durations (50, 100, 200, and 1,000 ms). Error bars indicate SEMs.
We also extended the temporal span of stimulus presentation in the inside/outside conditions. Zero- and two-enclosed conditions behaved similarly to zero- and two-connected conditions, respectively (Fig. 3B). The underestimation effect in the two-enclosed condition was strongest at the shortest duration, gradually decreasing with increasing durations [F(3,15) = 12.62; P < 0.01] (Fig. 3B). The slopes of the psychometric functions increased with duration [F(3,15) = 72.16; P < 0.001] but were not significantly different between the zero- and two-enclosed conditions [F(1,5) = 2.92; P > 0.14] (Fig. 3B, Inset).
The finding that the strongest topological effect occurred at the shortest presentation duration may seem counterintuitive, but it is consistent with the “global-first” theory of topological perception. [The global-first theory of topological perception holds that a primitive and general function of the visual system is the perception of topological properties. The time dependence of perceiving form properties is systematically related to their structural stability under change in a manner similar to the Klein hierarchy of geometries: in a descending order of stability (from global to local), topological, projective, affine, and Euclidean invariants (15, 37). A basic point of the global-first theory is that a more stable property would be more primitive and more important to be extracted early in the cognitive process, and topological properties are the most stable properties in relation to other geometrical properties and extracted early to serve as the starting point of object perception. With respect to the relation between topological perception and perception of local features as well as the relation between bottom-up and top-down processes, the strength of the topological account is reflected in its bottom-up and task-irrelevant nature, overriding the top-down tasks based on local features.]
Lack of Effect of Color Grouping on Numerosity Judgments.
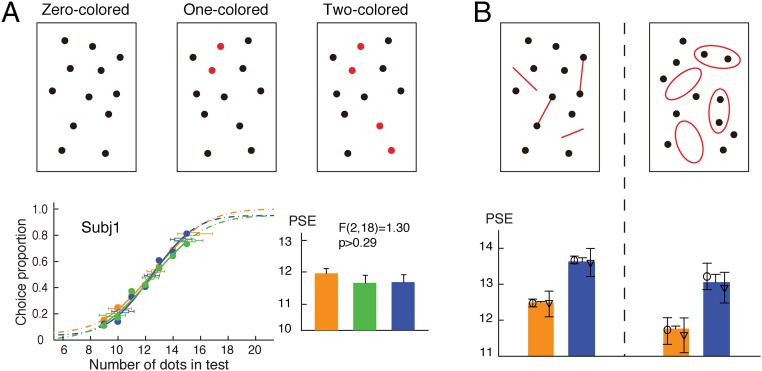
One might argue that the numerosity-related effects observed in the above experiments are just because of general Gestalt-like grouping and are not specific to topological invariants (connectivity and inside/outside relationship). If this argument were true, color, as a salient grouping cue, would affect numerosity judgment. We, therefore, tested the effect of color-based grouping on numerosity judgment. Instead of connecting pairs of dots, we colored pairs of neighboring dots red (Fig. 4A). Otherwise, the stimuli and procedure were the same as in the experiment in Fig. 1A. Despite the obvious grouping effect produced by color, no numerosity underestimation effect was observed under the color grouping conditions [F(2,18) = 1.30; P > 0.28] (Fig. 4A). This result is consistent with a previous report that, in static displays, color similarity had no effect on numerosity (38). This result indicates that it is the topology-defined units per se rather than clusters of general grouping based on similarity that are counted in numerosity judgment.
Fig. 4.
(A) Illustrations of test patterns with zero, one, and two pairs of neighboring dots colored, psychometric functions of a representative subject, and average PSEs of 10 subjects. Pairs of neighboring dots are colored red. Upper Left also illustrates a sample of the reference patterns. (B) Illustrations of test patterns using red-colored connecting lines and enclosing hollow figures. Corresponding results are shown under each test pattern. Numerical underestimation remained under both conditions. Data from individual subjects are shown with their 95% confidence intervals as well as their means and SEMs. The open symbols in B indicate individual subjects. Orange, green, and blue indicate the zero-, one-, or two-colored conditions, respectively. Subj, subject.
Furthermore, instead of using color similarity to promote grouping of pairs of dots, we introduced a color difference to disturb grouping based on connectivity and the inside/outside relationship to see if topological units could survive the disruption of grouping by color. Red-colored connecting lines and hollow figures were used (Fig. 4B). The stimuli and procedures were otherwise the same as in the experiments (Figs. 1A and 2A, respectively). The connected and connecting parts or the enclosed and enclosing parts differed in color, which intuitively at the phenomenal level, would reduce the grouping of two neighboring dots based on connectivity and the inside/outside relationship. Nevertheless, there was no noticeable color-induced reduction in the underestimation effect caused by the topological relations (Fig. S5). Together, these experiments with color manipulations show that the numerosity underestimation was based on the topology-defined units rather than caused by a general grouping effect.
Fig. S5.
Data and fitted psychometric functions of individual subjects of two experiments in Fig. 4B. A and B show the results of the two experiments in Fig. 4B, Left and Right, respectively. The data are shown with their 95% confidence intervals. Orange and blue indicate the zero- and two-colored conditions, respectively. Subj, subject.
Neural Response in the Intraparietal Sulcus to Topology-Defined Numerosity Units: Functional MRI Adaptation Study.
We also investigated the neural correlates of topology-defined numerosity units. Neural activation was assessed in the lateral intraparietal sulcus (IPS), which is commonly considered responsible for numerical representation (4, 39–53), using an established method of functional MRI (fMRI) adaptation for the study of numerosity perception (4).
Neural tuning curve shift caused by connectivity in probes.
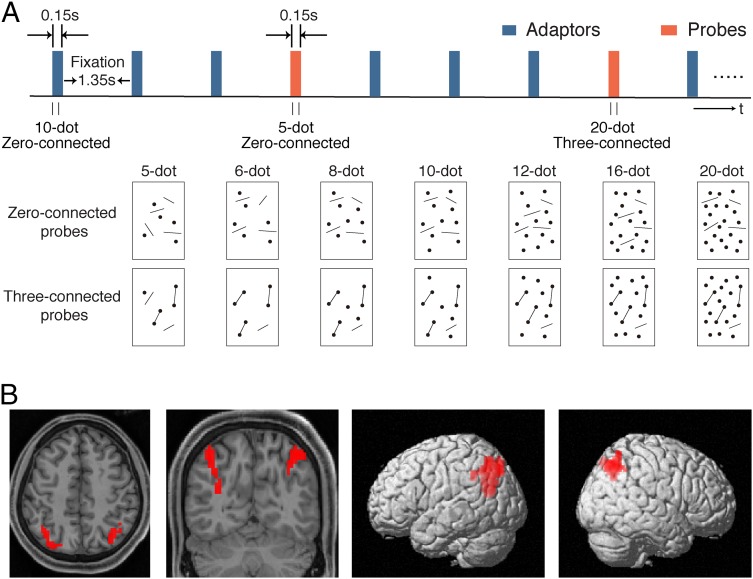
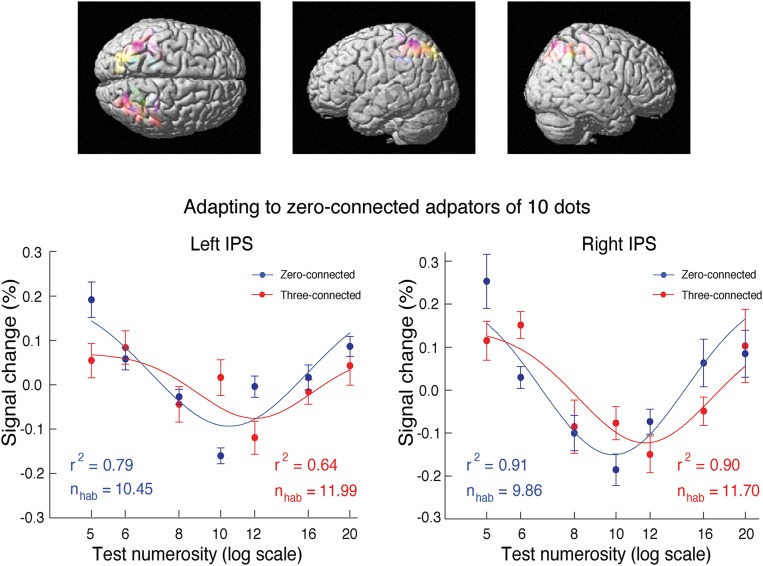
Subjects were adapted to continuously refreshed reference patterns of 10 dots with no dots connected (zero-connected) and tested with occasional interpolated probes containing variable numbers of dots (5, 6, 8, 10, 12, 16, or 20). These probes included two connected conditions: zero and three connected pairs of dots (Fig. 5A). In the intraparietal sulcus, a cluster of voxels showing an fMRI numerosity adaptation effect was identified for each participant using data from the zero-connected condition by contrasting fMRI activation to probes of 5 and 20 dots with that to probes of 10 dots (Fig. 5B). In the identified cluster (Table S2), the fMRI activation for zero-connected probes showed classical U-shaped adaptation curves as expected (4), with reduced activation near 10, the dot number of the adaptor: in the Gaussian fits (Fig. 6), the minimum in activation is found at 10.45 in the left intraparietal sulcus (r2 = 0.79) and 9.86 in the right intraparietal sulcus (r2 = 0.91). With the three-connected probes, U-shaped adaptation curves were also obtained; importantly, however, these curves were shifted systematically rightward, with the lowest activation occurring at 11.99 in the left intraparietal sulcus (r2 = 0.64) and 11.70 in the right intraparietal sulcus (r2 = 0.90) without a loss of precision as indexed by the similar widths of the tuning curves (Fig. 6). Thus, connection of dot pairs leads to a decrease of encoded numerosity in the intraparietal sulcus.
Fig. 5.
(A, Upper) Schematic description of the fMRI adaptation protocol and (A, Lower) illustration of probes containing 5–20 dots. Zero- and three-connected adaptors were actually the same as the zero- and three-connected probes containing 10 dots, respectively. Subjects were adapted to the zero- or three-connected 10-dot adaptors and tested with the zero- and three-connected probes containing variable numbers of dots. (B) Cluster of voxels sensitive to numerosity adaptation in the intraparietal sulcus from one representative subject shown on (Left) axial and coronal anatomical images and (Right) 3D-rendered lateral views. The voxels were defined by contrasting the activation of the zero-connected probes of 5 and 20 dots vs. the zero-connected probes of 10 dots.
Table S2.
Talairach coordinates of ROIs of individual subjects in Fig. 6
| Subject | Left intraparietal sulcus | Right intraparietal sulcus | ||||
| x | y | z | x | y | z | |
| 1 | −38 | −50 | 32 | 32 | −63 | 40 |
| 2 | −32 | −54 | 37 | 9 | −60 | 44 |
| 3 | −21 | −66 | 50 | 21 | −40 | 42 |
| 4 | −24 | −77 | 41 | 26 | −69 | 50 |
| 5 | −21 | −45 | 63 | 34 | −60 | 49 |
| 6 | −35 | −44 | 60 | 29 | −44 | 58 |
| 7 | −32 | −69 | 44 | 32 | −69 | 45 |
| 8 | −41 | −54 | 43 | 34 | −59 | 33 |
| 9 | −46 | −39 | 36 | 35 | −37 | 35 |
| 10 | −27 | −34 | 44 | 34 | −59 | 42 |
| 11 | −24 | −67 | 41 | 23 | −51 | 40 |
| 12 | −38 | −58 | 48 | 20 | −72 | 50 |
| Mean | −32 | −55 | 45 | 27 | −57 | 44 |
| SD | 7.80 | 12.52 | 8.74 | 7.50 | 11.12 | 6.79 |
Fig. 6.
(Upper) Region of interest (ROI) with high sensitivity for numerosity adaptation effect identified in individual participants in the intraparietal sulcus and (Lower) the corresponding blood oxygen level-dependent (BOLD) response to variable probes under adaptation. After adapting to the zero-connected adaptors, the curves for the three-connected probes were shifted systematically rightward compared with those for the zero-connected probes. Different colors depict ROIs of different subjects. Error bars indicate SEMs of individual subjects. nhab, estimated effective adaptor number; r2, goodness of fitting.
Neural tuning curve shift caused by connectivity in adaptors.
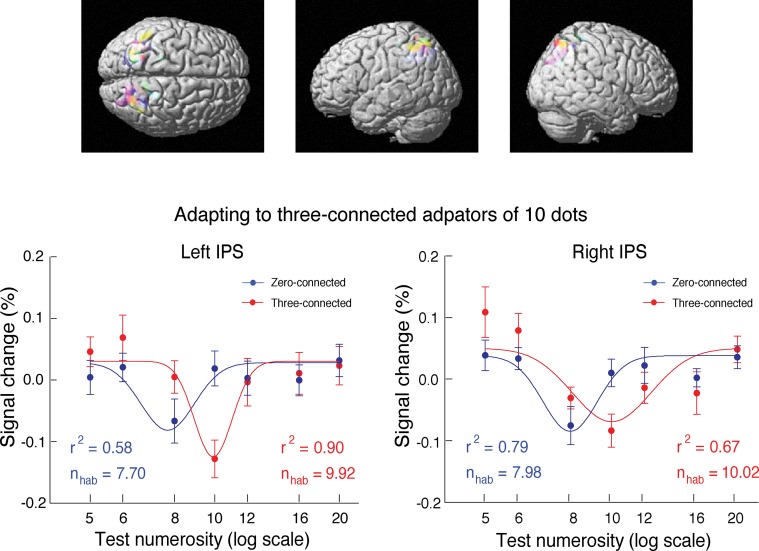
The three-connected 10-dot patterns were also used as the adaptors (Fig. 5A). Otherwise, the stimuli and procedures were the same as in the condition of zero-connected adaptors. For the three-connected probes, the strongest adaptation occurred when the probe had the same number of dots as the adaptors, with the lowest activation at 9.92 in the left intraparietal sulcus (r2 = 0.90) and 10.02 in the right intraparietal sulcus (r2 = 0.67) (Fig. 7). Importantly, for the zero-connected probes among the three-connected 10-dot adaptors, the strongest adaptation occurred below the number 8, approaching the number of connected units in the adaptors [7.70 in the left intraparietal sulcus (r2 = 0.58) and 7.98 in the right intraparietal sulcus (r2 = 0.79)] (Fig. 7 and Table S3). These fMRI results together showed that the process of adaptation in the intraparietal sulcus was influenced by connectivity and not purely by the number of dots per se. Thus, behavioral measures as well as fMRI adaptation provided converging evidence supporting the hypothesis that the primitive units counted in numerosity perception are influenced by topological invariants.
Fig. 7.
(Upper) ROI with high sensitivity for numerosity adaptation effect identified in individual participants in the intraparietal sulcus and (Lower) the corresponding BOLD response to variable probes under adaptation. After adapting to the three-connected adaptors, the curves for the zero-connected probes were shifted systematically leftward compared with those for the three-connected probes. Different colors depict ROIs of different subjects. Error bars indicate SEMs of individual subjects. nhab, estimated effective adaptor number; r2, goodness of fitting.
Table S3.
Talairach coordinates of ROIs of individual subjects in Fig. 7
| Subject | Left intraparietal sulcus | Right intraparietal sulcus | ||||
| x | y | z | x | y | z | |
| 1 | −18 | −62 | 41 | 15 | −68 | 41 |
| 2 | −32 | −62 | 49 | 26 | −66 | 28 |
| 3 | −21 | −41 | 51 | 18 | −46 | 57 |
| 4 | −38 | −58 | 48 | 34 | −59 | 42 |
| 5 | −35 | −47 | 34 | 26 | −69 | 50 |
| 6 | −32 | −55 | 31 | 12 | −73 | 35 |
| 7 | −21 | −66 | 50 | 10 | −61 | 51 |
| 8 | −32 | −61 | 33 | 10 | −52 | 56 |
| 9 | −24 | −76 | 43 | 21 | −69 | 30 |
| 10 | −21 | −57 | 55 | 20 | −72 | 50 |
| 11 | −27 | −71 | 48 | 23 | −71 | 47 |
| 12 | −32 | −60 | 49 | 23 | −65 | 39 |
| Mean | −28 | −60 | 44 | 20 | −64 | 44 |
| SD | 6.21 | 9.07 | 7.60 | 7.03 | 7.87 | 9.08 |
SI Results
Multiple Dots Connected or Enclosed Are Organized into One Single Gestalt Rather than One Single Dot (or Feature).
No claim was made by the topological theory that dots connected by a line or enclosed by an oval would be counted as “one single dot (or feature)” but rather, as “one single holistic unit” or a Gestalt. Just like proximity organization, in which items closer to each other are grouped into a Gestalt but still individually visible and discriminable, the phenomenon that two dots connected or enclosed form a single holistic unit does not mean that the two dots become one indistinguishable dot or feature. In the example of two eyes inside a face, they do not become one eye, but the essence is that they belong to the same single face, which means that topology talks about abstract invariance, such as grouping together and belongingness.
Dots Connected with Lines Are Still Visible and Could Be Counted (Not Rejected or More Difficult to Count).
To clarify, subjects were simply asked to count the dots without particular emphasis on whether the dots were free standing or connected to a line. Given the size of the dots and the width of the lines, dots connected to lines were still clearly visible as dots (i.e., dots were not simply masked by lines). In all of our experiments, no subjects raised the question of whether to count the dots connected to a line.
The extensive data from our experiments did not support that the numerosity underestimation of the dots was caused by the probability with which subjects falsely rejected the dots when they were on lines. In these experiments, adding connecting or enclosing lines did not affect the slopes of psychometric functions (Figs. 1A and 2 A and B and Fig. S2) or the tuning curve widths (Figs. 6 and 7 and Table S1), which both reflect the precision of the dot numerosity representation. The results that there is no change in slopes of psychometric function (Figs. 1A and 2 A and B and Fig. S2) mean that connecting dots by lines did not reduce the dot discriminability and that subjects consistently and stably underestimated the number of dots without suffering from reduced precision.
Additionally, the RT data presented in Fig. 1 D and E testing smaller numbers of dots show that, depending on their topological organization, adding lines could lead to increased RT in some conditions (Fig. 1D) and reduced RT in other conditions (Fig. 1E); thus, a general increased difficulty could not be the explanation for the effect of adding lines and connecting dots.
Moreover, in our experiments investigating the effect of enclosing dots with hollow contours, dots were not connected to lines, but the enclosure of dots also led to the numerosity underestimation. The results are consistent with the topological interpretation but certainly inconsistent with the explanation of reduced visibility or false rejection of dots because of connecting lines.
Line Segments, Like Dots, Figure into Numerosity Judgment.
It may be argued that, according to topology, a line segment itself would be the same topological unit as a dot. Then, an interesting as well as challenging question is does a line segment, like a dot, also figure into numerosity judgments, although the explicit task is to report the number of dots presented? Our experiments, indeed, showed that line segments as topological units, like dots, figure into numerosity judgments. The strength of the topological account is reflected in its bottom-up and task-irrelevant nature. Despite the fact that the free-hanging lines are not what subjects were asked to count (they were asked to count the number of dots), the bottom-up driven and task-irrelevant holistic units, including free-hanging lines, still override the top-down task of counting the dots, leading to numerosity underestimation.
This topological account of numerosity leads to an additional analysis of a previous experiment (12), in which, for keeping the number of free-hanging lines constant in each display, two free-hanging lines were added to the two-connected test patterns (Fig. S3 A and B). The results supported the topological account: here, additional free-hanging lines would increase the effective number of topological units, reducing the difference in numbers of topological units between the zero- and two-connected patterns and accordingly, resulting in a weaker underestimation effect compared with the original two-connected patterns [F(1,5) = 17.40; P < 0.009] (Fig. S3C). This result indicated that line segments, indeed, contributed to the dot number judgment.
One more experiment extended this topological account to small numbers (2 vs. 3 dots). Under the connected condition, in the three-dot display, a line segment was connected to one dot, forming a pin-like item (Fig. S4B, Right). Under the unconnected condition, no connection was made between dots and lines (Fig. S4A). Subjects were required to report whether two arrays of dots contained the same or different numbers of dots, with RT as a dependent measure. The result showed that the connection of a line segment to a dot, forming a pin-like item, resulted in a slower RT compared with the unconnected condition [695 ms (8.51% errors) vs. 656 ms (4.70% errors); P < 0.009]. This result indicated that a line segment and a pin, like a dot, indeed figured into the numerosity judgment. Based on the connected units, the numerosity comparison in Fig. S4B, Right was “3 vs. 3,” which would induce a tendency to respond same, whereas the actual numbers of dots were 2 vs. 3 and need to be responded as different. This response incongruity (55), therefore, led to the slower RT. Clearly, there was underestimation caused by connecting a dot to a line segment. The same trend was observed in a previous study (12). Possibly, a larger proportional change in numbers of connected items (caused by the smaller numbers of dots tested) and the response incongruity made the effect more noticeable in this experiment.
These results consistently showed that, although they differ greatly in local features, dots, line segments, and pins, as topological units defined by connectivity, all contribute to numerosity perception.
Discussion
The results of this series of behavioral and fMRI experiments supported the topological account: connecting or enclosing items led to robust numerosity underestimation and neural tuning curve shift, and the extent of underestimation increased monotonically with the number of connected or enclosed items. In contrast, coloring items had no effect on numerosity judgments and neural tuning curves (SI Discussion, Fig. S6, and Tables S4 and S5).
Fig. S6.
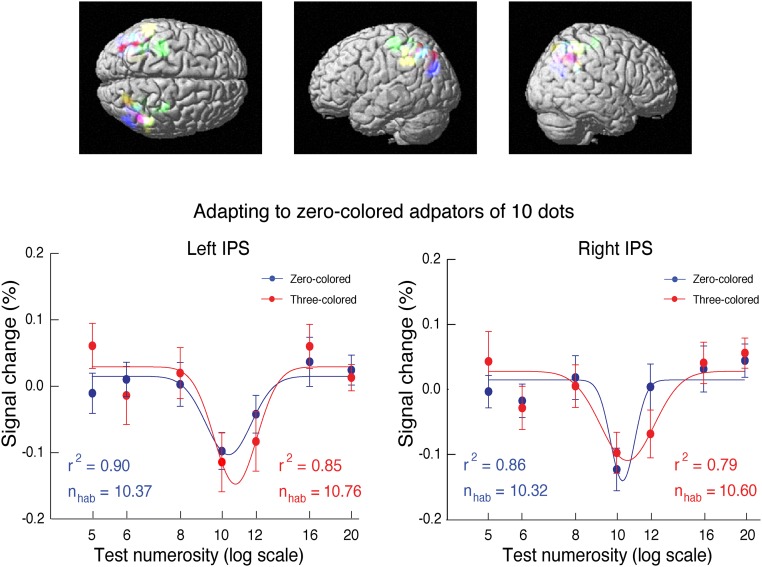
(Upper) ROI with high sensitivity for numerosity adaptation effect identified in individual participants in the intraparietal sulcus and (Lower) the corresponding BOLD response to variable probes under adaptation. After adapting to the zero-colored adaptors, the curves for the three-colored probes were not significantly shifted rightward compared with those for the zero-colored probes. Different colors depict ROIs of different subjects. Error bars indicate SEMs of individual subjects. nhab, estimated effective adaptor number; r2, goodness of fitting.
Table S4.
FWHM of tuning curves for the three- and zero-colored probes in fMRI adaptation (Fig. S6)
| Probes | Zero-colored adaptors | |
| Left IPS | Right IPS | |
| Three connected | 0.12 | 0.15 |
| Zero connected | 0.12 | 0.07 |
Coloring dots in probes did not impair the precision of the numerical representations at the intraparietal sulcus. There is no significant difference in FWHMs between the three- and zero-colored probes (P > 0.31).
Table S5.
Talairach coordinates of ROIs of individual subjects in Fig. S6
| Subject | Left intraparietal sulcus | Right intraparietal sulcus | ||||
| x | y | z | x | y | z | |
| 1 | −42 | −61 | −36 | 42 | −49 | 34 |
| 2 | −24 | −55 | 34 | 24 | −68 | 54 |
| 3 | −45 | −43 | 42 | 48 | −46 | 39 |
| 4 | −42 | −75 | 32 | 48 | −66 | 43 |
| 5 | −33 | −27 | 55 | 33 | −19 | 57 |
| 6 | −50 | −57 | 48 | 39 | −52 | 34 |
| 7 | −50 | −32 | 22 | na | na | na |
| 8 | −53 | −46 | 36 | 56 | −43 | 31 |
| 9 | −33 | −54 | 42 | 36 | −54 | 53 |
| 10 | −45 | −52 | 23 | 42 | −60 | 40 |
| 11 | −27 | −66 | 32 | 27 | −63 | 37 |
| 12 | −36 | −48 | 53 | 27 | −45 | 42 |
| 13 | −39 | −60 | 48 | 42 | −60 | 48 |
| 14 | −48 | −39 | 55 | 50 | −36 | 52 |
| 15 | −59 | −36 | 47 | 53 | −45 | 50 |
| 16 | −27 | −42 | 47 | 48 | −51 | 53 |
| Mean | −41 | −50 | 36 | 41 | −50 | 42 |
| SD | 9.84 | 12.49 | 21.21 | 9.57 | 12.22 | 13.37 |
na, not available.
The general validity of the topological account was strengthened by testing different kinds of topological invariants: connectivity and the inside/outside relationship. Intuitively, the inside/outside relationship does not seem to have a fundamental effect on numerosity. Nevertheless, enclosing the items caused the same underestimation as connectivity. This result may seem counterintuitive but is predicted by the topological account, because the inside/outside relationship and connectivity both are topological invariants, although they look quite different in configuration. Furthermore, the general and abstract natures of topological invariance of connectivity and the inside/outside relationship were highlighted by the robust effects observed across many different manners of connecting and enclosing, including with arbitrary and irregular forms (Figs. 1, 2, 4B, and 5A and Figs. S2–S4), protruding through (not only ending on) dots (Fig. 1B), connecting one or three (not only a pair of) dots by a single line (Fig. 1B and Fig. S4), and coloring connecting or enclosing lines (Fig. 4B), while controlling for various nontopological and low-level visual features, such as dot distribution and item shapes.
The general validity of the topological account was also supported by the facts that the presence of the topological effect on numerosity is task-independent, time-independent, and set size-independent, which was revealed in this study. The task independence of topological effect on numerosity was shown by the fact that the subjects performed the discrimination task (Figs. 1 A–C, 2, 3, and 4), the estimation task (Fig. S2), the equality judgment task (Figs. 1 D and E and Fig. S4), and the fMRI adaptation task (Fig. 5A and Fig. S6) in different experiments with PSEs or RTs as dependent measures. The time independence of the presence of the topological effect was shown by the wide range of presentation durations (from 50, 100, and 200 to 1,000 ms), in all of which numerosity underestimation was observed. The presence of the topological effect at the short presentation durations (<200 ms) also rules out an eye movement explanation of the effects. The set size independence was shown by the range of dot numbers tested, which was across the boundary of small and large numbers. In contrast, the color-based grouping had no significant effect on numerosity underestimation. This result supported the general validity of the topological account from another perspective, namely that the units to be counted are influenced by topological organization per se rather than general Gestalt-like similarity grouping.
Beyond the behavioral measures, the neural tuning curves to numerosity obtained from fMRI adaptation show that the numerosity units represented in intraparietal sulcus were influenced by topology. Importantly, the fMRI adaptation results revealed the neural basis of the behavioral observation and provided converging evidence supporting the topological account. Because the intraparietal sulcus is not directly sensitive to low-level image features, these results have the additional advantage of being free from low-level and nontopological feature confounds (2, 20, 21).
A major challenge to the topological account might be that the underestimation is because of general visual degradation or increased task difficulty caused by adding connecting or enclosing lines rather than because of the reduction of the numbers of topology-defined units per se. This interpretation can be rejected for the following reasons. In the experiment in which RT was measured (Fig. 1E), adding line segments to make connections led to shorter RTs in the numerosity comparison judgments (because of the increase of the effective numerical distance determined by connectivity-defined units), despite the possibility that adding connecting lines might increase the general visual difficulty. Also, in these behavioral and fMRI experiments, adding connecting or enclosing lines did not affect the slope of psychometric functions (Figs. 1A and 2 A and B), reflecting the precision of the dot numerosity representation. Notably, in the experiments extending the temporal span of presentation (Fig. 3), while the slope of the psychometric functions increased with duration, the slopes were not different between the connected and unconnected conditions (Fig. 3, Insets). These results mean that, in these experiments, connecting dots by lines did not reduce the dot discriminability and that subjects consistently and reliably underestimated the number of dots without suffering from reduced precision.
In summary, the topological approach has allowed the fundamental philosophical question of what is a number to be studied using psychology and neuroscience in a precise and concrete way as shown in this series of behavioral as well as fMRI experiments. The results lead to the intriguing suggestion that numerosity, a basic property of the environment (1, 3) and a primary visual property (2), may be formally described in terms of topological invariants.
SI Discussion
To further rule out the argument based on general Gestalt-like grouping against the topological account, the color-based grouping effect on neural tuning curves to numerosity in the intraparietal sulcus (IPS) was measured with one more fMRI adaptation experiment. Instead of connecting three pairs of dots (Fig. 5A), we colored the corresponding three pairs of dots red, and we also left out all of the line segments. Otherwise, the stimuli and procedure were the same as in the above fMRI adaptation experiments used to measure the neural tuning curve shift caused by connectivity in probes (Fig. 5A). Thus, in this fMRI adaptation experiment, the adaptors contained 10 dots with the same color, and the probes contained variable numbers of dots (5, 6, 8, 10, 12, 16, or 20). These probes included two conditions: zero- and three-colored pairs of dots.
fMRI adaptation tuning curves were obtained with a similar procedure as that shown in Fig. 6. In contrast to the tuning curve shift observed with connecting dots in probes, here, coloring dots in probes did not yield significant tuning curve shift. The fMRI activation for zero-colored probes showed classical U-shaped adaptation curves: in the Gaussian fits (Fig. S6), the minimum in activation is found at 10.37 in the left intraparietal sulcus (r2 = 0.90) and 10.32 in the right intraparietal sulcus (r2 = 0.86). With the three-colored probes, U-shaped adaptation curves were also obtained; however, these curves were not systematically shifted, with the lowest activation occurring at 10.76 in the left intraparietal sulcus (r2 = 0.85) and 10.60 in the right intraparietal sulcus [r2 = 0.79; t(15) = 1.01; P > 0.33 and t(14) = 0.43; P > 0.67, respectively].
Materials and Methods
Subjects.
One hundred thirty-eight subjects between 18 and 25 y old participated in the behavioral and fMRI experiments. All had normal or corrected-to-normal vision, and the subjects who participated in experiments with color manipulations had normal color vision. The subjects gave written informed consent in accordance with procedures and protocols approved by the Institutional Review Board of the Beijing Center for Brain Research.
Stimuli.
In the test patterns for investigating the connectivity effect (Figs. 1, 3, and 4B and Figs. S2–S4), some of lines could link a pair of dots to form, depending on how many pairs of dots were connected, zero-, one-, or two-connected patterns. The lines used in Fig. 1 were designed to have arbitrary and irregular shapes.
In the test patterns (Fig. 2 A and B) for investigating the inside/outside effect, ovals and irregular hollow figures were used to form, depending on how many pairs of dots were enclosed, zero-, one-, or two-enclosed patterns. Other than the numbers of dots enclosed, there was no systematic difference in shape, orientation, and location of these ovals and irregular hollow figures between the three enclosed conditions.
In all behavioral experiments (except the experiments in Fig. 1 C–E), the number of dots in the test patterns varied symmetrically around the reference number 12 across the seven numbers: 9–15.
In the experiment in Fig. 1C, the number of dots in the test patterns varied across the seven numbers two through eight, with the reference patterns containing five dots.
In the experiment in Fig. 1D, there were three comparisons: 1 vs. 3, 2 vs. 2, and 2 vs. 3 dots, and in the connected condition for 2 vs. 3 comparison, dots were connected only in the three-dot patterns.
In the experiments in Fig. 1E, for the augmented 2 vs. 3 condition, a pair of dots in the two-dot array rather than in the three-dot array (Fig. 1D, Right) was connected (Fig. 1E, Right).
In the test patterns to examine the color grouping effect, colored pairs of neighboring dots (Fig. 4A) and colored lines and hollow figures (Fig. 4B) were red [International Commission on Illumination (CIE) chromaticity coordinates and luminance value: x = 0.625, y = 0.343, and 15.6 cd/m2], and red straight lines and red hollow figures were used to make zero- and two-connected conditions or zero- and two-enclosed conditions, respectively (Fig. 4B). Colors of these circular dots, lines, and hollow figures were clearly visible under the experimental conditions.
Procedures.
In the discrimination paradigm (Figs. 1 A–C, 2, 3, and 4), two visual patterns, one serving as a reference and the other serving as a test, were displayed in the left and right hemifields of a subject, respectively, for 200 (Figs. 1 A and B, 2, and 4) or 100 ms (Fig. 1C). The left vs. right placement of the reference and test patterns in each trial was randomized and balanced in each block. After the participant’s response, a new trial started after a delay randomly selected between 500 and 1,000 ms. The participants were instructed to maintain fixation on the green cross at the center of the screen. The task was to determine whether the left or right pattern had more dots, without particularly emphasizing whether the dots were free standing or connected to a line. In the experiments in Fig. 1B, subjects were required to make their judgment based on dots and triangles together. Five blocks each with 336 trials were run. Before each experiment, 30 practice trials were given. No feedback was given, and there was no pressure on response speed.
In the estimation paradigm (Fig. S2), a test pattern alone was presented for 100 ms at the center of screen, replacing the fixation cross. Subjects were instructed to judge whether the test pattern contained more or less than 12 dots, without particularly emphasizing whether the dots were free standing or connected to a line, by pressing one of the labeled keys.
In the equality judgment paradigm (Fig. 1 D and E and Fig. S4), two patterns were presented for 100 ms in the left and right hemifields, and subjects were asked to determine whether the two patterns contained the same or different numbers of dots. Subjects were asked to respond as quickly and accurately as possible, and their RTs were recorded. No feedback was given.
Data Analysis.
Performances were quantified as the percentage of the test patterns judged to contain more dots than the reference patterns. Psychometric functions for the different connected or enclosed conditions were generated by fitting a cumulative Gaussian sigmoid curve using the Psignifit toolbox software for MATLAB (version 2.5.6; bootstrap-software.com/psignifit/) (Tables S6–S9) (54).
Table S6.
PSE values using cumulative Gaussian, logistic, and Weibull functions
| Subject no. | ||||||||||||
| 1 | 2 | 3 | 4 | |||||||||
| G | L | W | G | L | W | G | L | W | G | L | W | |
| 0 Conn | 11.90 | 12.04 | 12.04 | 12.04 | 12.06 | 12.13 | 11.91 | 11.85 | 12.08 | 11.71 | 11.71 | 11.83 |
| 1 Conn | 12.54 | 12.19 | 12.19 | 12.19 | 12.20 | 12.31 | 12.32 | 12.34 | 12.43 | 12.84 | 12.86 | 12.77 |
| 2 Conn | 12.87 | 13.27 | 13.27 | 13.27 | 13.27 | 13.35 | 12.86 | 12.86 | 12.98 | 13.17 | 13.13 | 13.23 |
Conn, connected; G, Gaussian; L, logistic; W, Weibull.
Table S9.
γ-Values using cumulative Gaussian, logistic, and Weibull functions
| Subject no. | ||||||||||||
| 1 | 2 | 3 | 4 | |||||||||
| G | L | W | G | L | W | G | L | W | G | L | W | |
| 0 Conn | 6.13E-07 | 1.06E-06 | 1.42E-06 | 6.23E-08 | 1.29E-05 | 8.21E-07 | 8.21E-04 | 1.26E-03 | 2.51E-07 | 3.22E-03 | 3.46E-05 | 3.18E-03 |
| 1 Conn | 1.04E-02 | 3.72E-03 | 3.44E-04 | 1.76E-02 | 1.06E-02 | 7.25E-05 | 9.76E-08 | 9.92E-08 | 2.49E-07 | 4.77E-02 | 4.06E-02 | 2.80E-02 |
| 2 Conn | 2.56E-07 | 1.38E-07 | 1.62E-06 | 4.32E-07 | 1.95E-04 | 2.20E-06 | 2.80E-04 | 2.44E-05 | 2.77E-06 | 5.00E-02 | 5.00E-02 | 5.00E-02 |
Conn, connected; G, Gaussian; L, logistic; W, Weibull.
Table S7.
Slope values at PSE using cumulative Gaussian, logistic, and Weibull functions
| Subject no. | ||||||||||||
| 1 | 2 | 3 | 4 | |||||||||
| G | L | W | G | L | W | G | L | W | G | L | W | |
| 0 Conn | 0.288 | 0.285 | 0.275 | 0.348 | 0.377 | 0.372 | 0.348 | 0.377 | 0.373 | 0.213 | 0.226 | 0.207 |
| 1 Conn | 0.285 | 0.353 | 0.304 | 0.285 | 0.311 | 0.287 | 0.285 | 0.311 | 0.287 | 0.176 | 0.187 | 0.192 |
| 2 Conn | 0.295 | 0.314 | 0.295 | 0.324 | 0.345 | 0.322 | 0.324 | 0.345 | 0.322 | 0.255 | 0.271 | 0.246 |
Conn, connected; G, Gaussian; L, logistic; W, Weibull.
Table S8.
λ-Values using cumulative Gaussian, logistic, and Weibull functions
| Subject no. | ||||||||||||
| 1 | 2 | 3 | 4 | |||||||||
| G | L | W | G | L | W | G | L | W | G | L | W | |
| 0 Conn | 5.00E-02 | 2.60E-02 | 5.00E-02 | 2.33E-02 | 1.92E-02 | 4.09E-02 | 5.00E-02 | 5.00E-02 | 4.99E-02 | 5.00E-02 | 5.00E-02 | 5.00E-02 |
| 1 Conn | 5.00E-02 | 5.00E-02 | 5.00E-02 | 1.82E-05 | 3.19E-06 | 3.75E-06 | 1.82E-02 | 2.01E-02 | 2.00E-02 | 5.00E-02 | 5.00E-02 | 5.00E-02 |
| 2 Conn | 3.27E-02 | 5.00E-02 | 5.00E-02 | 5.00E-02 | 5.00E-02 | 5.00E-02 | 4.35E-02 | 3.80E-02 | 5.00E-02 | 4.56E-03 | 3.34E-03 | 4.99E-02 |
Conn, connected; G, Gaussian; L, logistic; W, Weibull.
fMRI Adaptation.
Structural and functional images were acquired with 3-T scanners (TRIO or Prisma; Siemens) using a magnetization-prepared rapid gradient echo sequence and a gradient echo planar imaging sequence, respectively. A standard 12- or 20-channel head coil was used. Visual stimuli were projected on a rear projection screen placed 70 cm from the participants’ eyes and viewed through an angled mirror attached to the head coil.
Subjects were instructed to monitor the number of dots in the display while maintaining fixation on a small green cross (0.4 × 0.4° visual angle) at the center of the screen during a run. To facilitate their fixation, they were required to detect an occasional (two or four times in each run) increase in size of the cross (0.8 × 0.8° visual angle) lasting for 50 ms. The stimuli are illustrated in Fig. 5A.
The stimuli, procedures, and tasks are also illustrated in Figs. 1, 2, 4, and 5 and Figs. S3 and S4. More details are given in SI Materials and Methods.
SI Materials and Methods
Subjects.
The experiment in Fig. 1A had 4 subjects, the experiment in Fig. 1C had 2 subjects, the experiment in Fig. 1D had 12 subjects, and the experiment in Fig. 1E had 14 subjects. The experiment in Fig. 2A had four subjects, and the experiment in Fig. 2B had four subjects. The experiment in Fig. 4A had 10 subjects, the experiment in Fig. S4 had 14 subjects, the experiment in Fig. S2 had 4 subjects, and the experiment in Fig. S6 had 16 subjects. Each of four experiments in Fig. 1B had 2 subjects, each of two experiments in Fig. 2C had 2 subjects, each of two experiments in Fig. 4B had 2 subjects, each of two experiments in Fig. 3 had 6 subjects, and each of two experiments in Fig. 5A had 12 subjects.
Stimuli.
The stimulus patterns each had a size of 4.4° × 6.6° visual angle and were grayscale (mean luminance of 12 cd/m2). The circular dots contained in a stimulus pattern were black with a diameter of 0.33°, and the equilateral triangles in Fig. 1B had the same area as the dots (shapes of the circular dots and the triangles were clearly visible under the experimental conditions). The irregular or straight lines were black with 0.06° width and end-to-end distances of 0.83–1.65°. The ovals had a major radius of 0.94–1.04° and a minor radius of 0.33–0.41°. The lines composing the ovals and the irregular hollow figures were also 0.06° in width. Both the dots and the lines were randomly distributed in each pattern subject to the following constraints: the dots were separated by a minimum distance of 0.99° and were a minimum of 0.28° from the boundary of a pattern, and the minimum distances between two lines and between a line and a dot were 0.84° and 0.33°, respectively.
In all behavioral experiments (except the experiments in Fig. 1 C–E), there are three or two (conditions of connected or enclosed patterns, respectively) by seven (levels of dot number) types of test patterns. For each type of test patterns, eight different arrays of dots were designed with different distributions of the dots. In total, 168 or 112 test patterns, respectively, were created. Accordingly, in total, 168 or 112 reference patterns, respectively, were designed, each containing 12 dots randomly distributed subject to the same constraints as test patterns.
The test patterns, used in the estimation task (Fig. 1 C–E), are the same as those of the experiment in Fig. 1A, except that straight line segments instead of the irregular lines were used to connect dots.
In the experiment in Fig. 1C, there were two (conditions of connected patterns) by seven (levels of dot number) types of test patterns. For each type of test patterns, eight different arrays of dots were designed, and in total, 112 test patterns were created. Accordingly, in total, 112 reference patterns were designed.
In the experiment in Fig. 1D, there were two (conditions of connected patterns) by three (comparisons) types of test pairs. For each stimulus of each type of test pairs, 20 different arrays of dots were designed. In total, 120 stimulus patterns were created.
In the experiments in Fig. 1E, there were two (conditions of connected patterns) by two (comparisons) types of test pairs. In total, 80 stimulus patterns were created.
Data Analysis.
In fitting the psychometric curves, both γ and λ parameters, which, respectively, control the low and high asymptote/plateau of the curve, were allowed to vary in the default range of 0–0.05, taking into account the occasional but unavoidable lapse in performance. The 50% threshold value ±(γ + λ)/2 represents chance performance, and the corresponding number of items represents the PSEs, where dot number of the test patterns was judged equal to that of the references.
To ensure that the underestimation of numerosity in the discrimination task is not the result of the particular form of psychometric function (cumulative Gaussian) chosen to fit the data, we took Fig. 1A as an example and used other sigmoidal forms, such as the logistic and Weibull functions, to perform fittings as well. The best-fitting PSE values, the slope values, and the lapses (λ and γ) for all three fitting functions are given in Tables S6–S9. There is virtually no difference between fittings by a cumulative Gaussian function and those by the logistic and Weibull functions. The systematic dependence of PSE on the level of connectivity is robust across all three fitting functions.
In the statistical tests of behavioral experiments, a one-way repeated measures ANOVA was conducted to compare the mean PSE values between different conditions.
fMRI Adaptation.
In the two fMRI adaptation experiments (Figs. 6 and 7), adaptors and probes were similar to stimulus patterns used in the experiment in Fig. 1A, except that straight line segments were used to connect dots. Each adaptor contained 10 dots. There are two kinds of adaptors [one contained three pairs of dots connected (three-connected), and the other contained no dots connected (zero-connected)] that were used in the two adaptation experiments, respectively (Figs. 6 and 7). Each probe may contain 5, 6, 8, 10, 12, 16, or 20 dots (Fig. 5A). One-half of the probes were three-connected (with the exception of the 5-dot probes, in which only two pairs of dots were connected because of its limited number of dots), and the other one-half were zero-connected.
For measuring the color grouping effect on neural tuning curves (Fig. S6) instead of connecting three pairs of dots (Fig. 5A), the corresponding three pairs of dots were colored red, and all of the line segments in probes as well as adaptors were left out. These probes included two conditions: zero- and three-colored pairs of dots. Otherwise, the stimuli and procedure were the same as in the above two fMRI adaptation experiments.
Each experiment comprised eight runs. Each run included 56 trials, started with a fixation period of 6 s, and ended with a fixation period of 15 s. In each trial, three adaptors and a probe after the adaptors were successively presented, each for 150 ms and with a constant interstimulus interval of 1,350 ms (Fig. 5A, Upper). The presenting order of probes was quasirandomized, with the constraint that the same type of probe could not occur in immediately consecutive trials.
Functional images were acquired by a gradient echo-planar imaging sequence (24 contiguous axial slices covering the whole brain; slice thickness = 4.5 mm; interslice gap = 0.5 mm; field of view = 200 × 200 mm2; acquisition matrix = 64 × 64; repetition time = 1,500 ms; echo time = 30 ms; flip angle = 90°). Higher-resolution T1-weighted structural images were acquired by a magnetization-prepared rapid gradient echo sequence for each participant.
Data were analyzed with SPM8 (www.fil.ion.ucl.ac.uk/spm). Standard preprocessing included realignment, slice timing correction, spatial normalization, and smoothing with an 8-mm Gaussian kernel. For each subject, activations were modeled by a linear combination of regressors for 14 stimulus conditions with a standard hemodynamic response function.
A cluster of voxels in the intraparietal sulcus showing fMRI numerosity adaptation effect was identified as the region of interest (ROI) for each participant. Specifically, the ROI was defined by contrasting activations from zero-connected probes of 10 dots (the same number of dots as the adaptor) with activations from the zero-connected probes of 5 and 20 dots (the numbers of dots most different from the adaptor; i.e., with a weight-balanced subtraction of [(5_dot + 20_dot) − 10_dot] in the experiment in Fig. 6). In the experiment in Fig. 7, the ROI was defined by the similar contrast but from three-connected probes. In the experiment in Fig. S6, the ROI was defined by contrasting activations from zero-colored probes of 10 dots with activations from the zero-colored probes of 5 and 20 dots. The averaged fMRI signal changes under different conditions were fitted by a Gaussian function of the logarithm of the ratio between a probe number (n) and an adaptor number (nhab) formulated as
where I is the blood oxygenation level-dependent (BOLD) activation, and w represents the degree of coarseness with which neurons encode numerosity (4). The equation was fitted to the tuning curves from the fMRI studies (Figs. 6 and 7 and Fig. S6), with four free parameters λ, µ, w, and nhab. Note that Gaussian functions have a width scaled up by relative to w; thus, FWHM = .
Acknowledgments
We thank D. Macleod for helpful comments to and careful review of this paper. This work was supported by National Key Basic Research Program of China Grants 2012CB825500 and 2015CB351701, National Nature Science Foundation of China Grants 91132302 and 31100813, and Strategic Priority Research Program of Chinese Academy of Sciences (B) Grants XDB02010001 and XDB02050001.
Footnotes
The authors declare no conflict of interest.
This article is a PNAS Direct Submission.
This article contains supporting information online at www.pnas.org/lookup/suppl/doi:10.1073/pnas.1512408112/-/DCSupplemental.
References
- 1.Dehaene S. The Number Sense: How The Mind Creates Mathematics. Oxford Univ Press; New York: 2011. [Google Scholar]
- 2.Burr D, Ross J. A visual sense of number. Curr Biol. 2008;18(6):425–428. doi: 10.1016/j.cub.2008.02.052. [DOI] [PubMed] [Google Scholar]
- 3.Piazza M, Izard V. How humans count: Numerosity and the parietal cortex. Neuroscientist. 2009;15(3):261–273. doi: 10.1177/1073858409333073. [DOI] [PubMed] [Google Scholar]
- 4.Piazza M, Izard V, Pinel P, Le Bihan D, Dehaene S. Tuning curves for approximate numerosity in the human intraparietal sulcus. Neuron. 2004;44(3):547–555. doi: 10.1016/j.neuron.2004.10.014. [DOI] [PubMed] [Google Scholar]
- 5.Ross J, Burr D. Number, texture and crowding. Trends Cogn Sci. 2012;16(4):196–197. doi: 10.1016/j.tics.2012.01.010. [DOI] [PubMed] [Google Scholar]
- 6.Ross J, Burr DC. Vision senses number directly. J Vis. 2010;10(2):10.1–10.8. doi: 10.1167/10.2.10. [DOI] [PubMed] [Google Scholar]
- 7.Butterworth B. Numerosity perception: How many speckles on the hen? Curr Biol. 2008;18(9):R388–R389. doi: 10.1016/j.cub.2008.03.014. [DOI] [PubMed] [Google Scholar]
- 8.Libertus ME, Brannon EM. Behavioral and neural basis of number sense in infancy. Curr Dir Psychol Sci. 2009;18(6):346–351. doi: 10.1111/j.1467-8721.2009.01665.x. [DOI] [PMC free article] [PubMed] [Google Scholar]
- 9.Izard V, Sann C, Spelke ES, Streri A. Newborn infants perceive abstract numbers. Proc Natl Acad Sci USA. 2009;106(25):10382–10385. doi: 10.1073/pnas.0812142106. [DOI] [PMC free article] [PubMed] [Google Scholar]
- 10.Nieder A, Freedman DJ, Miller EK. Representation of the quantity of visual items in the primate prefrontal cortex. Science. 2002;297(5587):1708–1711. doi: 10.1126/science.1072493. [DOI] [PubMed] [Google Scholar]
- 11.Van Loosbroek E, Smitsman AW. Visual perception of numerosity in infancy. Develop Psychol. 1990;26(6):916–922. [Google Scholar]
- 12.He L, Zhang J, Zhou T, Chen L. Connectedness affects dot numerosity judgment: Implications for configural processing. Psychon Bull Rev. 2009;16(3):509–517. doi: 10.3758/PBR.16.3.509. [DOI] [PubMed] [Google Scholar]
- 13.Franconeri SL, Bemis DK, Alvarez GA. Number estimation relies on a set of segmented objects. Cognition. 2009;113(1):1–13. doi: 10.1016/j.cognition.2009.07.002. [DOI] [PubMed] [Google Scholar]
- 14.Pomerantz JR, Sager LC, Stoever RJ. Perception of wholes and of their component parts: Some configural superiority effects. J Exp Psychol Hum Percept Perform. 1977;3(3):422–435. [PubMed] [Google Scholar]
- 15.Chen L. The topological approach to perceptual organization. Vis Cogn. 2005;12(4):553–637. [Google Scholar]
- 16.Todd JT, Weismantel E, Kallie CS. On the relative detectability of configural properties. J Vis. 2014;14(1):18. doi: 10.1167/14.1.18. [DOI] [PubMed] [Google Scholar]
- 17.Allik J, Tuulmets T. Occupancy model of perceived numerosity. Percept Psychophys. 1991;49(4):303–314. doi: 10.3758/bf03205986. [DOI] [PubMed] [Google Scholar]
- 18.Allik J, Tuulmets T, Vos PG. Size invariance in visual number discrimination. Psychol Res. 1991;53(4):290–295. doi: 10.1007/BF00920482. [DOI] [PubMed] [Google Scholar]
- 19.Barth H, Kanwisher N, Spelke E. The construction of large number representations in adults. Cognition. 2003;86(3):201–221. doi: 10.1016/s0010-0277(02)00178-6. [DOI] [PubMed] [Google Scholar]
- 20.Dakin SC, Tibber MS, Greenwood JA, Kingdom FA, Morgan MJ. A common visual metric for approximate number and density. Proc Natl Acad Sci USA. 2011;108(49):19552–19557. doi: 10.1073/pnas.1113195108. [DOI] [PMC free article] [PubMed] [Google Scholar]
- 21.Durgin FH. Texture density adaptation and visual number revisited. Curr Biol. 2008;18(18):R855–R856. doi: 10.1016/j.cub.2008.07.053. [DOI] [PubMed] [Google Scholar]
- 22.Hurewitz F, Gelman R, Schnitzer B. Sometimes area counts more than number. Proc Natl Acad Sci USA. 2006;103(51):19599–19604. doi: 10.1073/pnas.0609485103. [DOI] [PMC free article] [PubMed] [Google Scholar]
- 23.Reijnen E, Wolfe JM, Krummenacher J. Coarse guidance by numerosity in visual search. Atten Percept Psychophys. 2013;75(1):16–28. doi: 10.3758/s13414-012-0379-8. [DOI] [PMC free article] [PubMed] [Google Scholar]
- 24.Vos PG, van Oeffelen MP, Tibosch HJ, Allik J. Interactions between area and numerosity. Psychol Res. 1988;50(3):148–154. doi: 10.1007/BF00310175. [DOI] [PubMed] [Google Scholar]
- 25.Ansari D, Lyons IM, van Eimeren L, Xu F. Linking visual attention and number processing in the brain: The role of the temporo-parietal junction in small and large symbolic and nonsymbolic number comparison. J Cogn Neurosci. 2007;19(11):1845–1853. doi: 10.1162/jocn.2007.19.11.1845. [DOI] [PubMed] [Google Scholar]
- 26.Demeyere N, Humphreys GW. Immediate small number perception: Evidence from a new numerical carry-over procedure. J Exp Psychol Hum Percept Perform. 2012;38(1):18–22. doi: 10.1037/a0025390. [DOI] [PubMed] [Google Scholar]
- 27.Demeyere N, Rotshtein P, Humphreys GW. Common and dissociated mechanisms for estimating large and small dot arrays: Value-specific fMRI adaptation. Hum Brain Mapp. 2014;35(8):3988–4001. doi: 10.1002/hbm.22453. [DOI] [PMC free article] [PubMed] [Google Scholar]
- 28.Feigenson L, Dehaene S, Spelke E. Core systems of number. Trends Cogn Sci. 2004;8(7):307–314. doi: 10.1016/j.tics.2004.05.002. [DOI] [PubMed] [Google Scholar]
- 29.Le Corre M, Carey S. One, two, three, four, nothing more: An investigation of the conceptual sources of the verbal counting principles. Cognition. 2007;105(2):395–438. doi: 10.1016/j.cognition.2006.10.005. [DOI] [PMC free article] [PubMed] [Google Scholar]
- 30.Lipton JS, Spelke ES. Discrimination of large and small numerosities by human infants. Infancy. 2004;5(3):271–290. [Google Scholar]
- 31.Trick LM, Pylyshyn ZW. Why are small and large numbers enumerated differently? A limited-capacity preattentive stage in vision. Psychol Rev. 1994;101(1):80–102. doi: 10.1037/0033-295x.101.1.80. [DOI] [PubMed] [Google Scholar]
- 32.Vetter P, Butterworth B, Bahrami B. A candidate for the attentional bottleneck: Set-size specific modulation of the right TPJ during attentive enumeration. J Cogn Neurosci. 2011;23(3):728–736. doi: 10.1162/jocn.2010.21472. [DOI] [PubMed] [Google Scholar]
- 33.Xu F. Numerosity discrimination in infants: Evidence for two systems of representations. Cognition. 2003;89(1):B15–B25. doi: 10.1016/s0010-0277(03)00050-7. [DOI] [PubMed] [Google Scholar]
- 34.Gallistel CR, Gelman I. Non-verbal numerical cognition: From reals to integers. Trends Cogn Sci. 2000;4(2):59–65. doi: 10.1016/s1364-6613(99)01424-2. [DOI] [PubMed] [Google Scholar]
- 35.Chong SC, Evans KK. Distributed vs. focused attention (count vs. estimate) Wiley Interdiscip Rev Cogn Sci. 2011;2(6):634–638. doi: 10.1002/wcs.136. [DOI] [PMC free article] [PubMed] [Google Scholar]
- 36.Demeyere N, Humphreys GW. Distributed and focused attention: Neuropsychological evidence for separate attentional mechanisms when counting and estimating. J Exp Psychol Hum Percept Perform. 2007;33(5):1076–1088. doi: 10.1037/0096-1523.33.5.1076. [DOI] [PubMed] [Google Scholar]
- 37.Chen L. Topological structure in visual perception. Science. 1982;218(4573):699–700. doi: 10.1126/science.7134969. [DOI] [PubMed] [Google Scholar]
- 38.Au RK, Watanabe K. Numerosity underestimation with item similarity in dynamic visual display. J Vis. 2013;13(8):5. doi: 10.1167/13.8.5. [DOI] [PubMed] [Google Scholar]
- 39.Roitman JD, Brannon EM, Platt ML. Monotonic coding of numerosity in macaque lateral intraparietal area. PLoS Biol. 2007;5(8):e208. doi: 10.1371/journal.pbio.0050208. [DOI] [PMC free article] [PubMed] [Google Scholar]
- 40.Ansari D. Does the parietal cortex distinguish between “10,” “ten,” and ten dots? Neuron. 2007;53(2):165–167. doi: 10.1016/j.neuron.2007.01.001. [DOI] [PubMed] [Google Scholar]
- 41.Brannon EM. The representation of numerical magnitude. Curr Opin Neurobiol. 2006;16(2):222–229. doi: 10.1016/j.conb.2006.03.002. [DOI] [PMC free article] [PubMed] [Google Scholar]
- 42.Castelli F, Glaser DE, Butterworth B. Discrete and analogue quantity processing in the parietal lobe: A functional MRI study. Proc Natl Acad Sci USA. 2006;103(12):4693–4698. doi: 10.1073/pnas.0600444103. [DOI] [PMC free article] [PubMed] [Google Scholar]
- 43.Cohen Kadosh R, Bien N, Sack AT. Automatic and intentional number processing both rely on intact right parietal cortex: A combined FMRI and neuronavigated TMS study. Front Hum Neurosci. 2012;6:2. doi: 10.3389/fnhum.2012.00002. [DOI] [PMC free article] [PubMed] [Google Scholar]
- 44.Cohen Kadosh R, Cohen Kadosh K, Kaas A, Henik A, Goebel R. Notation-dependent and -independent representations of numbers in the parietal lobes. Neuron. 2007;53(2):307–314. doi: 10.1016/j.neuron.2006.12.025. [DOI] [PubMed] [Google Scholar]
- 45.Dehaene S, Spelke E, Pinel P, Stanescu R, Tsivkin S. Sources of mathematical thinking: Behavioral and brain-imaging evidence. Science. 1999;284(5416):970–974. doi: 10.1126/science.284.5416.970. [DOI] [PubMed] [Google Scholar]
- 46.Eger E, et al. Deciphering cortical number coding from human brain activity patterns. Curr Biol. 2009;19(19):1608–1615. doi: 10.1016/j.cub.2009.08.047. [DOI] [PubMed] [Google Scholar]
- 47.Eger E, Sterzer P, Russ MO, Giraud AL, Kleinschmidt A. A supramodal number representation in human intraparietal cortex. Neuron. 2003;37(4):719–725. doi: 10.1016/s0896-6273(03)00036-9. [DOI] [PubMed] [Google Scholar]
- 48.Harvey BM, Klein BP, Petridou N, Dumoulin SO. Topographic representation of numerosity in the human parietal cortex. Science. 2013;341(6150):1123–1126. doi: 10.1126/science.1239052. [DOI] [PubMed] [Google Scholar]
- 49.Holloway ID, Battista C, Vogel SE, Ansari D. Semantic and perceptual processing of number symbols: Evidence from a cross-linguistic fMRI adaptation study. J Cogn Neurosci. 2013;25(3):388–400. doi: 10.1162/jocn_a_00323. [DOI] [PubMed] [Google Scholar]
- 50.Nieder A, Dehaene S. Representation of number in the brain. Annu Rev Neurosci. 2009;32:185–208. doi: 10.1146/annurev.neuro.051508.135550. [DOI] [PubMed] [Google Scholar]
- 51.Nieder A, Diester I, Tudusciuc O. Temporal and spatial enumeration processes in the primate parietal cortex. Science. 2006;313(5792):1431–1435. doi: 10.1126/science.1130308. [DOI] [PubMed] [Google Scholar]
- 52.Wu SS, et al. Functional heterogeneity of inferior parietal cortex during mathematical cognition assessed with cytoarchitectonic probability maps. Cereb Cortex. 2009;19(12):2930–2945. doi: 10.1093/cercor/bhp063. [DOI] [PMC free article] [PubMed] [Google Scholar]
- 53.Dastjerdi M, Ozker M, Foster BL, Rangarajan V, Parvizi J. Numerical processing in the human parietal cortex during experimental and natural conditions. Nat Commun. 2013;4:2528. doi: 10.1038/ncomms3528. [DOI] [PMC free article] [PubMed] [Google Scholar]
- 54.Wichmann FA, Hill NJ. The psychometric function: I. Fitting, sampling, and goodness of fit. Percept Psychophys. 2001;63(8):1293–1313. doi: 10.3758/bf03194544. [DOI] [PubMed] [Google Scholar]
- 55.Kouider S, Dehaene S. Subliminal number priming within and across the visual and auditory modalities. Exp Psychol. 2009;56(6):418–433. doi: 10.1027/1618-3169.56.6.418. [DOI] [PubMed] [Google Scholar]


