Significance
Unlike liquids, for most solids, surface-tension-induced deformation is insignificantly small and practically negligible. It is unclear if, similar to liquids, the surface tension and surface energy of solids, e.g. cross-linked rubber-like materials, are numerically identical. Previous methods involving such materials allowed only indirect and somewhat inaccurate estimation of the surface tension and therefore could not unambiguously resolve the above question. Here we have attempted to address it by using a solid having an intrinsic curvature. When such a surface is contacted, a liquid curvature of the interface, coupled with the interfacial tension, causes large bulging deflection, analysis of which yields direct and accurate estimation of the interfacial tension, even for relatively stiffer solids.
Keywords: soft solid, surface tension, surface energy, bulging, wetting
Abstract
Unlike liquids, for crystalline solids the surface tension is known to be different from the surface energy. However, the same cannot be said conclusively for amorphous materials like soft cross-linked elastomers. To resolve this issue we have introduced here a direct method for measuring solid–liquid interfacial tension by using the curved surface of a solid. In essence, we have used the inner surface of tiny cylindrical channels embedded inside a soft elastomeric film for sensing the effect of the interfacial tension. When a liquid is inserted into the channel, because of wetting-induced alteration in interfacial tension, its thin wall deflects considerably; the deflection is measured with an optical profilometer and analyzed using the Föppl–von Kármán equation. We have used several liquids and cross-linked poly(dimethylsiloxane) as the solid to show that the estimated values of the solid–liquid interfacial tension matches with the corresponding solid–liquid interfacial energy reasonably well.
Surface energy of a material is the energy required to create a unit area of new surface by the process of division, whereas surface tension is the isotropic surface stress associated with its deformation. For liquid, these two quantities are numerically equal because, when a liquid surface is deformed, the separation distances between molecules at the surface do not necessarily alter as molecules can move from the bulk to a deforming surface. It is generally not so for a solid, as it has been argued (1–3) that a solid surface consists of a constant number of atoms, so the work done to alter the separation distance between atoms at the surface is expected to depend on this distance itself. As a result, work of deformation is not necessarily the same as the thermodynamic work required to create a new surface. It is not clear, however, if this picture is true for all kinds of solids. For crystal surfaces the question is somewhat resolved as it has been shown both experimentally and theoretically (2, 4) that surface free energy is a function of area itself and therefore the surface tension is expected to be different from surface energy. However, for amorphous materials, like polymeric solids and cross-linked elastomers, the issue remains unresolved because, for these materials, the molecules can have local mobility which allows them to show liquid-like behavior, e.g., surface reconstruction in response to external cues (5, 6). It has not been possible, however, to state anything conclusively because for most solids surface tension has not been measured accurately. The difficulty arises because, when a solid deforms due to the application of external forces, the internal stresses at the bulk of it far exceed that at the surface (7), which prevents the estimation of surface tension. Even when the sole effect of surface tension is considered, for most solids it remains almost immeasurable as the deformation due to surface tension remains significantly small.
In general, surface tension can deform only a sufficiently compliant solid, the extent of deformation of which can be estimated in terms of an elastocapillary length (8) defined as , where and are, respectively, the surface tension and shear modulus of the solid. For a soft rubber-like elastomer, with mN/m and Pa, the capillary length is estimated to be nm, which is too small to be measured by standard techniques, e.g., optical microscopy. For example, it has been shown that surface tension can result in blunting of a sharp corner (radius of curvature → 0) of rubbery solid, thereby compromising the fidelity of pattern transfer (9), but it has not been possible to measure the surface tension because of very small deformation and the possibility of effect of surface tension being coupled with thermal and chemical stresses during cross-linking. However, when the modulus of the solid is diminished considerably, e.g., by over three orders of magnitude, Pa, the elastocapillarity leads to meso- to microscopic effects which become somewhat tractable by optical methods. Flattening of undulating surface of a soft gel (10), diminishing effect of adhesion-induced surface roughening of a confined gel layer (11), and prevention of creasing instability in compressed solid (12, 13) are signatures of surface tension of the solids, yet the deformation is too small, <1 μm, to allow accurate estimation of it.
Apart from solid–air interfaces, solids in contact with a liquid also have been examined for interfacial tension-driven phenomena, e.g., formation of ridges at the three-phase contact line of a sessile liquid drop (14–18) placed on a compliant surface; stiffening of a soft gel embedded with tiny droplets of a liquid (19, 20); and compressive surface stress owing to Laplace pressure across a curved solid surface of a slender gel filament submerged inside a liquid and the resultant Rayleigh–Plateau instability (8, 21). Although deformation in all these experiments ranges from a few micrometers to hundreds of micrometers, they involve also measurement of liquid contact angle at the three-phase contact line which is generally hysteretic owing to metastable states in the energy landscape. Therefore, methods dependent on measurement of contact angle are expected to be colored by hysteresis and associated inaccuracies. Importantly, the above phenomena all occur in only very compliant solids (Young’s modulus ∼1 kPa) and therefore are not suitable for measurement of surface tension of stiffer solid (Young’s modulus ∼1 MPa).
Recent experiments show that for such solids too, geometric amplification can result in significant deformation, thereby facilitating measurement of surface tension. For example, an incompressible elastic film, embedded with liquid-filled microstructures, bulges out considerably because of wetting (22, 23). The deflection of a flat, thin, circular elastomeric film of thickness in contact with a liquid drop of radius gets amplified by geometric ratio (24) : ; here denotes the summation of bulk and surface stresses present in the film. This observation was used to extract a value of interfacial tension by extrapolating to vanishing thickness of the film. The estimated values obtained for interfacial tension were, however, much larger than the corresponding interfacial energies, which calls into question if the film was completely stress-free to begin with, as the base state was not characterized. Furthermore, large SD in data suggests also uncertainties in the measurement. In another elegant yet simple approach, surface tension was estimated by measuring deflection profile of a thin elastomeric film floating on a liquid (25) and indented by a pair of closely spaced cylinders. Here too, surface tension could be recovered in the limit of zero thickness of the film.
The above discussions bring out the point that for amorphous solids the relation between solid surface tension and surface energy still remains unresolved. It is in this context that we present a direct and accurate method for measuring surface tension of a relatively stiffer solid, e.g., poly(dimethylsiloxane) (PDMS), the shear modulus of which is on the order of 1 MPa, i.e., at least three orders of magnitude larger than that used in various earlier experiments. In essence we have here a thin elastomeric layer embedded with monolithic tiny microchannels of circular cross-section such that the thickness of the elastomeric skin above the channel does not remain uniform but varies according to channel curvature. When a liquid fills in these channels, the thin skin bulges out or bulges in, following changes in solid–liquid interfacial tension. The extent of bulging deflection depends on the minimum thickness, of the skin and the diameter of the channel. Thus, this experiment allows the effect of finite thickness of a solid layer to be coupled with its intrinsic curvature to attain significant deflection of the solid. We show also that the inherent symmetry of the geometry allows the problem to be analyzed in two dimension so that solid–liquid interfacial tension can be directly estimated by analyzing the deflection profile of the skin. We have examined the efficacy of this method by estimating for several liquids and PDMS system. For all these cases the numerical value of interfacial tension was found to be similar to the interfacial energy estimated from Young’s equation.
Materials and Method
PDMS, Sylgard 184 elastomer, and the curing agent were procured from Dow Corning Corp. Cylindrical steel rods of diameter 180–550 µm and feeler gauges of thickness 40–600 μm were procured from local market. Microscope glass slides, 25 × 75 × 1 mm, were procured from Fisher Scientific. Octadecyltrychlorosilane (OTS), methanol, ethanol, butanol, hexanol, octanol, nitromethane, and dimethyl sulfoxide (DMSO) were purchased from S.D. Fine-Chem Limited. Perflurooctane was procured from Sigma-Aldrich. Deionized Millipore water was used in all stages of the experiment.
Sample Preparation.
PDMS precursor mixed with the curing agent in 10:1 wt/wt was allowed to cure between two parallel microscope glass slides, one of which was silanized with self-assembled monolayers of OTS, whereas the other was plasma oxidized (PO). The silanized plate was easily removable from the cross-linked layer, which remained strongly bonded to the PO slide (26). The steel rods used as templates were placed horizontally on the bottom plate inside the pool of cross-linkable liquid (27). Spacers were used for attaining specific thickness of the layer. The liquid was cross-linked at 25–27 °C temperature for 72 h, following which the templates were withdrawn out of the cured solid by exerting a gentle pull. In this process, cross-linking was not complete as evidenced by the presence of a thin layer of oil on the needle after it was withdrawn. Therefore, the solid film with the subsurface channels was further cured by heating at 80 °C for 2 h, following which it was cooled to room temperature. Channels of length ∼20 mm, diameter d = 180–550 μm were thus embedded in PDMS films to attain minimum skin thickness of t0 = 5–50 μm. Channels were also maximally buried so that the thickness of films was equal to the summation of channel diameter and skin thickness of the film, h = d + t0. The surface of the templates had an average root-mean-square roughness of 15 nm, as measured by using atomic force microscopy; therefore, the inner surfaces of the channels are also expected to have similar or smaller roughness values which are not expected to cause significant perturbation to curvature of the inner surface of the channel. The side view of the channels was captured (Fig. S1) using a microscope lens fitted with a camera, from which the exact values of t0 and h were obtained. Young’s modulus of such cross-linked networks was estimated to be 2.4 MPa and these networks are known to be incompressible (26). The films thus prepared were allowed to relax for ∼2–3 d, after which they were used for further experiment.
Fig. S1.
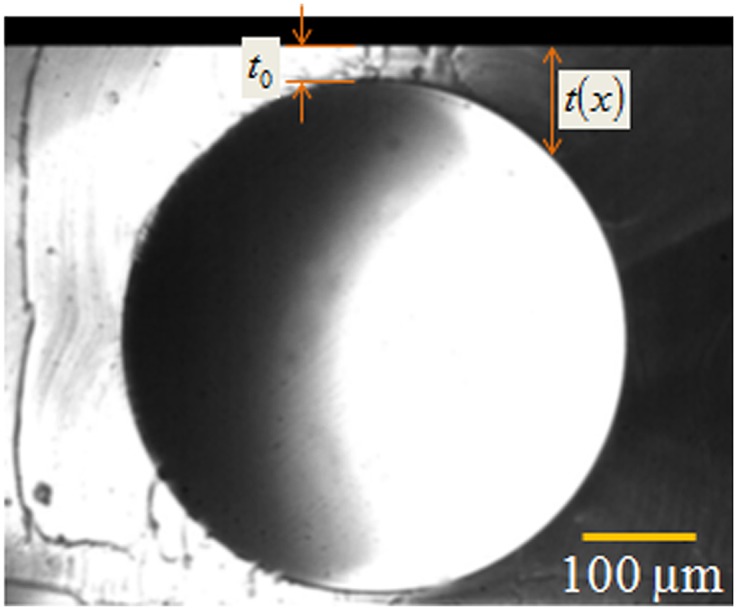
Optical micrograph shows typical side view of an air-filled channel of diameter and minimum skin thickness .
All liquids, except water, were used as received from the supplier. Water is known to contain dissolved air that tends to nucleate on the hydrophobic PDMS surface; therefore the following procedure was followed to remove the air from water. Noting that the dissolved air primarily consists of oxygen, the solubility of oxygen in water being orders of magnitude larger than that of nitrogen (28), the water in a glass beaker was purged with nitrogen gas for 30 min, following which it was frozen in a freezer for 24 h. Thereafter, the ice was thawed by keeping it at room temperature and was further heated to 45 °C. After cooling it down to room temperature, the water was purged again with nitrogen gas for 30 min and was stored in airtight condition. The water thus prepared was used for injecting into the channels. A fresh batch of water was prepared every time the above experiment was done.
Result and Discussion
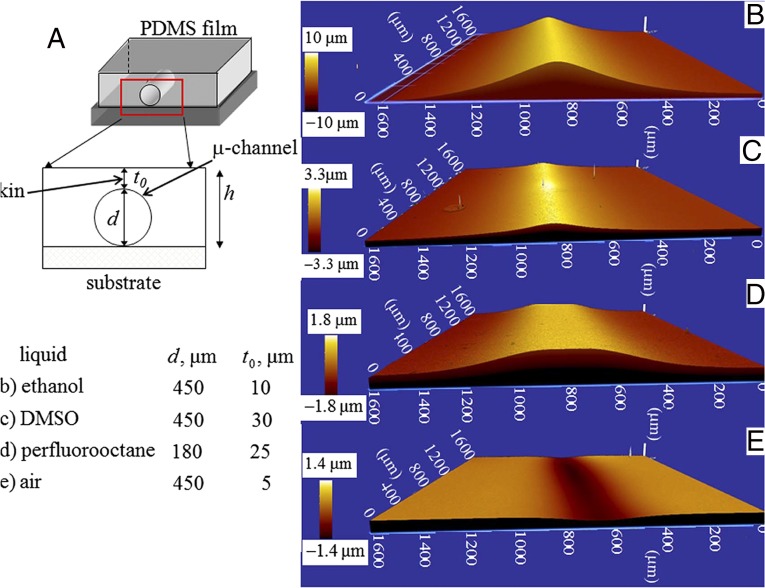
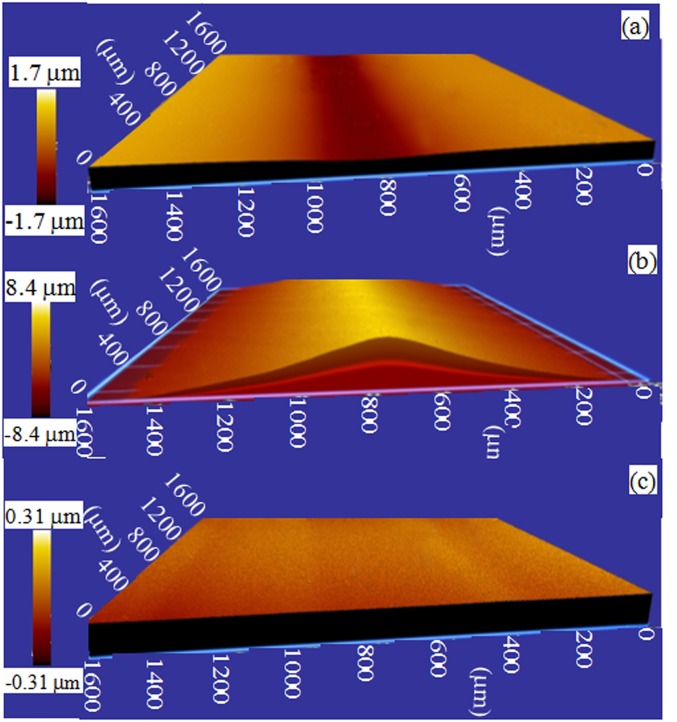
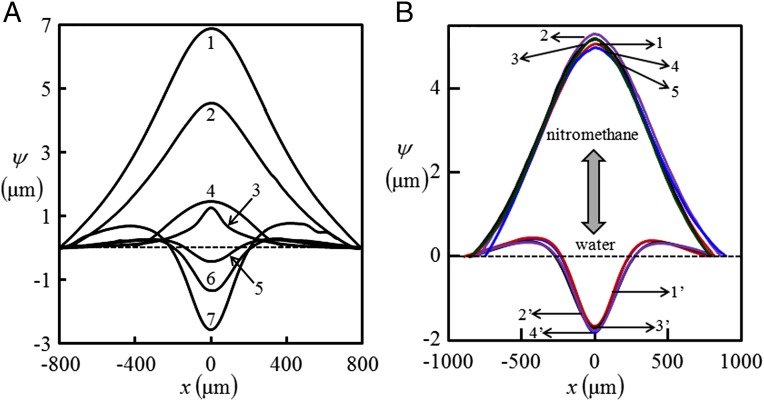
The channels were filled with liquids, e.g., ethanol, perfluorooctane, DMSO, nitromethane, acetonitrile, ethylene glycol, and water, which have dispersive interaction with PDMS. Except for water, these liquids all wet the surface of PDMS to different extents but swell it negligibly or do not swell at all. The liquids which can wet the surface of the channel filled it in by capillary action, for others, the liquid was injected into the channel using a syringe. Care was taken that they did not spill over the top surface of the film which was exposed to atmosphere. Wetting of the channel alters the solid–liquid interfacial tension, leading to bulging of the thin skin over the channel. The bulging deflection was captured using an optical profilometer (ZYGO ZeGage 3D). Fig. 1 B–D shows typical such profiles when pure ethanol, DMSO, and perfluorooctane are used inside channels; Fig. 1E corresponds to air. The final bulging height was achieved instantly and was found to remain unaltered so long as the liquid remained within the channel. The bulging deflection was reversible, as the skin went back to its original state as the liquid was withdrawn from the channel or it got evaporated to atmosphere. The bulged profile subsided also when a flexible adherent was brought in complete contact with the film (Fig. S2). However, the profile almost went back to its original state as the contactor was withdrawn. It may be argued that bulging deflection occurs not because of surface tension but because of some other phenomena at the bulk of the solid, e.g., swelling. Some of the liquids, e.g., ethanol, methanol, and few others are indeed known to swell PDMS (29), albeit to a small extent over a long period. In our experiments, the skin underwent deflection instantly and remained so with time. In fact, liquids like perfluorooctane, nitromethane, and DMSO (Fig. 2A), which do not swell PDMS at all, also caused measurable deflection of the skin of the channel. Fig. 2B depicts the reversibility of the phenomenon, in which a channel was first filled with one liquid, e.g., nitromethane, which resulted in the deflection profile 1. The nitromethane present inside the channel was then ejected out by blowing dry nitrogen followed by injecting water into it using a hypodermic syringe, which instantly altered the bulging deflection from 1 to 1′. The profile flipped back to 2 with almost no hysteresis as the water was then ejected out and nitromethane was injected into the channel. This process could be repeated several times.
Fig. 1.
(A) Schematic of the experiment in which a thin elastomeric layer of PDMS, embedded with microchannels of circular cross-section, remains bonded to a rigid substrate. Liquids with varying ability to wet the PDMS surface are inserted into the channel and the surface of the layer at the vicinity of the channel is examined under an optical profilometer. (B–E) Optical profilometry images of the bulging deflection of the skin of the PDMS layer with channel filled with ethanol, DMSO, perflurooctane, and air, respectively.
Fig. S2.
(A) Channel of μm embedded inside a film of μm remains initially filled with air. (B) The surface of the film bulges out as the channel is filled with acetonitrile. (C) A flexible contactor, e.g., a glass coverslip, is brought in contact with this film, at which the bulged profile subsides.
Fig. 2.
Bulging profile of thin skin of an elastic film embedded with liquid-filled channels. (A) Curves 1–7 represent liquids: (1) acetonitrile (filled-in channel of diameter µm, embedded in film of thickness µm and minimum skin thickness, µm); (2) nitromethane ( µm, µm, and µm); (3) DMSO ( µm, µm, and µm); (4) perflurooctane, ( µm, µm, and µm); (5 and 6) ethylene glycol, air ( µm, µm, and µm); and (7) water ( µm, µm, and µm), respectively. (B) Two liquids are injected alternatively into the channel. Bulging deflection of the channel skin flips from 1 to 1′ as nitromethane, initially present in the channel, is replaced by injecting water into it. The profile flips back to 2 as water is similarly replaced by nitromethane. This process is repeated 4–5 times, without any signature of irreversibility or hysteresis. A film embedded with channel of diameter µm and minimum skin thickness µm is used in this experiment.
Analysis of Bulging Deformation of Skin Above the Channel.
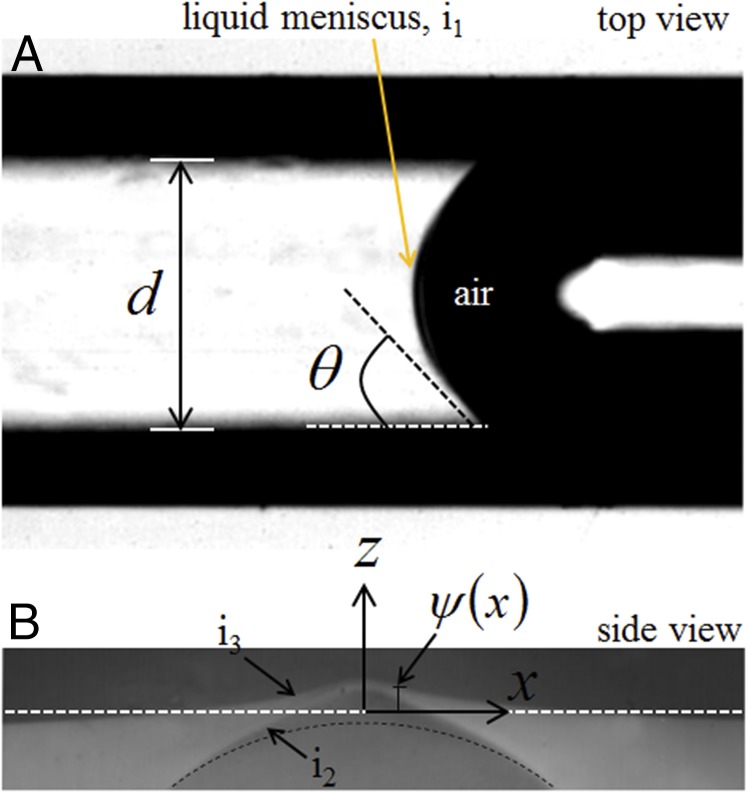
The bulging effect of the channel embedded films can be analyzed by considering that the thin skin above the channel () is an elastic membrane freely supported on the elastomeric layer at . The cylindrical channel is long enough that we assume plane strain approximation, i.e., bulging of the skin and the curvature of the bulged-out profile remaining uniform along the axis of the channel. Furthermore, the out-of-plane deflection is small enough in most of our experiments that the thickness of the skin above the channel can be considered to remain unaltered. Under these conditions, the out-of-plane deflection or the extent of bulge of the thin skin of the channel satisfies the following coupled one-dimensional Föppl–von Kármán equations (7):
| [1a] |
| [1b] |
in which is Young’s modulus of the film and is its Poisson ratio. The first term on the left-hand side of Eq. 1a accounts for the bending force in the membrane, the thickness of which does not remain constant but varies spatially. Therefore, the moment of inertia , defined as , also varies. Bending force is defined per unit width of the membrane, i.e., per unit length of the channel. The second term accounts for the tension per unit width in the film. Eq. 1b implies that the tension in the skin remains uniform along . On the right-hand side, accounts for the external force on the membrane, which in this case is the Laplace pressure, arising out of the curvature of the thin skin and the meniscus of the liquid in the channel. The Laplace pressure occurs at three different interfaces: (i) at the liquid meniscus at i1 (Fig. 3A), (ii) at the inner surface i2 of the skin, where it remains in contact with the liquid, the natural curvature is augmented by that associated with deflection of the skin, and (iii) at the solid–air interface i3. The expression for the Laplace pressure is obtained by constrained minimization of the total energy of the system (Supporting Material), which yields the following relation for as , where , and represent surface tension of liquid and interfacial tension of solid–air and solid–liquid interfaces, respectively. Substituting it in Eq. 1a and integrating it twice with respect to , and noting that the solution of bulging deflection is symmetric about , we obtain
| [2] |
where and coefficients and represent and , respectively. is an integration constant, which can be estimated by setting the values of maximum curvature: and deflection: at as obtained from experimental data. Furthermore, using the following dimensionless quantities: , , in which is a characteristic deflection of the skin, Eq. 2 can be written in dimensionless form as
| [3] |
The second term on the right-hand side of Eq. 3 yields an expression for the elastocapillary length as , as against its conventional form: , implying that the elastocapillary length gets amplified by the geometric factor . Thus, an elastomeric film embedded with channel of larger diameter but with smaller skin thickness is expected to result in larger deflection as observed in our experiments. Eq. 3 is a second-order differential equation with nonlinear coefficients, which is not amenable to analytical solution. It is possible however to extract the unknown coefficients and by regression analysis of the optical profilometry data. The bulging profile all through the width of the channel could be used for this analysis, but noting that skin thickness increases away from the tip of the profile, a limited number of data points very close to the tip was used for fitting with Eq. 3. In effect, in most cases, the data points that lie within ∼10% of minimum thickness at the tip of the profile were used. Furthermore, in most experiments, skins of intermediate thickness and channels of intermediate diameter were used. A thin membrane with very low flexural rigidity deflects to a large extent but remains susceptible to nonuniform deflection along the axis of the channel. For very thick membranes, the extent of bulging diminishes; also the effect of surface stress becomes less important compared with tension that develops at the bulk of the film (7). Experiments with very thin skin μm, μm indeed showed that the bulging height was varying along the axis of the channel, which indicates breaking down of the plane strain approximation. Similarly, channels of very small diameter were avoided, as for these cases, the height of bulge diminishes; also, the skin thickness increases more rapidly away from the tip compared with channels with larger diameter, which amplifies nonlinear effect and consequent inaccuracy in the regression analysis. For very large diameter channels, the thin skin was susceptible to natural sagging because of the effect of gravity. Care was taken also that the deflection profile of the thin skin was perfectly symmetric about the axis of the channel. All these issues call for detailed mechanical analysis of the geometry, which remains for the future. For now, we find that channels of diameter μm and skin thickness μm are most suitable for carrying out our experiments.
Fig. 3.
(A) Top view of a typical channel of diameter filled with a wetting liquid which forms a concave meniscus. The particular image was taken for perfluorooctane in a channel of diameter μm. (B) Magnified side view of the channel shows that the thin skin above the channel bulges out.
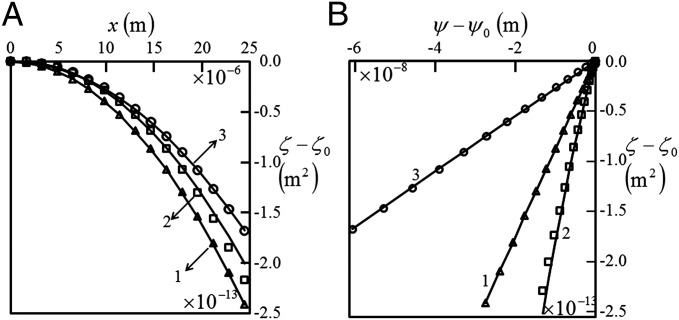
Fig. 2 shows the profilometry data for air and different liquids: acetonitrile, nitromethane, perfluorooctane, DMSO, ethylene glycol, and water used with channels of different diameter: μm and skin thickness μm, respectively. Note also that except for acetonitrile, none of the other liquids swells PDMS; acetotrile swells it only ∼3% by volume. The dashed line shows the profile of the surface of the film before the template was withdrawn. Following its withdrawal, the skin above the air-filled channel bulges in. When the channel was filled with liquid, the bulging deflection was found to vary depending on the solid–liquid interaction. The deflection profile of the surface of the film was analyzed according to Eq. 3 (details presented in Supporting Material and Fig. S3). Fig. 4 A and B shows typical fit of experimental data according to Eq. 3. In essence, the data of bulging deflection from optical profilometery were used to obtain , which are then fitted as with respect to and ; from the slopes of the fit, and were extracted. For channels filled with air, the fitted value of was directly equated to , whereas for liquid, values were calculated as ; the contact angle of the liquid meniscus with the channel wall was measured from the top view of the capillary as shown in Fig. 3A. Because was measured at the inner surface of the capillary where the wall thickness far exceeded other relevant lengthscales, e.g., channel diameter and the minimum skin thickness of the film, the deformation at the three-phase contact line is expected to be negligible. For any particular liquid, experiments are carried out in channels of different diameter and skin thickness as presented in Table S1 in the Supporting Information; calculated from each such experiment was averaged to obtain a representative value along with the SD of the data.
Fig. S3.
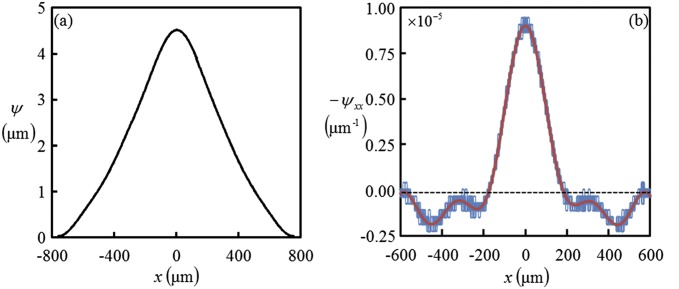
Depiction of how the double derivative of the bulged-out profile of the film is estimated. (A) The plot shows a typical trace of the bulged-out profile of a film of thickness , embedded with a channel of diameter , which is filled with nitromethane. (B) The double derivative of the bulged-out profile is calculated using the central difference technique, which results in the oscillatory trace as shown in blue. This trace is then smoothened using an FFT filter to obtain the noise-free double derivative of the profile as represented by the solid red line.
Fig. 4.
(A and B) Typical fit of the quantity as a function of and as described in Eq. 3. The symbols ○ and □ represent data obtained for channels (diameter μm, minimum skin thickness μm, and film thickness μm) and ( μm, μm, and μm) filled with perfluorooctane, and △ represents one ( μm, μm, and μm) filled with nitromethane, respectively. The solid line represents that obtained by using respective fit equations.
Table S1.
Solid–liquid interfacial tension for different liquids as estimated using channels of different diameter and skin thickness
| Air | 160 | 6 | 23.0 |
| 450 | 18 | 26.1 | |
| 450 | 18 | 28 | |
| Average | 26.2 | ||
| SD | 2.3 | ||
| Perfluorooctane | 180 | 25 | 13.6 |
| 180 | 60 | 10.5 | |
| 450 | 4 | 5.1 | |
| 450 | 20 | 15.3 | |
| 550 | 28 | 13.1 | |
| Average | 11.4 | ||
| SD | 4.4 | ||
| DMSO | 180 | 5 | 8.5 |
| 180 | 80 | 9.5 | |
| 450 | 11 | 11.0 | |
| 450 | 52 | 5.1 | |
| Average | 8.5 | ||
| SD | 2.5 | ||
| Nitromethane | 450 | 17 | 5.8 |
| 450 | 30 | 4.8 | |
| 550 | 28 | 3.0 | |
| 700 | 28 | 9.7 | |
| Average | 5.8 | ||
| SD | 2.8 | ||
| Ethylene glycol | 450 | 22.5 | 32.2 |
| 455 | 18 | 23.6 | |
| 160 | 6 | 29.9 | |
| Average | 28.6 | ||
| SD | 4.5 | ||
For the air-filled channel, such an analysis yielded solid–air surface tension, mN/m, which is similar to the intrinsic surface energy of PDMS (30, 31), mJ/m2. For liquids, the solid–liquid interfacial tension calculated in the above process was compared with interfacial energy obtained from measurement of contact angle of these liquid inside the PDMS capillaries. In particular, we measured the advancing contact angle which yielded the solid–liquid interfacial energy via Young’s equation: . Table 1 shows the and values calculated for different liquids. The solid–liquid interfacial tension was obtained to be very similar to the solid–liquid surface energy values. For example, for nitromethane: mJ/m2 and θ = 69°, the solid–liquid interfacial energy was calculated to be mJ/m2, which is close to the interfacial tension mN/m as obtained in our experiments. Similar values of interfacial energy and tension were observed also for the DMSO–PDMS system: the interfacial energy and tension were estimated as mJ/m2 and mN/m, respectively. For the perfluorooctane–PDMS system, with θ = 48° and mJ/m2, the interfacial energy was estimated as mJ/m2 similar to mN/m obtained from our experiments. For ethylene glycol the estimated value for mN/m was somewhat larger than mJ/m2, possibly because the very small extent of deformation (curve 6 in Fig. 2A) does not allow to be estimated accurately.
Table 1.
Data of surface tension of liquids were obtained from different sources
| , | , | (Eq. 2), | , | , | |
| Liquid | mN/m | deg | mN/m | mN/m | mJ/m2 |
| Air | 26.2 ± 2.3 | 22 | |||
| Perfluorooctane | 14.0 | 48 | 30.0 ± 4.4 | 11.4 ± 4.4 | 12.6 ± 0.1 |
| Nitromethane | 34.9 | 69 | 30.5 ± 2.8 | 5.8 ± 2.8 | 8.5 ± 1.1 |
| DMSO | 42.9 | 75 | 30.8 ± 2.7 | 8.5 ± 2.5 | 10.2 ± 0.7 |
| 20% ethanol–aqueous solution | 38.0 | 96 | 9.5 ± 1.9 | 17.7 ± 2.2 | 26.0 |
| Ethylene glycol | 47.3 | 85 | 35.9 ± 3.4 | 28.5 ± 4.5 | 17.9 ± 1.5 |
| Water | 72.8 | 105 | 3.7 ± 1.8 | 41.1 ± 6.54 | 40.5 ± 1.9 |
Summary
To summarize, we have presented here a simple method for measuring solid–liquid interfacial tension using curved surface of a solid. When such a surface is brought in contact with a liquid, the resultant solid–liquid interfacial tension leads to its deflection, which has been analyzed using Föppl–von Kármán equations. The method has been demonstrated by estimating the interfacial tension values for several PDMS–liquid systems, each measurement being averaged over experiments with different channel diameter and skin thickness. The curved surface of the channel allows us to estimate directly and relatively more accurately the interfacial tension without having to resort to any extrapolation method as attempted previously for a flat elastic membrane (24, 25). Although in all our experiments we have used PDMS films of Young’s modulus MPa, the amplification factor along with use of an optical profilometer should allow use of much stiffer solid for similar experiments. The interfacial tension values that we obtain for various liquid–PDMS systems match closely with corresponding solid–liquid interfacial energy values, signifying that for elastomeric solids the interfacial tension and interfacial energy remain in almost complete agreement, unlike for crystal surfaces. Our experiments show also that the bulging profile and the curvature of the bulge change almost instantaneously and reversibly as the liquid contacting the channel surface is altered. This phenomenon then brings out the possibility of designing an interfacial-tension-induced actuator in soft systems.
Supporting Material
Derivation of Föppl–von Kármán Equation.
Total energy of the system and energy minimization.
The total energy of the system consists of elastic energy of the thin skin of the channel and the interfacial energy. The elastic energy of the skin is a sum of bending and stretching energy which are estimated by considering displacement in the skin. The displacement consists of two components: one due to pure stretching and the other, the transverse displacement in bending, both being uniform along the length of the channel. The bending energy of the skin can be written in terms of curvature and bending rigidity as
| [S1] |
defines Young’s modulus of the skin under plane strain conditions, defines its Poisson ratio; the bending energy is integrated over length of the channel. The total strain of the skin occurs both due to pure stretching and transverse displacement, so that the stretching energy is similarly expressed as
| [S2] |
where is the tension in skin. In addition to the bending and the stretching energy, the solid skin and the liquid within the channel also have interfacial energy because of three different interfaces: (i) liquid–air, (ii) solid–liquid, and (iii) solid–air, the area of which can be represented, respectively, as
It should be noted that we have considered only the upper half portion of the channel as it is relevant for the analysis of the bulging phenomenon. Furthermore, under small gradient approximation, defines the curvature of the channel. Representing liquid–air, solid–liquid, and solid–air surface tensions as , , and , respectively, and combining all of the energies, the total energy of the system can be written as
| [S3] |
The total energy of the system is minimized subject to the constraint that the volume of the solid and the liquid within the channel remain constant. The volume of the solid is expressed as
whereas that of the liquid is expressed as
These constraints are accounted for by introducing Lagrange multipliers, and , for solid and liquid, respectively. So, the expression for the constrained energy, i.e., the Lagrangian, can be defined as
| [S4] |
Here and are the constant volume of the solid and the liquid, respectively. Here the Lagrange multiplier has the dimension of pressure which can be found out from the appropriate boundary condition. The Lagrangian is minimized with respect to the variable and its derivatives, which essentially is expressed by the Euler Lagrangian equation:
| [S5] |
which finally results in the following equation:
| [S6] |
For the above equation to be satisfied, the terms within the parentheses should be separately equated to zero. Hence, we have
| [S7] |
Here is defined as . The Lagrange multiplier is the pressure in the liquid, which can be obtained from the Laplace pressure at the liquid–air interface as
Therefore, Eq. 7 can be written in compact form as
| [S8] |
in which is defined as .
Method of Analyzing the Bulging Profile.
Fig. S3A shows typical trace of the surface of the thin skin of a channel filled with a liquid which wets its surface. The double derivative of the profile of the profile was obtained by the central difference technique. The profile thus obtained was found to be colored with noise over and above a trend profile. Therefore, the data were subjected to a fast Fourier transform (FFT) filter to smoothen it out as depicted by the solid line. To obtain the minimum skin thickness , the side view of the film at the vicinity of the embedded air-filled channel was obtained. Furthermore, thickness profile of film was estimated as . These data of and were used to calculate , which were used for fitting Eq. 3.
Acknowledgments
We thankfully acknowledge stimulating discussions with Prof. Anand Jagota and Prof. Manoj K. Chaudhury. This work is supported by the Department of Science and Technology, Government of India via Grant DST/SB/S3/CE/036/2013.
Footnotes
The authors declare no conflict of interest.
This article is a PNAS Direct Submission.
This article contains supporting information online at www.pnas.org/lookup/suppl/doi:10.1073/pnas.1502642112/-/DCSupplemental.
References
- 1.Shuttleworth R. The surface tension of solids. Proc Phys Soc, London, Sect A. 1950;63(5):444–457. [Google Scholar]
- 2. Orowan E (1970) Surface energy and surface tension in solids and liquids, Proc R Soc, London, Sect A 316(1527):473–491.
- 3.Müller P, Saúl A. Elastic effects on surface physics. Surf Sci Rep. 2004;54(5-8):157–258. [Google Scholar]
- 4.Savina TV, Golovin AA, Davis SH, Nepomnyashchy AA, Voorhees PW. Faceting of a growing crystal surface by surface diffusion. Phys Rev E Stat Nonlin Soft Matter Phys. 2003;67(2 Pt 1):021606. doi: 10.1103/PhysRevE.67.021606. [DOI] [PubMed] [Google Scholar]
- 5.Vaidya A, Chaudhury MK. Synthesis and surface properties of environmentally responsive segmented polyurethanes. J Colloid Interface Sci. 2002;249(1):235–245. doi: 10.1006/jcis.2002.8262. [DOI] [PubMed] [Google Scholar]
- 6.Hillborg H, Tomczak N, Olàh A, Schönherr H, Vancso GJ. Nanoscale hydrophobic recovery: A chemical force microscopy study of UV/ozone-treated cross-linked poly(dimethylsiloxane) Langmuir. 2004;20(3):785–794. doi: 10.1021/la035552k. [DOI] [PubMed] [Google Scholar]
- 7.Landau LD, Lifshitz EM. 1986. Course of Theoretical Physics, Vol VII: Theory of Elasticity (Pergamon, New York), 3rd Revised Ed.
- 8.Mora S, Phou T, Fromental J-M, Pismen LM, Pomeau Y. Capillarity driven instability of a soft solid. Phys Rev Lett. 2010;105(21):214301. doi: 10.1103/PhysRevLett.105.214301. [DOI] [PubMed] [Google Scholar]
- 9.Hui C-Y, Jagota A, Lin YY, Kramer EJ. Constraints on microcontact printing imposed by stamp deformation. Langmuir. 2002;18(4):1394–1407. [Google Scholar]
- 10.Jagota A, Paretkar D, Ghatak A. Surface-tension-induced flattening of a nearly plane elastic solid. Phys Rev E Stat Nonlin Soft Matter Phys. 2012;85(5 Pt 1):051602. doi: 10.1103/PhysRevE.85.051602. [DOI] [PubMed] [Google Scholar]
- 11.Chakrabarti A, Chaudhury MK. Direct measurement of the surface tension of a soft elastic hydrogel: exploration of elastocapillary instability in adhesion. Langmuir. 2013;29(23):6926–6935. doi: 10.1021/la401115j. [DOI] [PubMed] [Google Scholar]
- 12.Chen D, Cai S, Suo Z, Hayward RC. Surface energy as a barrier to creasing of elastomer films: an elastic analogy to classical nucleation. Phys Rev Lett. 2012;109(3):038001. doi: 10.1103/PhysRevLett.109.038001. [DOI] [PubMed] [Google Scholar]
- 13.Hong W, Zhao X, Suo Z. Formation of creases on the surfaces of elastomers and gels. Appl Phys Lett. 2009;95(11):111901. [Google Scholar]
- 14.Shanahan MER. The spreading dynamics of a liquid drop on a viscoelastic solid. J Phys D Appl Phys. 1988;21(6):981–985. [Google Scholar]
- 15.Carre A, Gastel J-C, Shanahan MER. Viscoelastic effects in the spreading of liquids. Nature. 1996;379:432–434. [Google Scholar]
- 16.Jerison ER, Xu Y, Wilen LA, Dufresne ER. Deformation of an elastic substrate by a three-phase contact line. Phys Rev Lett. 2011;106(18):186103. doi: 10.1103/PhysRevLett.106.186103. [DOI] [PubMed] [Google Scholar]
- 17.Style RW, Che Y, Wettlaufer JS, Wilen L, Dufresne ER. Universal deformation of soft substrates near a contact line and the direct measurement of solid surface stresses. Phys Rev Lett. 2013;110(6):066103. doi: 10.1103/PhysRevLett.110.066103. [DOI] [PubMed] [Google Scholar]
- 18.Park SJ, et al. Visualization of asymmetric wetting ridges on soft solids with X-ray microscopy. Nat Commun. 2014;5:4369. doi: 10.1038/ncomms5369. [DOI] [PMC free article] [PubMed] [Google Scholar]
- 19.Style RW, et al. Stiffening solids with liquid inclusions. Nat Phys. 2015;11:82–87. [Google Scholar]
- 20.Style RW, Wettlaufer JS, Dufresne ER. 2014. Surface tension and the mechanics of liquid inclusions in compliant solids. arXiv:1409.1998v1.
- 21.Marchand A, Das S, Snoeijer JH, Andreotti B. Capillary pressure and contact line force on a soft solid. Phys Rev Lett. 2012;108(9):094301. doi: 10.1103/PhysRevLett.108.094301. [DOI] [PubMed] [Google Scholar]
- 22.Majumder A, Ghatak A, Sharma A. Microfluidic adhesion induced by subsurface microstructures. Science. 2007;318(5848):258–261. doi: 10.1126/science.1145839. [DOI] [PubMed] [Google Scholar]
- 23.Majumder A, Tiwari AK, Korada K, Ghatak A. Microchannel induced surface bulging of soft elastomeric layer. J Adhes Sci Technol. 2010;24(15-16):2681–2692. [Google Scholar]
- 24.Nadermann N, Hui C-Y, Jagota A. Solid surface tension measured by a liquid drop under a solid film. Proc Natl Acad Sci USA. 2013;110(26):10541–10545. doi: 10.1073/pnas.1304587110. [DOI] [PMC free article] [PubMed] [Google Scholar]
- 25.Chakrabarti A, Chaudhury MK. Attraction of mesoscale objects on the surface of a thin elastic film supported on a liquid. Langmuir. 2015;31(6):1911–1920. doi: 10.1021/la502236r. [DOI] [PubMed] [Google Scholar]
- 26.Ghatak A, Chaudhury MK. Adhesion-induced instability patterns in thin confined elastic film. Langmuir. 2003;19(7):2621–2631. [Google Scholar]
- 27.Verma MKS, Majumder A, Ghatak A. Embedded template-assisted fabrication of complex microchannels in PDMS and design of a microfluidic adhesive. Langmuir. 2006;22(24):10291–10295. doi: 10.1021/la062516n. [DOI] [PubMed] [Google Scholar]
- 28.Butler IB, Schoonen MA, Rickard DT. Removal of dissolved oxygen from water: A comparison of four common techniques. Talanta. 1994;41(2):211–215. doi: 10.1016/0039-9140(94)80110-x. [DOI] [PubMed] [Google Scholar]
- 29.Lee JN, Park C, Whitesides GM. Solvent compatibility of poly(dimethylsiloxane)-based microfluidic devices. Anal Chem. 2003;75(23):6544–6554. doi: 10.1021/ac0346712. [DOI] [PubMed] [Google Scholar]
- 30.Chaudhury MK, Whitesides GM. Direct measurement of interfacial interactions between semispherical lenses and flat sheets of poly(dimethylsiloxane) and their chemical derivatives. Langmuir. 1991;7(5):1013–1025. [Google Scholar]
- 31.Chaudhury MK, Whitesides GM. Correlation between surface free energy and surface constitution. Science. 1992;255(5049):1230–1232. doi: 10.1126/science.255.5049.1230. [DOI] [PubMed] [Google Scholar]


