Abstract
Acetylation homeostasis is thought to play a role in amyotrophic lateral sclerosis, and treatment with inhibitors of histone deacetylases has been considered a potential and attractive therapeutic approach, despite the lack of a thorough study of this class of proteins. In this study, we have considerably extended previous knowledge on the expression of 13 histone deacetylases in tissues (spinal cord and muscle) from mice carrying two different ALS-linked SOD1 mutations (G93A-SOD1 and G86R-SOD1). We have then focused on class III histone deacetylases SIRT1 and SIRT2 that are considered relevant in neurodegenerative diseases. SIRT1 decreases in the spinal cord, but increases in muscle during the progression of the disease, and a similar expression pattern is observed in the corresponding cell models (neuroblastoma and myoblasts). SIRT2 mRNA expression increases in the spinal cord in both G93A-SOD1 and G86R-SOD1 mice but protein expression is substantially unchanged in all the models examined. At variance with other sirtuin modulators (sirtinol, AGK2 and SRT1720), the well-known SIRT1 inhibitor Ex527 has positive effects on survival of neuronal cells expressing mutant SOD1, but this effect is neither mediated by SIRT1 inhibition nor by SIRT2 inhibition. These data call for caution in proposing sirtuin modulation as a target for treatment.
Accumulating evidence indicates that altered acetylation homeostasis has a determinant role in the pathogenesis of amyotrophic lateral sclerosis (ALS), a late-onset neurodegenerative disorder characterized by progressive muscle atrophy and paralysis because of the death of upper and lower motoneurons.1
Acetylation is controlled by two classes of enzymes with opposite function: histone acetyltransferases (HATs) and histone deacetylases (HDACs). During neurodegeneration, the levels of acetylation in neurons are decreased globally2, 3 as a consequence of an imbalance in the acetylation apparatus because of general loss of HATs.4, 5, 6 Once the balance is disturbed and the HAT/HDAC ratio shifts in favor of HDAC in terms of availability and enzymatic functionality, an altered transcription profile is observed, typically represented by the repression of pro-survival molecules and the derepression of several pro-apoptotic gene products.2, 3 Thus, in the past decade, the use of HDAC inhibitors has been considered a potential and attractive therapeutic approach.5, 7, 8, 9, 10, 11
In mammals, 18 HDACs have been identified and classified based on cofactor dependency and sequence similarity. Two families have been described: the ‘classical' HDACs with 11 members that require Zn2+ for deacetylase activity, and the sir2-related HDACs called Sirtuins (silent information regulator (SIRT)) with 7 members that require NAD+ as cofactor.
Up to date, little is known about the involvement of the individual HDAC isoforms in ALS onset and progression and a thorough survey of all isoforms has never been carried out.
Previous work on post-mortem ALS brain and spinal cord specimens indicates a reduction of HDAC11 mRNA and increased HDAC2 levels.12
A crucial role of muscle HDAC4 and its regulator microRNA-206 was suggested in the G93A-SOD1 mouse model of ALS13 and, more recently, it has been observed that HDAC4 mRNA and protein levels in muscle are greater in patients with rapidly progressive ALS, and this negatively influences reinnervation.14 These studies strongly suggest a negative role of muscle HDAC4 upregulation on the reinnervation process.
The role of HDAC6 is still debated, possibly because it catalyzes multiple reactions.15 An in vitro interaction between TDP-43 and HDAC6 has been demonstrated, suggesting that the lack of activity of HDAC6 induced by TDP-43 may be a pathogenic factor in ALS.16 More recently, Taes et al.17 reported that the deletion of HDAC6 in an ALS mouse model significantly extends survival and maintains motor axon integrity without affecting disease onset. This protective effect is associated with increased α-tubulin acetylation. However, it has also been reported that HDAC6 knockdown increases mutant Cu–Zn superoxide dismutase (SOD1) aggregation in cultured cells and mutant G93A-SOD1 can modulate HDAC6 activity and increase tubulin acetylation.18
Some experimental evidence for a role of Sirtuins in ALS is also available. SIRT1 overexpression protects neurons against toxicity induced by mutant G93A-SOD1 in both cultured neurons and mouse brain.19 SIRT1 is upregulated in the spinal cord of mutant G37R-SOD1 mice,19 in the cortex, hippocampus, spinal cord and thalamus of G93A-SOD1 transgenic mice20 and in spinal neurons from post-mortem patient samples,21 whereas it is reduced in primary motor cortex.21 Deletion of SIRT2 fails to affect the disease course, and also does not modify α-tubulin acetylation in the G93A-SOD1 mouse,17 whereas SIRT3 protects against mitochondrial fragmentation and neuronal cell death induced by mutant SOD1.22
Thus, the proposed neuroprotective/neurotoxic role of Sirtuins still remains debated.21
With the aim to better understand whether specific HDAC isoforms play a major role in ALS onset and progression and whether their modulation may rescue the ALS phenotype, in this work we analyzed the specific expression pattern of all HDACs in spinal cord and muscle from two ALS transgenic mice models (G93A-SOD1 and G86R-SOD1) and in neuronal and muscle cell cultures expressing mutant SOD1.
Only a few HDACs showed an altered expression profile in ALS tissues and therefore we focused our interest on the most extensively studied SIRT1 and on treatment with its known modulators.
Results
Expression of selected HDAC isoforms is modulated during progression of the disease in mice
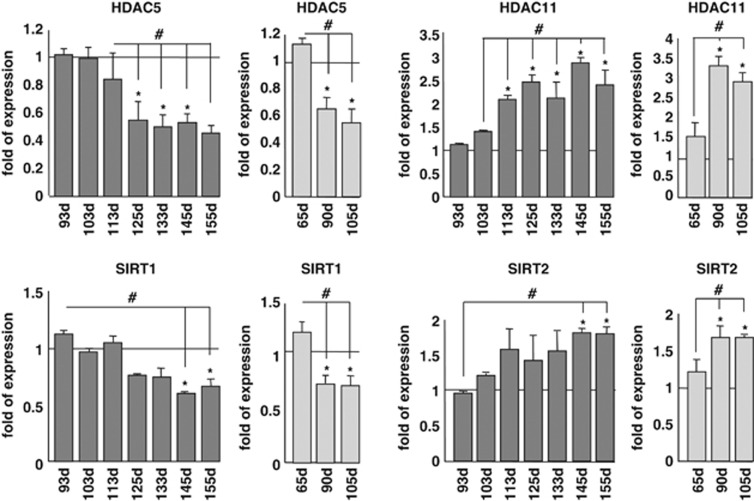
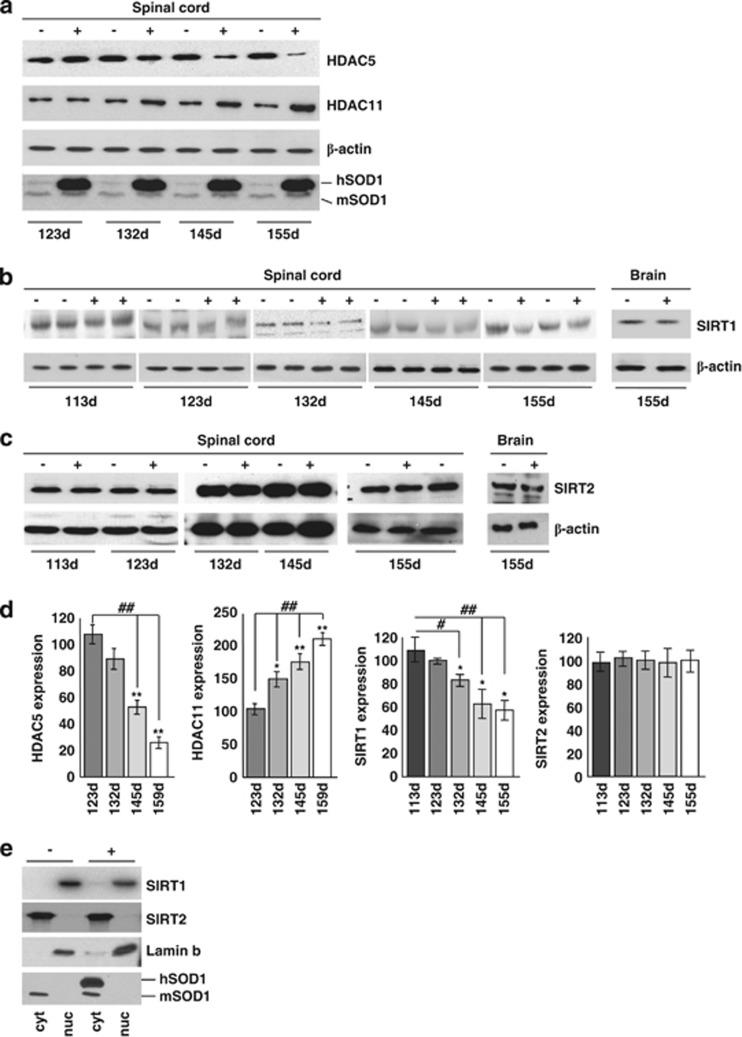
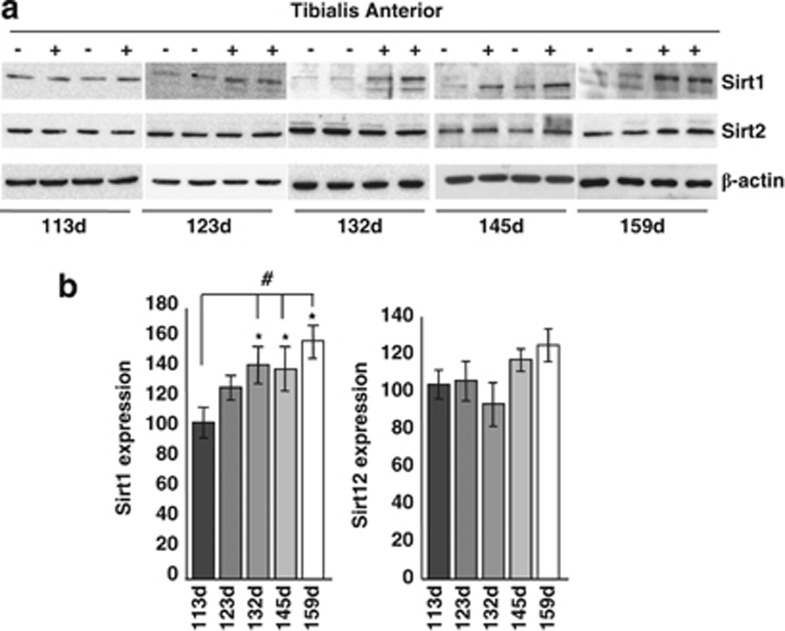
In order to get a complete picture of known HDACs in the course of ALS, we have performed an extended analysis of the expression of all HDACs by real-time PCR (RT-PCR) on mRNA extracted from the spinal cord of two well-characterized models for mutant SOD1-linked ALS. Both G93A-SOD1 and G86R-SOD1 transgenic mice essentially recapitulate the human form of the disease, although with a difference in age of onset and survival (see Materials and Methods). In this paper, we report data on all the 11 canonical class I–II–IV isoforms and two class III Sirtuins (SIRT1 and SIRT2). We have not been able to monitor SIRT4–7, possibly because of their low level of expression. Data on SIRT3 are the subject of a separate paper (C Valle et al., manuscript in preparation). In the spinal cord, mRNA expression of most HDACs is not grossly affected (Supplementary Figure S1) during the course of the disease in both mice strains compared with age-matched nontransgenic littermates, with the notable exception of HDAC5 and SIRT1 that clearly decrease during progression and HDAC11 and SIRT2 that clearly increase in this tissue during progression of the disease (Figure 1). As observed in western blot analysis from the same tissue, this trend is conserved at the level of immunoreactive protein for HDAC5, HDAC11 and SIRT1, although changes are slightly delayed in the course of the disease, whereas SIRT2 protein level is not significantly altered (Figures 2a–d and Supplementary Figure S2). Furthermore, expression of mutant SOD1 does not change the localization of SIRT1, which is mainly nuclear, and of SIRT2, which is mainly cytosolic, as in nontransgenic mice (Figure 2e). Interestingly, the expression pattern of SIRT1 and SIRT2 is not conserved in the muscle (tibialis anterior) from G93A-SOD1 transgenic mice, where SIRT1 increases and SIRT2 is not changed during the disease (Figures 3a and b).
Figure 1.
Expression of selected mRNAs coding for HDACs in the spinal cord of ALS mice. The cDNAs obtained from total RNA extracted from spinal cord of G93A-SOD1 (dark bars) and G86R-SOD1 (light bars) transgenic mice and their nontransgenic littermates were analyzed by quantitative RT-PCR to assess mRNA expression of HDAC5, HDAC11,SIRT1 and SIRT2. Analysis was performed at different stages of disease starting from early presymptomatic to end stage. The mRNA levels from control mice are set as 1. Results were obtained from at least three different mice from each stage and are expressed as the ratio between the average of values, normalized to the average values of two different housekeeping genes, from nontransgenic and transgenic mice. *P<0.05 with respect to nontransgenic mice of the same age; #P<0.05 with respect to presymptomatic or early symptomatic transgenic mice for G93A-SOD1 genotype, and with respect to presymptomatic or symptomatic transgenic mice for G86R-SOD1 genotype
Figure 2.
HDAC protein expression in spinal cord of ALS mice. (a) Western blot analysis of 30 μg of total protein extract from spinal cord of transgenic (+) and nontransgenic (−) G93A-SOD1 mice from symptomatic (123d) to end stage (155d) of disease using antibodies against HDAC5 and HDAC11, β-actin as a loading control and SOD1 to confirm genotypes. hSOD1 indicates exogenous human SOD1, and mSOD1 is endogenous mouse SOD1. (b and c) Same as (a) but starting from early symptomatic stage of disease (113d) using antibodies against SIRT1 and SIRT2. Total brain protein extract was used to confirm tissue specificity. (d) Densitometric analysis of data from n=4 G93A-SOD1 and n=4 nontransgenic mice from different experiments. *P<0.05 and **P<0.01 with respect to nontransgenic mice of the same age; ##P<0.01 with respect to symptomatic transgenic mice. (e) Western blot analysis of cytosolic (cyt) and nuclear (nuc) protein extract from late symptomatic (145 days) G93A-SOD1 (G93A) and nontransgenic (−) mice using antibodies against SIRT1 and SIRT2. Fractions were controlled for the presence of the nuclear marker lamin B and the cytosolic marker SOD1
Figure 3.
SIRT1 and SIRT2 expression in the muscle of G93A-SOD1 mice. (a) Western blot analysis of 20 μg of total protein extract from Tibialis anterior of transgenic (+) and nontransgenic (−) G93A-SOD1 mice from symptomatic (113d) to end stage (159d) of disease using antibodies against SIRT1 and SIRT2. β-Actin was used as loading control. (b) Densitometric analysis of n=4 G93A-SOD1 and n=4 nontransgenic mice from different experiments. Values significantly different from relative controls are indicated with *P<0.05 with respect to nontransgenic mice of the same age; #P<0.05 with respect to early symptomatic transgenic mice
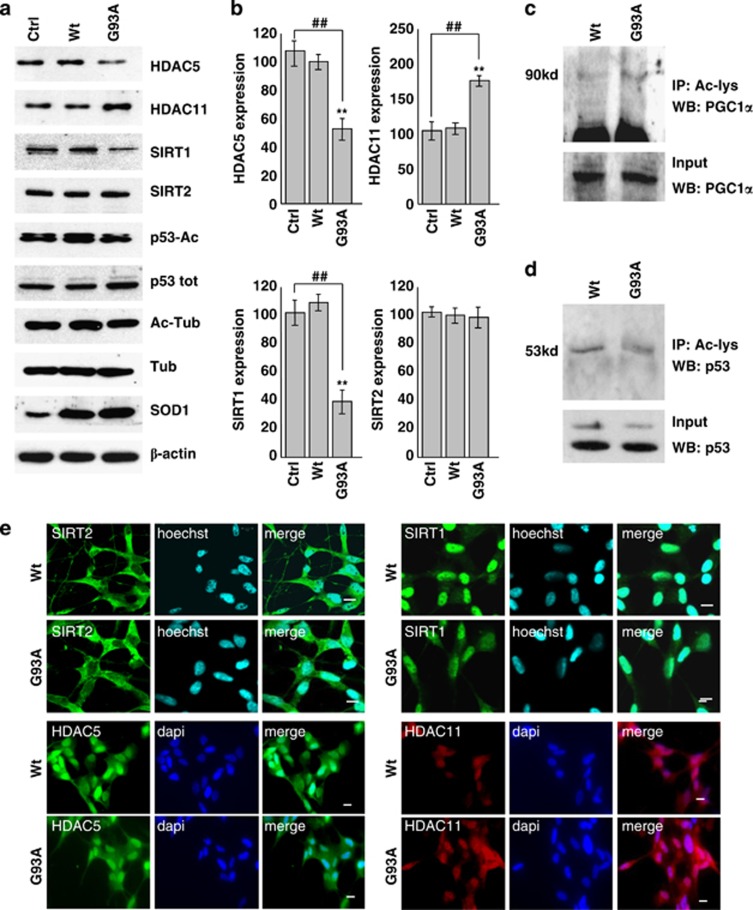
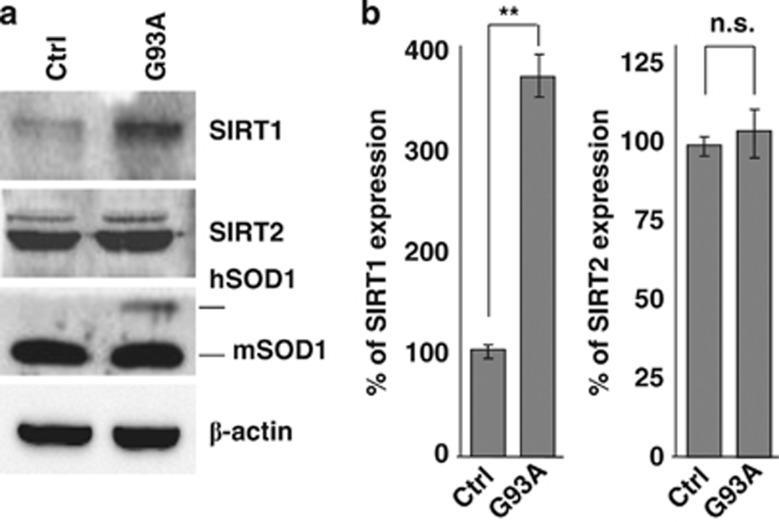
The trend observed in mice tissues is reproduced quite faithfully in both corresponding cell models examined. In differentiated neuronal cells expressing mutant SOD1, protein levels are again decreased for HDAC5 and SIRT1 and increased for HDAC11 (Figures 4a and b). However, upon expression of mutant SOD1, there are no changes in the acetylation state of SIRT1 main targets p53 and PGC1α (Figures 4a, c and d) or main target of SIRT2 tubulin (Figure 4a). Moreover, expression of mutant SOD1 does not change the localization of these proteins as in differentiated SH-SY5Y cells, HDAC5, HDAC11 and SIRT1 are mainly nuclear whereas SIRT2 is cytosolic, as in control cells (Figure 4e). In addition, SIRT1 increases in C2C12 muscle cells expressing G93A- SOD1 (Figures 5a and b) where, at variance with SH-SY5Y cells, p53 is a target of SIRT1 (see below).
Figure 4.
Protein expression patterns of HDAC5, HDAC11, SIRT1 and SIRT2 in differentiated human SH-SY5Y neuroblastoma cells. SH-SY5Y cells were uninfected (Ctrl) or infected with adenoviral vectors coding for wild-type SOD1 (Wt) or G93A-SOD1 (G93A). (a) Western blot analysis of 20 μg of cell lysate using antibodies against HDAC5, HDAC11, SIRT1, SIRT2, p53-Ac and Ac-tubulin. β-Actin was used as loading control, SOD1 as infection control, and P-53 and tubulin to monitor the acetylation rate. (b) Densitometric analysis of n=3 experiments as in (a). Values significantly different from relative controls are indicated with **,##P<0.01. (c and d) Western blot analysis to detect PGC1α and p53 acetylation, respectively, in the immunoprecipitate with anti Ac-lysine antibody. In the lower panel, 5% of input is shown. (e) Immunolocalization of HDAC5, HDAC11, SIRT1 and SIRT2. Panels show typical images observed in n=3 independent experiments. Scale bar: 5 μm
Figure 5.
Protein expression patterns of SIRT1 and SIRT2 in mouse myoblast C2C12 cells. Untransfected C2C12 (Ctrl) and C2C12 cells constitutively expressing G93A-SOD1 (G93A) were subjected to differentiation protocol to induce expression of the transgene under the myosin heavy chain promoter. (a) Western blot analysis of 20 μg protein from cells lysates obtained 5 days after differentiation of C2C12 cells expressing G93A-SOD1 (G93A) or untransfected (Ctrl) using antibodies against SIRT1 and SIRT2. SOD1 was used to control genotype, β-actin as loading control. (b) Densitometric analysis of n=3 experiments as in (a). Values significantly different from relative controls are indicated with **P<0.01; n.s. indicates values that do not differ significantly
Modulation of sirtuins and protection from cell damage
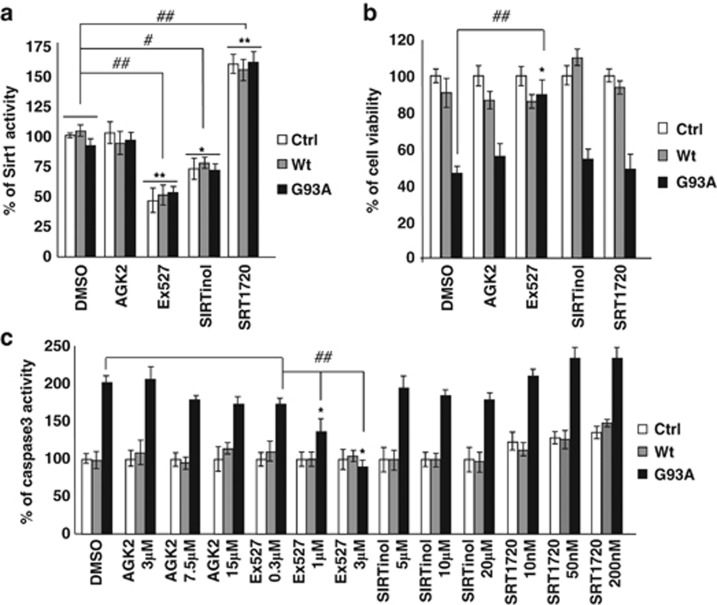
SIRT1 is considered a pro-survival protein,23 whereas the role of SIRT2 is still not clearly established.23 Based on the results reported above, we further investigated whether known inhibitors or activators of SIRT1 are able to mimic the effects of G93A mutant SOD1 or to revert its toxicity in neurons. To this aim, we treated differentiated SH-SY5Y cells expressing Wt or mutant G93A-SOD1 with AGK2 (SIRT2 inhibitor), Ex527 (SIRT1 inhibitor), SIRTinol (SIRT1 and SIRT2 inhibitor) and SRT1720 (SIRT1 activator) (Figure 6a).
Figure 6.
Effect of SIRT1 and SIRT2 modulation in differentiated SH-SY5Y cells. (a) SIRT1 activity was measured by a fluorometric assay on 40 μg of total protein extract from either uninfected (Ctrl) and cells infected with adenoviral vectors coding for Wt-SOD1 (Wt) and G93A-SOD1 (G93A) treated with one of the following: 15 μM AGK2, 3 μM Ex527 and 20 μM SIRTinol that inhibit SIRT2, SIRT1 and both Sirtuins, respectively; and 10 nM SRT1720 that activates SIRT1. Activity is reported as percent of the relative uninfected DMSO-treated control and reported as the mean±S.D. of three independent experiments with each sample in triplicate. Values significantly different from relative controls are indicated with *P<0.05 and **P<0.01 with respect to Ctrl; and #P<0.05 and ##P<0.01 with respect to DMSO-treated cells. (b) SH-SY5Y cells either uninfected (Ctrl) or infected with adenoviral vectors coding for Wt-SOD1 (Wt) and G93A-SOD1 (G93A) were treated with 15 μM AGK2, 3 μM Ex527, 20 μM SIRTinol and 10 nM SRT1720. Cell viability was assessed by the MTS assay 48 h after infection and drug treatments. Absorbance at 490 nm are expressed as percent of the relative uninfected control cells and reported as the mean±S.D. of three independent experiments made in triplicate. Values significantly different from relative controls are indicated with *P<0.05 with respect to Ctrl and ## P<0.01 with respect to DMSO-treated cells. (c) Cells either uninfected (Ctrl) or infected with adenoviral vectors coding for Wt-SOD1 (Wt) and G93A-SOD1 (G93A) were treated with three increasing doses of AGK2, Ex527, SIRTinol or SRT1720. Cell protein extracts were assayed, 48 h after infection and drug treatment, for Caspase-3 activity by a fluorescence enzymatic assay and reported as percent of the relative uninfected control cells. Mean±S.D. of four independent experiments is given. Values significantly different from the relative controls are indicated with *P<0.05 with respect to Ctrl and ##P<0.01 with respect to DMSO-treated cells
As shown in Figure 6, only Ex527 is able to restore viability in neuronal cells infected with viral vectors coding for the mutant protein (Figure 6b) and to prevent caspase-3 activation in a dose-dependent manner (Figure 6c). SIRTinol, which similarly to Ex527 efficiently inhibits SIRT1 activity, has no positive effect in preventing toxicity by mutant SOD1 and SRT1720, which efficiently increases SIRT1 activity, neither affects basal viability nor modulates SOD1 toxicity.
G93A-SOD1 toxicity is not mediated by p53 acetylation state or by IRS-2/Ras/ERK1/2 pathway
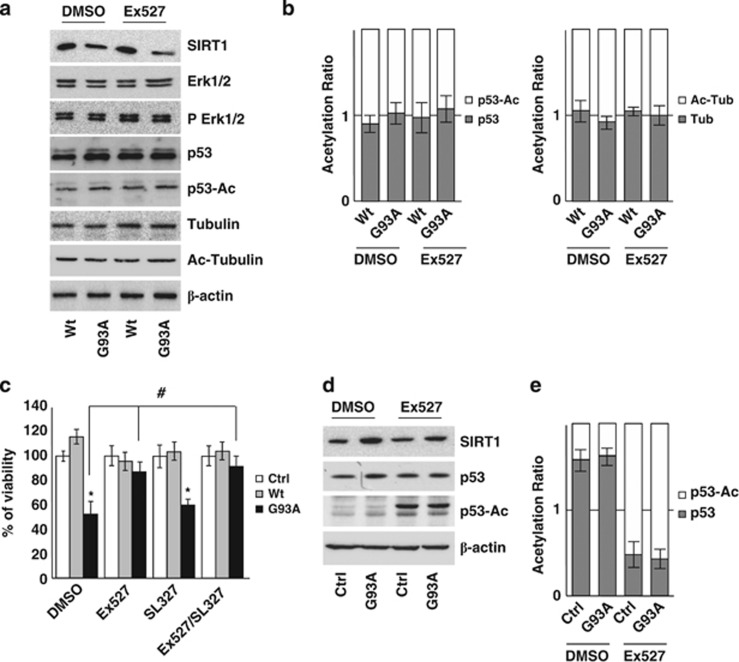
Overall, the above results suggest that Ex527 counteracts mutant SOD1 toxicity in neuronal cells independently from SIRT1 inhibition. Indeed, by western blot analysis we could neither detect significant differences in the level of acetylated p53 (SIRT1 direct target) nor in the level of Erk1/2 and phospho-Erk1/2 in SH-SY5Y cells (Figures 7a and b). At the same time, the level of acetylated tubulin also remains unchanged (Figures 7a and b). Furthermore, the MEK1/2 inhibitor SL327, which is known to act immediately upstream of ERK1/2 in the IRS-2/Ras/Erk1/2 pathway, does not protect SH-SY5Y cells from G93A-SOD1 toxicity (Figure 7c). Similar results were obtained with MEK inhibitor UO126 (not shown). Interestingly, p53 is a target of SIRT1 acetylation in C2C12 cells (Figures 7d and e) but not in SH-SY5Y cells.
Figure 7.
G93A-SOD1 toxicity is not mediated by p53 acetylation state or by IRS-2/Ras/ERK1/2 pathway in SH-SY5Y cells. (a) Western blot analysis of 20 μM of total protein extract from cells infected with adenoviral vectors coding for Wt-SOD1 (Wt) and G93A-SOD1 (G93A) and treated with 3 μM Ex527 or DMSO. Antibodies against SIRT1, Erk1/2, pErk1/2, p53, p53-Ac, tubulin and Ac-tubulin were used. β-Actin was used as loading control. One representative blot is shown from three independent experiments giving comparable results. (b) Densitometric analysis of results as in (a); data are expressed as acetylation ratio of p53 and tubulin. (c) Cells infected with adenoviral vectors coding for Wt-SOD1 (Wt) and G93A-SOD1 (G93A) were treated with 3 μM Ex527 or with 3 μM SL327 or both. Cell viability was assessed and reported for Figure 5a. Values significantly different from relative controls are indicated with *P<0.05 with respect to Ctrl and #P<0.05 with respect to DMSO. (d) Western blot analysis of 20 μM of total protein extract from C2C12 cells differentiated for 5 days and expressing G93A-SOD1 (G93A) or untransfected (Ctrl). Antibodies against SIRT1, p53 and p53-Ac were used. β-Actin was used as loading control. One representative blot is shown from three independent experiments giving comparable results. (e) Densitometric analysis of data as in (d); data are expressed as acetylation ratio of p53
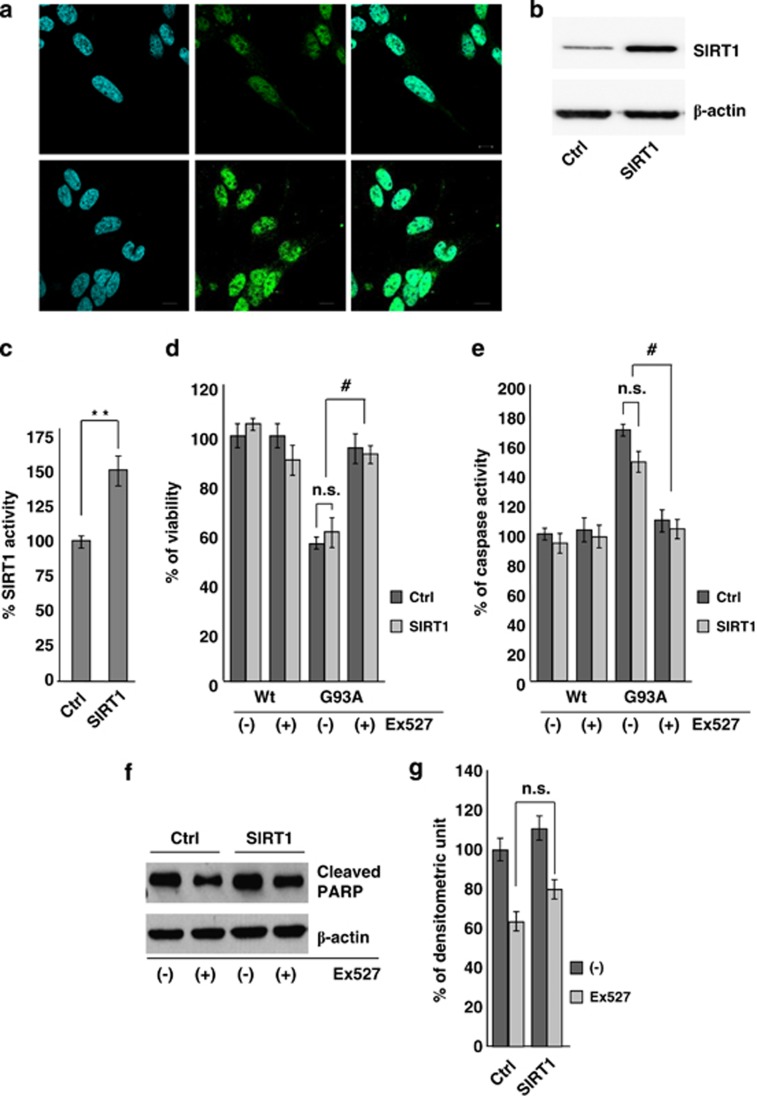
That the protective effect of Ex527 is independent from SIRT1 inactivation is further demonstrated by results reported in Figure 8. Constitutive overexpression of SIRT1 in SH-SY5Y cells (Figures 8a and b) efficiently increases SIRT1 activity (Figure 8c) but is not able to protect cells from mutant SOD1 toxicity in terms of viability (Figure 8d), caspase-3 activation (Figure 8e) and PARP cleavage (Figures 8f and g).
Figure 8.
Constitutive overexpression of SIRT1 does not protect differentiated SH-SY5Y neuroblastoma cells from G93A-SOD1 toxicity. (a) Immunofluorescence analysis on SH-SY5Y cells untransfected or stably transfected for SIRT1 overexpression using antibodies against SIRT1. Scale bar: 10 μm. (b) Western blot analysis of 20 μg of total protein extract from cells either untransfected (Ctrl) or stably transfected for SIRT1 overexpression (SIRT1) using antibodies against SIRT1 and β-actin as a loading control. One representative blot from three independent experiments giving comparable results is shown. (c) SIRT1 activity was measured by a fluorometric assay on 40 μg of total protein extract from either untransfected (Ctrl) or stably transfected cells (SIRT1). Activity is reported as percent of control cells and as the mean±S.D. of three independent experiments with each sample done in triplicate. Values significantly different from relative controls are indicated with **P<0.01 with respect to Ctrl. (d) Cell viability of untransfected (Ctrl) and stably transfected (SIRT1) cells infected with adenoviral vectors coding for Wt-SOD1 (Wt) and G93A-SOD1 (G93A). Values are the mean±S.D. of three independent experiments in triplicate. Values that do not differ significantly are marked with n.s. (e) Total protein extracts from cells as in (d) and treated with 3 μM Ex527 were assayed after 48 h for Caspase-3 activity. Data are reported as the mean±S.D. of three independent experiments. Values that do not differ significantly with respect to the relative control are marked with n.s; #P<0.05 significantly different with respect to DMSO. (f) Western blot analysis of cleaved PARP in 20 μg of total protein extract from cells as in (d) and treated with DMSO (−) or 3 μM Ex527 (+). Antibodies against β- actin were used as loading control. One representative blot is shown from three independent experiments giving comparable results. (g) Densitometric analysis of n=4 experiments as in (f). n.s. indicates values that do not differ significantly
Discussion
The use of HDAC inhibitors has been repeatedly suggested as a potential and attractive therapeutic approach for ALS treatment. However, in our opinion, the results in the literature and in this work should be pondered critically before any clinical attempt.
This consideration arises from the following observations:
(1) The pattern of expression of the various HDAC isoforms is not conserved between spinal cord and muscle of ALS mice. This suggests that systemic administration of any known modulator of these enzymes would have conflicting outcomes in different tissues and possibly bring no benefit to patients.
(2) Current knowledge of HDAC activity is still incomplete. For instance, data in this work suggest that p53 is not a molecular target of SIRT1 in neuronal cells, whereas it is SIRT1 dependent in muscle cells, at least in culture conditions where there is no neuron–muscle cross-talk. This implies that HDAC targets may be different in different cell types or tissues and may reflect a different role of these proteins in specific cell types, where they may exert a protective role or contribute to increase toxicity from the expression of G93A-SOD1. This is in line with a recent report17 that tubulin is not a major target of SIRT2 in the nervous system.
(3) Current knowledge of HDAC modulators is still incomplete. Based on the observation that SIRT1 is downregulated during progression of the disease in spinal cords of ALS mice, in this work we have focused on the possibility to activate SIRT1 as a neuroprotective strategy.
SIRT1 mediates heterochromatin formation through deacetylation of histones H1, H3 and H4,24, 25 and is also involved in the acetylation of nonhistone proteins, mainly transcription factors or coactivators, including p53, FOXOs, PGC1α, p73, BCL6 and others.26, 27, 28 Because of its ability to deacetylate a variety of substrates, SIRT1 is considered an important regulatory key in a broad range of physiological functions, including tumorigenesis,29 metabolism,30 aging31 and neurodegeneration.32, 33, 34
We analyzed the effects of different activators/inhibitors on SH-SY5Y cells infected with adenoviral vector coding for G93A-SOD1. Unexpectedly, SIRT1 inhibitor Ex527 is the only drug that is able to rescue the ALS phenotype in the neuronal cells expressing the mutant protein. Ex527 was originally described as a compound inhibiting the activity of SIRT1 in nanomolar concentration (and SIRT2 at micromolar concentrations). However, SIRTinol, which similarly to Ex527 efficiently inhibits SIRT1 activity, and AGK2, which inhibits SIRT2 activity, have no positive effect in this model. Furthermore, the beneficial effect of Ex527 seems to be independent of the known SIRT1 pathway in these cells and overexpression of SIRT1 per se does not counteract mutant SOD1 toxicity. Interestingly, SRT1720 efficiently increases SIRT1 activity without affecting basal viability or modulating SOD1 toxicity. This supports that SIRT1 is not a pro-survival protein in the ALS context.
Finally, Ex527 efficiently stimulates p53 acetylation in muscle cells where SIRT1 is increased by mutant SOD1 expression whereas it has no effect on the same target in neuronal cells (Figure 7).
Overall, these data suggest that SIRT1 inhibitor Ex527 has other, previously unappreciated and possibly tissue-specific properties that should be further investigated. Understanding the mechanisms underlying the neuroprotective effects of Ex527 on neurons may offer new perspective to develop innovative strategies for treating ALS and neurodegenerative disorders.
Materials and Methods
Antibodies and reagents
The antibodies used in this study are: anti-HDAC1, anti-HDAC2, anti-SIRT2 and anti-PGC1 rabbit polyclonal (Santa Cruz Biotechnology, Dallas, TX, USA); anti-HDAC3, anti-HDAC6 and anti-lamin B goat polyclonal (Santa Cruz Biotechnology); anti-HDAC4 mouse polyclonal (Santa Cruz Biotechnology); anti-HDAC5 and anti-HDAC11 rabbit polyclonal (Abcam, Cambridge, UK); anti-HDAC7 rabbit polyclonal (Novus Biologicals, Littleton, CO, USA); anti-HDAC8 and anti-HDAC9 mouse monoclonal (Novus Biologicals); anti-HDAC10 rabbit polyclonal (Millipore, Burlington, MA, USA); anti-SIRT1 (mouse specific), anti-acetylated-lysine, anti-cleaved-PARP, anti-ERK1/2 and anti-Phospho-ERK1/2 rabbit polyclonal (Cell Signaling Technology, Beverly, MA, USA); anti-SIRT1 clone 10E4 mouse monoclonal (Millipore); anti-SIRT1 rabbit polyclonal (Millipore); anti-acetyl-p53 rabbit monoclonal (Millipore); anti-p53 mouse monoclonal (Abcam); anti-tubulin, anti-acetyl-tubulin and anti-β-actin mouse monoclonal (Sigma-Aldrich, St. Louis, MO, USA); anti-SOD1 rabbit polyclonal (Enzo Life Science, Plymouth Meeting, PA, USA); anti-rabbit, anti-mouse and anti-goat peroxidase-conjugated secondary antibody (Amersham, Pittsburgh, PA, USA); and anti-rabbit, anti-mouse FITC or Cy3-conjugated secondary antibody (Sigma-Aldrich). All antibodies were used at the dilution recommended by the manufacturer's instructions.
AGK2, Ex527, Sirtinol, SRT1720 and SL327 were from Tocris Bioscience (Bristol, UK); all of them were resuspended in an appropriate volume of DMSO and kept stored at −80°C before use.
All reagents used, unless otherwise specified, were from Sigma-Aldrich.
Animals
All animal procedures have been performed according to the European Guidelines for the use of animals in research (86/609/CEE) and the requirements of Italian and French laws (D.L. 116/92, Directive 2010/63/EU). The ethical procedure has been approved by the Animal welfare office, Department of Public Health and Veterinary, Nutrition and Food Safety, General Management of Animal Care and Veterinary Drugs of the Italian Ministry of Health (Application number 32/08 of 7 July 2008; Approval number 744 of 9 January 2009) and the regional ethics committee CREMEAS 35 (approval number AL/01/20/12). All the experiments were performed by authorized investigators.
All animals have been raised and crossed in the indoor animal house in a 12 h light/dark cycle in a virus/antigen-free facility with controlled temperature and humidity and have been provided with water and food ad libitum.
G93A-SOD1 mice B6.Cg-Tg(SOD1 G93A)1Gur/J were purchased from The Jackson Laboratory (Bar Harbor, ME, USA) and were on C57BL/6J background. In our animal house, these mice have an onset of disease at 113±6 days (determined as previously described35) and survival of 156±8 days.
G86R-SOD1 mice were initially obtained from Jon W Gordon (NewYork, NY, USA). In our animal house, these mice have an onset of disease at 90±4 days and survival of 108±5 days.
Mice compared in this study were all littermates and housed together to minimize environmental factors. Mice were genotyped using PCR protocols from The Jackson Laboratory or as previously described.36 At the indicated time, mice were anesthetized with 40+5 mg/kg ketamine–xylazine, killed and dissected for the different experiments. All efforts were made to minimize suffering.
For the staging of the disease of transgenic mice we relied on previous studies from our laboratories.5, 35, 37
Cell culture, adenoviral infection and plasmid transfection
Human neuroblastoma cells (SH-SY5Y, from European Collection of Cell Cultures, Salisbury, UK) and murine myoblasts (C2C12, either untransfected or transfected for the inducible expression of G93A-SOD1, a kind gift of Dr A Musarò) were grown in DMEM-Glutamax (Invitrogen, Carlsbad, CA, USA) supplemented with 10% FCS (Invitrogen) at 37°C in an atmosphere of 5% CO2 in air.
Where specified, SH-SY5Y cells were subjected to a differentiation protocol as previously described.38 Briefly, cells plated at the density of 25 × 103 cells/cm2 were washed with PBS and differentiated in DMEM-Glutamax supplemented with 1% N-2 (Invitrogen) without serum by the addition of 10 μM retinoic acid for 3 days, after which with 100 ng/ml brain-derived neurotrophic factor was added to the medium and cells were kept for 3 more days in culture.
Myogenic differentiation of C2C12 cells at ∼80% cell confluence was obtained by substituting the medium with fresh medium supplemented with 2% horse serum (EuroClone, Milan, Italy) to induce expression of mutant SOD1 under the myosin heavy chain promoter.39, 40
Construction of recombinant adenoviruses expressing Wt-SOD1 as well as G93A-SOD1 was carried out in a previous work.37 Infection of SH-SY5Y cells was carried out for 1 h in OPTIMEM (Invitrogen); after removal of the virus, cells were subjected to the differentiation protocol and grown for the indicated period of times before being used for further experimental manipulations.
Human cDNA coding for SIRT1 (accession number AF083106) was cloned by reverse transcription-PCR from human SH-SY5Y neuroblastoma cell cDNA using the forward primer 5′-AAAAAGCTTATGGCGGACGAGGCGGCC-3′ and the reverse primer 5′- TTTCTCGAGCTATGATTTGTTTGATGGATAG-3′. The resulting PCR fragment was inserted into HindIII/XhoI restriction sites of pcDNA3 (Invitrogen). Plasmid construction was verified by automated sequencing. Transfection for either transient or stable expression of SIRT1 was obtained with Lipofectamine Plus reagent (Invitrogen) according to the manufacturer's instructions.
For stable expression, after selection with 400 μg/ml G418 (Gibco BRL, Grand Island, NY, USA), ∼25 clones were isolated independently and analyzed in western blot with anti-SIRT1 antibodies. Three clones were chosen for equivalent expression of SIRT1 proteins and used for further analysis. All the clones analyzed gave consistent results and data from one clone are shown.
Conditions for treatments with Sirtuins modulators are given in the Figure legends. All drugs were added to the culture medium starting from infection/differentiation protocol and were maintained in all medium changes. Medium with or without experimental drugs was replaced every 3 days.
RNA extraction, reverse transcription and RT-PCR
Total RNA was extracted from spinal cord and muscle of transgenic mice and their nontransgenic littermates at different stages of disease using TRIzol reagent (Invitrogen). The SuperScript III First-Strand reverse transcription system (Invitrogen) was used to synthesize cDNA, with 1 mg of total RNA and random hexamers, according to the manufacturer's instructions. Appropriate negative controls were included (without reverse transcriptase) to determine the presence of genomic DNA contamination. Samples with genomic contamination were treated with DNase I, Amp Grade (Invitrogen) following the manufacturer's instructions.
RT-PCR analysis was performed on custom-designed plates from Roche (Hilden, Germany). Each well contained primers (see Table 1) and probes (UPL (Universal Probe Library) probe) specific for the genes of interest (all canonical HDACs and SIRT1 and SIRT2) designed to pair up within regions to be amplified. Each test was performed in duplicate. As a control for the efficiency of reverse transcription and RNA quality, some wells were prepared with specific oligonucleotides designed to amplify the 3′, 5′ and central regions of the template; in order to exclude genomic contamination, untranscribed RNA samples were loaded in two wells as negative controls. As housekeeping genes we chose β-actin and glucose-6-phosphate dehydrogenase (G6pdx); both were used for normalization of each sample through the dedicated software (see below). Finally, two wells contained the specific reagents for the human SOD1 in order to have a further control of mice genotype. RT-PCR was performed on G93A-SOD1, G86R-SOD1 and the corresponding nontransgenic control littermate mice. The plates were sealed with a sheet of adhesive plastic and the reaction was carried out in the thermal cycler LightCycler 480 (Roche).
Table 1. List of primers and probes used for Real Time PCR.
| Target | Forward primer (5′–3′) | Reverse primer (5′–3′) | UPL probe number |
|---|---|---|---|
| Mm|Hdac1 | TGGTCTCTACCGAAAAATGGAG | TCATCACTGTGGTACTTGGTCA | 73 |
| Mm|Hdac2 | AAAGGAGCAAAGAAGGCTAGG | GTCCTTGGATTTGTCTTCTTCC | 94 |
| Mm|Hdac3 | TTCAACGTGGGTGATGACTG | TTAGCTGTGTTGCTCCTTGC | 32 |
| Mm|Hdac4 | CACACCTCTTGGAGGGTACAA | AGCCCATCAGCTGTTTTGTC | 53 |
| Mm|Hdac5 | GAGTCCAGTGCTGGTTACAAAA | TACACCTGGAGGGGCTGTAA | 105 |
| Mm|Hdac6 | CGCTGTGTGTCCTTTCAGG | CAGATCAATGTATTCCAGGCTGT | 17 |
| Mm|Hdac7 | CCATGGGGGATCCTGAGT | GCAAACTCTCGGGCAATG | 71 |
| Mm|Hdac8 | GGTGATGAGGACCATCCAGA | TCCTATAGCTGCTGCATAGTCAA | 5 |
| Mm|Hdac9 | TTGCACACAGATGGAGTGG | GGCCCATAGGAACCTCTGAT | 32 |
| Mm|Hdac10 | TTCCAGGATGAGGATCTTGC | ACATCCAATGTTGCTGCTGT | 60 |
| Mm|Hdac11 | GACGTGCTGGAGGGAGAC | AAAACCACTTCATCCCTCTTCA | 26 |
| Mm|Sirt1 | TCGTGGAGACATTTTTAATCAGG | GCTTCATGATGGCAAGTGG | 104 |
| Mm|Sirt2 | CAAGGAAAAGACAGGCCAGA | GCCTTCTTGGAGTCAAAATCC | 10 |
| Mm|Actβ | AAGGCCAACCGTGAAAAGAT | GTGGTACGACCAGAGGCATAC | 56 |
| Mm|G6pdx | CAGCGGCAACTAAACTCAGA | TTCCCTCAGGATCCCACAC | 53 |
Data analysis was made using LightCycler 480 SW1.5 software (Roche) and the subsequent analysis to make a comparison of different plates was made using LightCycler 480 Multiple Plate Analysis software (Roche).
Tissue homogenates and cell lysis
Total tissue homogenates were obtained by mechanical dissociation using a Teflon manual homogenizer for 30 s in ice in RIPA buffer (50 mM Tris-HCl, pH 8.0, 1% Triton X-100, 0.25% Na-deoxycholate, 0.1% SDS, 250 mM NaCl, 5 mM EDTA and 5 mM MgCl2) containing a 1 : 1000 dilution of protease inhibitor cocktail (Sigma-Aldrich). For tibialis anterior homogenates, samples had been previously incubated for 30 min in 0.25% Trypsin/EDTA (Invitrogen) at 37°C.
Cell lysates were obtained by resuspending pelleted cells in RIPA buffer.
A clear supernatant was obtained by centrifugation of tissue homogenates or cell lysates at 17 000 × g for 10 min and protein content was determined using the Bradford protein assay (Bio-Rad, Hercules, CA, USA). Nuclear and cytosolic fractions from spinal cord were obtained using a low-salt buffer (10 mM Hepes, pH 7.4, 42 mM KCl, 5 mM MgCl2, 0.5% CHAPS, 1 mM DTT, 1 mM PMSF and 1 mg/ml leupeptin) to homogenate samples; homogenates were then centrifugated at 2000 × g for 10 min, supernatants were collected and analyzed as cytosolic fractions in western blot with antibodies anti-SOD1, whereas pellets were lysed in high-salt buffer (50 mM Tris-HCl, pH 7.5, 400 mM NaCl, 1 mM EDTA, 1% Triton X-100, 0.5% Nonidet-P40, 10% glycerol, 2 mM DTT, 1 mM PMSF, protease inhibitor cocktail (Sigma-Aldrich)) for 30 min on ice. Nuclear lysates were then centrifuged at 20 000 × g, supernatants were collected and analyzed in western blot with antibodies anti-lamin B.
Immunoblot analysis
Protein samples were resolved on SDS-polyacrylamide gels and transferred to Hybond-P PVDF membranes (Amersham). Membranes were blocked for 1 h in TBS, 0.1% Tween 20 and 5% non-fat dry milk, followed by an overnight incubation with primary antibodies (see Materials and Methods) diluted in the same buffer. After washing with 0.1% Tween in Tris-buffered saline, the membrane was incubated with peroxidase-conjugated secondary antibody for 1 h, and then washed and developed using the ECL chemiluminescent detection system (Roche). Densitometric analyses were performed using ImageJ software program (National Institutes of Health, Bethesda, MD, USA; http://imagej.nih.gov/ij/) and normalized against the signal obtained by reprobing the membranes with mouse anti-β-actin or anti-tubulin. The apparent molecular weight of proteins was determined by calibrating the blots with prestained molecular weight markers (Bio-Rad Laboratories, Richmond, CA, USA).
Immunofluorescence analysis
Cell cultures were grown on poly-L-lysine-coated glass slides, fixed in 4% paraformaldehyde for 10 min at room temperature, subsequently permeabilized with 0.1% Triton X-100 for 8 min and washed in PBS. Cells were blocked for 30 min in 2% horse serum in PBS and incubated for 1 h at 37°C with primary antibodies followed by fluorescein- or Cy3-conjugated secondary antibodies. After rinsing in PBS, cells were counterstained with 1 μg/ml Hoechst 33342 and examined with a Zeiss LSM 510 Confocal Laser Scanning Microscope. Fluorescence images were processed using ZEN 2009 (Carl Zeiss, Milan, Italy) and Adobe Photoshop software (Adobe, San Jose, CA, USA).
Immunoprecipitation
Cell lysis was performed in RIPA buffer as described above, protein content was determined using Bradford protein assay (Bio-Rad) and 500 μg of lysates were incubated at 4°C for 2 h with a rabbit polyclonal anti- acetyl-lysine antibody diluted 1 : 100. The immunocomplexes were collected by binding to protein A-Agarose beads (Roche), followed by three washes with lysis buffer and then directly resuspended in Laemmli sample buffer 1 × .
Biochemical assays
Caspase 3 activity was measured with a TruePoint Caspase 3 assay kit (PerkinElmer, Waltham, MA, USA), according to the manufacturer's instructions. Cell viability was assessed by a colorimetric assay using the 3(4,5-dimethylthiazol-2yl)-5-(3-carboxymethoxyphenyl)-2-(4-sulfophenyl)-2H-tetrazolium (MTS) assay (CellTiter 96 Aqueous One Solution Assay, Promega, Madison, WI, USA) according to the manufacturer's instructions. Absorbance at 490 nm was measured in a multilabel counter (Victor3-V, PerkinElmer).
The activity of SIRT1 was measured using the SIRT1 Fluorescent Activity Assay Kit (Enzo Life Science) according to the manufacturer's instructions using a fluorescent emission at 460 nm with excitation at 360 nm.
Statistical analysis
All data are expressed as means±S.D. of n≥3 independent experiments. One-way analysis of variance (ANOVA) followed by Student's t-test was used for statistical evaluations. Values significantly different from the relative control are indicated with an asterisk, and values significantly different from another group are indicated with a hash. The level of significance was chosen as P<0.05.
Acknowledgments
We thank Jean-Philippe Loeffler (INSERM U1118, Strasbourg, France) and Mauro Cozzolino (CNR, Rome, Italy) for critical reading of the manuscript and Monica Nencini (Fondazione Santa Lucia) for skilful technical assistance. Antonio Musarò kindly provided C2C12 cells expressing G93A-SOD1. This work was supported by an ‘Association Française contre les Myopathies' grant to LP and an ‘Association pour la Recherche sur la Sclérose Latérale Amyotrophique et autres Maladies du Motoneurone' grant to FR.
Glossary
- HDAC
histone deacetylase
- HAT
histone acetyltransferase
- ALS
amyotrophic lateral sclerosis
- SOD1
Cu–Zn superoxide dismutase
- SIRT
silent information regulator-sirtuin
- RT-PCR
real-time PCR
- UPL
universal probe library
The authors declare no conflict of interest.
Footnotes
Supplementary Information accompanies this paper on Cell Death and Disease website (http://www.nature.com/cddis)
Edited by A Verkhratsky
Supplementary Material
References
- 1Cozzolino M, Pesaresi MG, Gerbino V, Grosskreutz J, Carrì MT. Amyotrophic lateral sclerosis: new insights into underlying molecular mechanisms and opportunities for therapeutic intervention. Antioxid Redox Signal 2012; 17: 1277–1330. [DOI] [PubMed] [Google Scholar]
- 2Schmalbach S, Petri S. Histone deacetylation and motor neuron degeneration. CNS Neurol Disord Drug Targets 2010; 9: 279–284. [DOI] [PubMed] [Google Scholar]
- 3Saha RN, Pahan K. HATs and HDACs in neurodegeneration: a tale of disconcerted acetylation homeostasis. Cell Death Differ 2006; 13: 539–550. [DOI] [PMC free article] [PubMed] [Google Scholar]
- 4Rouaux C, Jokic N, Mbebi C, Boutillier S, Loeffler JP, Boutillier AL. Critical loss of CBP/p300 histone acetylase activity by caspase-6 during neurodegeneration. EMBO J 2003; 22: 6537–6549. [DOI] [PMC free article] [PubMed] [Google Scholar]
- 5Rouaux C, Panteleeva I, René F, Gonzalez de Aguilar JL, Echaniz-Laguna A, Dupuis L et al. Sodium valproate exerts neuroprotective effects in vivo through CREB-binding protein-dependent mechanisms but does not improve survival in an amyotrophic lateral sclerosis mouse model. J Neurosci 2007; 27: 5535–5545. [DOI] [PMC free article] [PubMed] [Google Scholar]
- 6Rouaux C, Loeffler JP, Boutillier AL. Targeting CREB-binding protein (CBP) loss of function as a therapeutic strategy in neurological disorders. Biochem Pharmacol 2004; 68: 1157–1164. [DOI] [PubMed] [Google Scholar]
- 7Ryu H, Smith K, Camelo SI, Carreras I, Lee J, Iglesias AH et al. Sodium phenylbutyrate prolongs survival and regulates expression of anti-apoptotic genes in transgenic amyotrophic lateral sclerosis mice. J Neurochem 2005; 93: 1087–1098. [DOI] [PubMed] [Google Scholar]
- 8Sugai F, Yamamoto Y, Miyaguchi K, Zhou Z, Sumi H, Hamasaki T et al. Benefit of valproic acid in suppressing disease progression of ALS model mice. Eur J Neurosci 2004; 20: 3179–3183. [DOI] [PubMed] [Google Scholar]
- 9Del Signore SJ, Amante DJ, Kim J, Stack EC, Goodrich S, Cormier K et al. Combined riluzole and sodium phenylbutyrate therapy in transgenic amyotrophic lateral sclerosis mice. Amyotroph Lateral Scler 2009; 10: 85–94. [DOI] [PubMed] [Google Scholar]
- 10Yoo YE, Ko CP. Treatment with trichostatin A initiated after disease onset delays disease progression and increases survival in a mouse model of amyotrophic lateral sclerosis. Exp Neurol 2011; 231: 147–159. [DOI] [PubMed] [Google Scholar]
- 11Garbes L, Riessland M, Wirth B. Histone acetylation as a potential therapeutic target in motor neuron degenerative diseases. Curr Pharm Des 2013; 19: 5093–5104. [DOI] [PubMed] [Google Scholar]
- 12Janssen C, Schmalbach S, Boeselt S, Sarlette A, Dengler R, Petri S. Differential histone deacetylase mRNA expression patterns in amyotrophic lateral sclerosis. J Neuropathol Exp Neurol 2010; 69: 573–581. [DOI] [PubMed] [Google Scholar]
- 13Williams AH, Valdez G, Moresi V, Qi X, McAnally J, Elliott JL et al. MicroRNA-206 delays ALS progression and promotes regeneration of neuromuscular synapses in mice. Science 2009; 326: 1549–1554. [DOI] [PMC free article] [PubMed] [Google Scholar]
- 14Bruneteau G, Simonet T, Bauché S, Mandjee N, Malfatti E, Girard E et al. Muscle histone deacetylase 4 upregulation in amyotrophic lateral sclerosis: potential role in reinnervation ability and disease progression. Brain 2013; 136(Pt 8): 2359–2368. [DOI] [PubMed] [Google Scholar]
- 15d'Ydewalle C, Bogaert E, Van Den Bosch L. HDAC6 at the intersection of neuroprotection and neurodegeneration. Traffic 2012; 13: 771–779. [DOI] [PubMed] [Google Scholar]
- 16Fiesel FC, Schurr C, Weber SS, Kahle PJ. TDP-43 knockdown impairs neurite outgrowth dependent on its target histone deacetylase 6. Mol Neurodegener 2011; 6: 64. [DOI] [PMC free article] [PubMed] [Google Scholar]
- 17Taes I, Timmers M, Hersmus N, Bento-Abreu A, Van Den Bosch L, Van Damme P et al. Hdac6 deletion delays disease progression in the SOD1G93A mouse model of ALS. Hum Mol Genet 2013; 22: 1783–1790. [DOI] [PubMed] [Google Scholar]
- 18Gal J, Chen J, Barnett KR, Yang L, Brumley E, Zhu H. HDAC6 regulates mutant SOD1 aggregation through two SMIR motifs and tubulin acetylation. J Biol Chem 2013; 288: 15035–15045. [DOI] [PMC free article] [PubMed] [Google Scholar]
- 19Kim D, Nguyen MD, Dobbin MM, Fischer A, Sananbenesi F, Rodgers JT et al. SIRT1 deacetylase protects against neurodegeneration in models for Alzheimer's disease and amyotrophic lateral sclerosis. EMBO J 2007; 26: 3169–3179. [DOI] [PMC free article] [PubMed] [Google Scholar]
- 20Lee JC, Shin JH, Park BW, Kim GS, Kim JC, Kang KS et al. Region-specific changes in the immunoreactivity of SIRT1 expression in the central nervous system of SOD1(G93A) transgenic mice as an in vivo model of amyotrophic lateral sclerosis. Brain Res 2012; 1433: 20–28. [DOI] [PubMed] [Google Scholar]
- 21Körner S, Böselt S, Thau N, Rath KJ, Dengler R, Petri S. Differential sirtuin expression patterns in amyotrophic lateral sclerosis (ALS) postmortem tissue: neuroprotective or neurotoxic properties of sirtuins in ALS? Neurodegener Dis 2013; 11: 141–152. [DOI] [PubMed] [Google Scholar]
- 22Song W, Song Y, Kincaid B, Bossy B, Bossy-Wetzel E. Mutant SOD1G93A triggers mitochondrial fragmentation in spinal cord motor neurons: neuroprotection by SIRT3 and PGC-1α. Neurobiol Dis 2013; 51: 72–81. [DOI] [PMC free article] [PubMed] [Google Scholar]
- 23Donmez G, Outeiro TF. SIRT1 and SIRT2: emerging targets in neurodegeneration. EMBO Mol Med 2013; 5: 344–352. [DOI] [PMC free article] [PubMed] [Google Scholar]
- 24Imai S, Armstrong CM, Kaeberlein M, Guarente L. Transcriptional silencing and longevity protein Sir2 is an NAD-dependent histone deacetylase. Nature 2000; 403: 795–800. [DOI] [PubMed] [Google Scholar]
- 25Vaquero A, Scher M, Lee D, Erdjument-Bromage H, Tempst P, Reinberg D. Human SirT1 interacts with histone H1 and promotes formation of facultative heterochromatin. Mol Cell 2004; 16: 93–105. [DOI] [PubMed] [Google Scholar]
- 26Pucci B, Villanova L, Sansone L, Pellegrini L, Tafani M, Carpi A et al. Sirtuins: the molecular basis of beneficial effects of physical activity. Intern Emerg Med 2013; 8(Suppl 1): S23–S25. [DOI] [PubMed] [Google Scholar]
- 27Nakagawa T, Guarente L. Sirtuins at a glance. J Cell Sci 2011; 124(Pt 6): 833–838. [DOI] [PMC free article] [PubMed] [Google Scholar]
- 28Zhang F, Wang S, Gan L, Vosler PS, Gao Y, Zigmond MJ et al. Protective effects and mechanisms of sirtuins in the nervous system. Prog Neurobiol 2011; 95: 373–395. [DOI] [PMC free article] [PubMed] [Google Scholar]
- 29Song NY, Surh YJ. Janus-faced role of SIRT1 in tumorigenesis. Ann N Y Acad Sci 2012; 1271: 10–19. [DOI] [PMC free article] [PubMed] [Google Scholar]
- 30Li X. SIRT1 and energy metabolism. Acta Biochim Biophys Sin (Shanghai) 2013; 45: 51–60. [DOI] [PMC free article] [PubMed] [Google Scholar]
- 31Belden WJ, Dunlap JC. Aging well with a little wine and a good clock. Cell 2013; 153: 1421–1422. [DOI] [PMC free article] [PubMed] [Google Scholar]
- 32Donmez G. The neurobiology of sirtuins and their role in neurodegeneration. Trends Pharmacol Sci 2012; 33: 494–501. [DOI] [PubMed] [Google Scholar]
- 33Yang Y, Duan W, Li Y, Yan J, Yi W, Liang Z et al. New role of silent information regulator 1 in cerebral ischemia. Neurobiol Aging 2013; 34: 2879–2888. [DOI] [PubMed] [Google Scholar]
- 34Pasinetti GM, Bilski AE, Zhao W. Sirtuins as therapeutic targets of caprylic triglyceride in ALS therapy. Cell Res 2013; 23: 1073–1074. [DOI] [PMC free article] [PubMed] [Google Scholar]
- 35Crosio C, Valle C, Casciati A, Iaccarino C, Carrì MT. Astroglial inhibition of NF-κB does not ameliorate disease onset and progression in a mouse model for amyotrophic lateral sclerosis (ALS). PLoS One 2011; 6: e17187. [DOI] [PMC free article] [PubMed] [Google Scholar]
- 36Ripps ME, Huntley GW, Hof PR, Morrison JH, Gordon JW. Transgenic mice expressing an altered murine superoxide dismutase gene provide an animal model of amyotrophic lateral sclerosis. Proc Natl Acad Sci USA 1995; 92: 689–693. [DOI] [PMC free article] [PubMed] [Google Scholar]
- 37Pesaresi MG, Amori I, Giorgi C, Ferri A, Fiorenzo P, Gabanella F et al. Mitochondrial redox signalling by p66Shc mediates ALS-like disease through Rac1 inactivation. Hum Mol Genet 2011; 20: 4196–4208. [DOI] [PubMed] [Google Scholar]
- 38Encinas M, Iglesias M, Liu Y, Wang H, Muhaisen A, Ceña V et al. Sequential treatment of SH-SY5Y cells with retinoic acid and brain-derived neurotrophic factor gives rise to fully differentiated, neurotrophic factor-dependent, human neuron-like cells. J Neurochem 2000; 75: 991–1003. [DOI] [PubMed] [Google Scholar]
- 39Song KS, Scherer PE, Tang Z, Okamoto T, Li S, Chafel M et al. Expression of caveolin-3 in skeletal, cardiac, and smooth muscle cells. Caveolin-3 is a component of the sarcolemma and co-fractionates with dystrophin and dystrophin-associated glycoproteins. J Biol Chem 1996; 271: 15160–15165. [DOI] [PubMed] [Google Scholar]
- 40Tang Z, Scherer PE, Okamoto T, Song K, Chu C, Kohtz DS et al. Molecular cloning of caveolin-3, a novel member of the caveolin gene family expressed predominantly in muscle. J Biol Chem 1996; 271: 2255–2261. [DOI] [PubMed] [Google Scholar]
Associated Data
This section collects any data citations, data availability statements, or supplementary materials included in this article.


