

Abstract
Pancreatic ductal adenocarcinoma is one of the most aggressive malignancies, characterized by the local invasion into surrounding tissues and early metastasis to distant organs. Oncogenic mutations of the K-RAS gene occur in more than 90% of human pancreatic cancers. The goal of this study was to investigate the functional significance and downstream effectors of mutant K-RAS oncogene in the pancreatic cancer invasion and metastasis. We applied the homologous recombination technique to stably disrupt K-RAS oncogene in the human pancreatic cell line MiaPaCa-2, which carries the mutant K-RASG12C oncogene in both alleles. Using in vitro assays, we found that clones with disrupted mutant K-RAS gene exhibited low RAS activity, reduced growth rates, increased sensitivity to the apoptosis inducing agents, and suppressed motility and invasiveness. In vivo assays showed that clones with decreased RAS activity had reduced tumor formation ability in mouse xenograft model and increased survival rates in the mouse orthotopic pancreatic cancer model. We further examined molecular pathways downstream of mutant K-RAS and identified RhoA GTP activating protein 5, caveolin-1, and RAS-like small GTPase A (RalA) as key effector molecules, which control mutant K-RAS-dependent migration and invasion in MiaPaCa-2 cells. Our study provides rational for targeting RhoA and RalA GTPase signaling pathways for inhibition of pancreatic cancer metastasis.
Keywords: metastatic pancreatic cancer, mutant K-RAS knockdown, RalA GTPase, Rho GTPase activating protein 5, AKT, caveolin-1
Introduction
Pancreatic cancer is known as one of the most aggressive adult solid tumors. About 90% of pancreatic cancers begin in the exocrine pancreas, which forms the bulk of the gland, and secretes an enzyme-rich alkaline fluid into the duodenum via the pancreatic duct. In the recent years, significant efforts have been devoted to understanding the pathogenesis of this disease with the goal of improving its early detection and patient survival. Multiple genetic abnormalities have been identified in pancreatic cancer and grouped as a core set of a 12 cellular signaling pathways altered in the majority of the pancreatic tumors.1,2 The majority of pancreatic adenocarcinomas (more than 90%) harbor gain-of-function mutations in the K-RAS oncogene, which plays a major role in neoplastic transformation and cancer progression in the pancreas.3 Different experimental approaches have been utilized to evaluate the role of mutant K-RAS in initiation, progression and maintenance of pancreatic cancer. One successfully used strategy employed mutant-specific K-RAS small interfering RNAs (siRNAs) for transient or prolonged inhibition of mutant K-RAS oncogene transcription using retroviral RNAi, synthetic antisense, or short double-stranded RNA oligonucleotides.4–6 The inducible K-RAS knockdown system has been used in vivo in established mouse xenograft tumors.7 A number of studies have also been done to establish the changes in molecular signaling pathways caused by the introduction of mutant K-RAS expressing system into cells expressing wild-type K-RAS.8,9 These approaches allowed for evaluation of immediate consequences of the loss of expression of mutant K-RAS and long-term inhibitory effect for cell growth and apoptosis. Although mutant K-RAS itself presents an attractive therapeutic target, its direct inhibition in clinical studies has not been successful.10 Therefore, significant efforts have been put into identification and characterization of downstream effectors of oncogenic K-RAS suitable for future drug development. The best-characterized downstream RAS effectors are the serine/threonine kinases (Raf-1, A-Raf, and B-Raf) that activate the MEK1 and MEK2 dual-specificity kinases and then activate the ERK1 and ERK2 mitogen-activated protein kinases (MAPKs).11,12 Another well-characterized effector of K-RAS is a class I phosphoinositide 3-phosphate lipid kinases (PI3Ks) (specifically, the catalytic subunits p110 α, β, γ, δ)13,14 signaling through protein kinase B (PBK or AKT). Activated PI3 kinase facilitates the conversion of phosphatidylinositol 4,5-phospate (PIP2) to phosphatidylinositol 3,4,5-phosphate (PIP3). A third class of RAS effectors is a family of Ral (Ras-like) guanine exchange factors (GEFs), such as Ral guanine nucleotide dissociation stimulator (RalGDS). Ral GEFs serve as activators of the Ral small GTPases RAS-like small GTPase A (RalA) and RalB.15 Ral GEF pathway is functionally active in K-RAS mutant pancreatic, prostate, bladder, and other cancers and currently became the third best validated effector of oncogenic RAS.16
Cooperation of molecular alterations in signaling pathways makes it difficult to target the transformed cell population of the pancreas. We developed a cell model system with disrupted mutant K-RAS by introducing the homologous recombination vector into MiaPaCa-2 pancreatic cancer cells. This cell model was used to evaluate the consequences of mutant K-RAS inactivation on the ability of pancreatic cancer cells to migrate, invade, and metastasize. We identified and validated the important proteins drivers of cellular survival, migration, and metastasis such as Rho-GTPase activating proteins (Rho-GAPs), RalA signaling pathway, and caveolin-1. These sensitive effectors of mutant K-RAS activity coordinate invasive potential of pancreatic cells and present the valuable targets for the future drug development.
Materials and Methods
Materials
All cell culture reagents, restriction and DNA-modifying enzymes, LipofectAMINE-2000 reagent, and specific primers used in this study were purchased from Life Technologies, Inc. K-RAS activity kit was purchased from Millipore. The peroxisome proliferator-activated receptor gamma (PPARγ) ligand, 15-deoxy-Δ12,14-prostaglandin J2 (15d-PGJ2) was purchased from Cayman Chemical and dissolved in dimethyl sulfoxide (DMSO). The specific siRNAs were purchased from Santa Cruz Biotechnology, Inc. Apoalert® Annexin V kit was purchased from Clontech Laboratories, Inc., Takara Bio Company.
Cell lines
The MiaPaCa-2 (K-RASG12C, both alleles mutant) and BxPC-3 (wild-type K-RAS) cell lines were purchased from American Type Culture Collection and was maintained in the RPMI-1640 supplemented with 10% fetal bovine serum (FBS) and 1% penicillin/streptomycin, as well as 0.1% glucose. The mutant K-RAS oncogene in MiaPaCa-2 cells was disrupted through applied homologous recombination using the targeted vector pBKNT-D, generously provided by Senji Shirasawa and Takehiko Sasazuki (Research Institute, International Medical Center of Japan, Tokyo, Japan).17 The RAS sequence, inserted into the targeted pBKNT-D vector, was obtained from human lung carcinoma cell line Cala-1 carrying K-RasG12C mutation and was interrupted in exon 1 by a 4 kb fragment of the Escherichia coli neomycin resistance (neo) gene and the herpes simplex thymidine kinase (tk) gene. Cells were transfected with the pBKNT-D plasmid using Lipofectamin® reagent. Screening of clones for homologous recombination was performed as described by Shirasawa et al.17 The clones expressing the pBKNT-D vector were isolated using positive selection by growing in a media that contained G418 neomycin and negative selection by growing in a medium that contained ganciclovir.17 MiaPaCa-2 parental and three MiaPaCa-2 clonal cell lines that stably expressed the pBKNT-D vector (M-25, M27, M-29) were used for further experiments. The Mia-PaCa-2 clones were maintained in media supplemented with 350 µg/mL G418 neomycin at 37°C in humidified atmosphere of 5% CO2/95% air.
RNA isolation
Total RNA was extracted from Mia-PaCa-2 cells, and clones were plated for 48 hours after subculture using the Qiagen RNeasy Kit as per the manufacturer’s protocol. RNA samples were treated with DNase to remove residual DNA using Ambion® DNase treatment and removal kit (Ambion™ by Life Technologies, Inc., Cat.# AM1906) and evaluated for integrity of 18S and 28S rRNA by ethidium bromide staining of 1 µg of RNA resolved by electrophoresis on a 1.0% agarose/formaldehyde gel.
cDNA microarray
For cDNA microarray, samples preparation, experimental design, and analysis were performed as described previously.19–21 The cDNA chip had ~5,300 human genes, with more than 3,000 known genes and ~2,300 expressed sequence tags, as determined by UniGene. The cDNA sequences printed on the microarray were derived from cDNA clones produced by the IMAGE consortium. Hybridizations of cDNA samples of MiaPaCa-2 versus clones were performed in triplicate. Genes were considered to have altered expression levels when a mean 2-fold or greater change in their expression level and a P-value of 0.05 in a paired t-test were observed at least in one clone with disrupted mutant K-RAS. Genes that show at least a 2-fold change in expression in other clones with disrupted mutant K-RAS were also considered biologically important.
Quantitative real-time PCR
Total RNA was prepared as described above. The cDNA was made using Applied Biosystems High Capacity cDNA Reverse transcription kit (Part #4368814). Real-time PCR amplification was performed with an ABI PRISM 7700 SDS instrument (Applied Biosystems by Life Technologies Inc.), utilizing the universal thermal cycling conditions recommended by the Assay-on-Demand products protocol and by using Applied Biosystems High Capacity cDNA Reverse transcription kit (Part #4368814). Each 20 µL PCR reaction included 10 µL of TaqMan Universal PCR master mix, 4 µL of the resulting cDNA from the reverse transcription step, and 6 µL diluted primer and probe mixes ordered from Assay-on-Demand products (Applied Biosystems, by Life Technologies). No template controls were included in each plate to monitor potential PCR contamination. The expression of genes was tested in triplicate, and each reaction was run in duplicate. To determine the relative expression level of each gene, the comparative CT method was used. The CT value of the target gene was normalized by the endogenous reference (ΔCT = CT(target) − CT(GAPDH)) and compared with a calibrator (ΔΔCT = ΔCT(target) − ΔCT(calibrator)). The first of three MiaPaCa-2 replicates was designated as the calibrator sample in these experiments. The relative expression of each target gene was calculated via the equation 2−ΔΔCT.
For the analysis of K-RAS expression level, RNA was isolated from MiaPaca-2, M-27 and colon cell lines Caco-2 (wild type K-RAS) and HCT116 (K-RasG13D) at 48 h after subculture and converted into cDNA using High Capacity cDNA Reverse transcription kit (ABS, Part # 4368814). cDNA was amplified using K-RAS probe Hs00364284_g1. K-RAS probe Hs00364284_g1 recognizes the region outside of exon 2 (codon 12 location), particularly, exons 3–4 location. The results were presented as 2−ΔCT values, where ΔCT = CT(K−RAS) − CT(β2M) (β2-microglobulin (β2M) was used as the endogenous reference).
Growth curve
The MiaPaCa-2 cells were plated in six-well plates with a concentration of 0.1 × 10⁶ cells/well. The MiaPaCa-2 parental cells and clones were plated in triplicate. The cells were grown for 24, 48, 72, and 96 hours. The cells were harvested and counted using an automated Trypan blue dye exclusion method on a Beckman Coulter Vi-Cell™ Cell Viability analyzer (Beckman Coulter Inc.). Cell size analysis was done using cell measurements obtained from Beckman Coulter Vi-Cel™ Cell Viability analyzer.
RAS activity assay
The RAS activity assay was performed with a kit from Millipore, according to the manufacturer’s protocol. The MiaPaCa-2 parental cells and clones were seeded at 1.5 × 10⁶ cells/100 mm plate. After 48 hours, the cells were scraped from the plates after adding 0.5 mL 1 × Mg2+ lysis buffer (MLB). The cell lysates were prepared to have a concentration of 500 µg/µL. Each cell lysate sample was divided into two tubes. The tubes were incubated either with 2.5 µL of 100 × GTPγS or 2.5 µL of 100 × GDP for 30 minutes at 30°C. After that tubes were put on ice, 16 µL of 1 M MgCl2 and 10 µL of Raf-1 RBD agarose were added to each tube, and tubes were incubated at 4°C for 1 hour. The agarose beads were pelleted with centrifugation (1 minute, 14,000 × g, 4°C) and washed three times with MLB. The beads were resuspended in 60 µL of 2 × loading buffer with DTT (100 mM) and loaded onto polyacrylamide gel. A total of 30 µg of whole-cell lysate was additionally separated by sodium dodecyl sulfate polyacrylamide gel electrophoresis (SDS-PAGE) for the analysis of total RAS expression. The primary antibody used was Millipore anti-RAS (Clone RAS10, Cat. 05-516) (1:2,000 dilution). The secondary antibody used was Santa Cruz Biotechnology (sc-2005) (1:3,000 dilution) anti-mouse IgG.
Western analysis
MiaPaCa-2 parental and clonal cells were collected 48 and 96 hours after subculture by lysing on ice in radioimmunoprecipitation assay buffer (phosphate buffered saline [PBS], 1% NP-40, 0.5% sodium deoxycholate, 0.1% SDS, 30 µg/mL aprotinin, 100 mM sodium orthovanidate, and a 10 mg/mL phenylmethylsulfonyl fluoride). Samples were kept on ice for 30 minutes, followed by centrifugation at 13,000 × g for 10 minutes. Supernatants were collected, and protein concentration was determined using the Bio-Rad DC protein assay. Fifty micrograms of cell lysate was loaded per lane and run on Any-kd™ precast gels (Criterion TGX Stain-free, Cat.#5678123; Bio-Rad Laboratories, Inc.) using Bio-Rad Criterion Cell gel apparatus (Cat.#165-6001; Bio-Rad Laboratories, Inc.). The proteins were transferred electrophoretically to Hybon-C nitrocellulose membrane (Amersham) using Bio-Rad Trans-Blot® SD semidry electrophoretic transfer cell (Bio-Rad Laboratories, Inc.). Membranes were blocked in BlottoA (5% w/v nonfat dry milk, 0.1% Tween 20, and tris-buffered saline (TBS) consisting of 10 mM Tris–HCl, pH 8.0, 150 mM NaCl) for 1 hour at room temperature. The primary and secondary antibodies used in this study and blotting conditions are presented in Supplementary Table 1. The primary antibodies were incubated with the blots overnight at 4°C. The blots were washed in TBS/0.05% Tween-20. Proteins were detected with enhanced chemiluminescence detection reagent (Thermo Fisher Scientific Super Signal® West Pico Chemiluminescent Substrate, Cat #340077). All western blots were repeated at least two times. Image processing program, ImageJ (NIH) was used for evaluation of western blot bands intensity where specified (Image J, http://rsb.info.nih.gov/ij/docs/menus/analyze.html#gels).
Apoptosis assay by Annexin V
MiaPaCa-2 parental cells and clones were seeded in 6-well plates at 0.1 × 10⁶ cells/well. Twenty-four hours after subculture cells were treated with DMSO at the concentration of 0.05 v/v% or 0.5 v/v%. The MiaPaCa-2 parental cells and clones were treated for 48 hours and then were harvested and processed for the flow cytometry analysis according to the manufacturer’s protocol (Clontech Laboratories, Inc.)
Membrane isolation
Two 100 mm plates per cell type were plated with 1 × 10⁶ cells per plate. The cells were collected at 48 hours after subculture. The membrane extractions were done using MEM_PER™ Plus membrane Protein extraction Kit (Thermo Fisher Scientific, Cat.#89842) as per the manufacturer’s protocol.
Cell migration and invasion assay
MiaPaca parental cells and K-RAS-disrupted clones were seeded in 24-well Boyden chambers with either control plastic inserts or Matrigel-coated inserts with 8.0 µm pore size (BD Biosciences Discovery Labware). In the lower chamber of each well, 0.5 mL media with FBS were added as a chemoattractant. Cells suspension was prepared at a concentration of 0.5 × 10⁶ cells/mL in serum-free medium. One hundred microliters of the cell suspensions were plated into inserts. Each cell line was plated in triplicate for each condition (control or Matrigel coated). The cells were permitted to migrate for 48 hours. The media were discarded, and noninvading cells inside inserts were removed using a swab. Wells were then washed, fixed in 100% methanol for 2 minutes, and stained with 1% toluidine blue in 1% borax for 2 minutes. The stained inserts were washed twice in distilled water and air dried. For the analysis presented in Figure 3, the stained membranes were cut from the insert and placed on a microscope slide with a drop of immersion oil. With a 40 × magnification, 10 pictures of each membrane were taken with a microscope. The number of migrated cells from each of the three wells for a given cell line were averaged, and the total average plus standard deviation were calculated. The percent invasion was calculated as follows:
Figure 3.
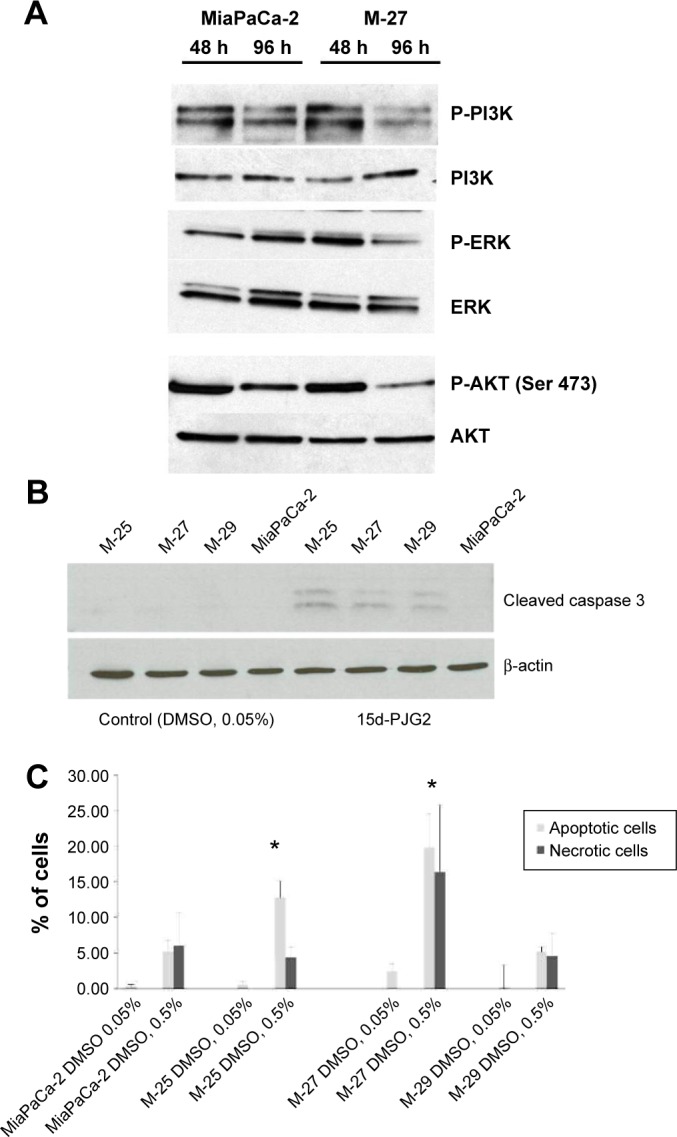
Mutant K-RAS inactivation results in higher cells susceptibility to agents-inducing apoptosis. (A) Western blot analysis of the ERK and AKT protein levels in MiaPaCa-2 and M-27 clone at 48 and 96 hours after subculture. (B) Western blot analysis for cleaved caspase-3 expression in MiaPaCa-2 parental cells and clones with disrupted mutant K-RAS. Cells were treated with either DMSO (vehicle control) or 15d-PGJ2 at the concentration of 1 µM in 0.05 v/v% DMSO for 48 hours and processed for Western blot analysis as described in “Materials and methods” section. Figure is representative of three independent experiments. (C) DMSO-induced apoptosis and necrosis in MiaPaCa-2 clones with disrupted mutant K-RAS. Cell lines were treated with DMSO (0.05 or 0.5 v/v%) for 48 hours, harvested, and stained with Annexin V-FITC and propidium iodide according to the manufacturer’s instructions. Ten thousand events were collected and analyzed for each sample. The numbers represent the percentage of the total cell population. *P < 0.05 by t-test. The figure is representative of two independent experiments. Each experiment was done in triplicates.
For other invasion experiments (substrate specificity, siRNAs), the stained inserts were dissolved in 200 µL 0.1 M citric acid in 96-well plate while shaking for 5 minutes on a high speed plate shaker. The supernatant was then transferred to a new well and read at 560 nm on an EL800 Universal Microplate Reader (Bio-Tek Instruments, Inc.). Cell invasion assays to test substrate specificity were performed using BIOCOAT® control cell culture inserts (BD Biosciences Discovery Labware). Inserts were coated with 2 µg/well of laminin or collagen IV (Sigma-Aldrich, Life Science Research). All migration and invasion assays were carried out in sextuplet.
siRNAs transfections experiments
MiaPaCa-2 cells were seeded in Opti-MEM media supplemented with 10% FBS at a concentration of 0.3 × 10⁶ cells/mL. Twenty-four hours after subculture, the cells were transfected with either caveolin-1 (CAV-1), siRNA (Cat.# sc-29241) or RalA siRNA (sc-41842), and control siRNA (sc-37007) (Santa Cruz Biotechnology, Inc.) at the concentration of 75 nM using DramaFECT Duo transfection reagent (Dharmacon™; GE Healthcare, Inc.), according to the manufacture’s protocol. Twenty-four hours after transfection, the cells were trypsinized, counted, and processed for migration and invasion assays as described earlier. All siRNA transfections were done in triplicates, following by migration and invasion assays in sextuplet for each siRNA and experiments were repeated twice. Statistical analysis was done in each experiment independently.
F-actin visualization
MiaPaCa-2 cells and M-27 clone were seeded on chamber slides (Lab-Tek; Nalge Nunc International) at concentration 1 × 10⁵ cells/chamber. Cells were grown for 96 hours after subculture before staining. Immunofluorescence staining for F-actin was carried out using ActinGreen™ 488 ReadyProbes™ reagent according to the manufacturer’s instructions. Briefly, the cells were washed with PBS, fixed in fixative solution (4% formaldehyde in PBS) for 10 minutes at room temperature, permeabilized with permeabilization buffer (0.5% Triton X-100 in PBS) for 5 minutes at room temperature, washed twice with PBS, and stained with ActinGreen 4888 ReadyProbes reagent for 30 minutes. Cells were photographed with Nikon E800 confocal microscope with epifluorescence and DIC capabilities at 60× magnification.
SCID mouse models of tumorigenesis and metastasis formation
Subcutaneous and orthotopic injections and subsequent analyses were conducted on 6–7-weeks old severe combined immunodeficient (SCID) mice (CB-17/IcrACCscid) obtained from Taconic Inc. The SCID mouse colony is housed at animal facility in the Arizona Cancer Center. The facility is AAALAC accredited and holds an Animal Welfare Assurance # with the Public Health (File#A-3248-01). Mouse colonies were maintained under microisolation and were handled and manipulated only in laminar flow hoods. All procedures involving animals were conducted according to the University of Arizona Animal Care and Use Committee policies.
Subcutaneous model
For the tumorigenesis study, the MiaPaCa-2 parental cell line and the three mutant K-RAS disrupted clonally selected cell lines were injected into flank area of four SCID mice subcutaneously (s.c.) at a concentration of 10 × 106 cells. The body weight of the mice and the tumor size were recorded twice a week. Tumor volume was determined in millimeters cubed (mm3) by using the formula (a2 × b/2), where a is the smaller of the measurements to estimate size. The maximum tumor volume permitted was 2,000 mm3.
Orthotopic model
For animal survival study, MiaPaCa-2 parental and M-27 clonal cells at the concentration of 3 × 10⁶ cells in 50 µL Matrigel (Becton Dickenson) were injected into the tail of the pancreas of anesthetized mice by using a 30-gauge needle. Animals were observed twice weekly for adverse signs associated with tumor growth (eg, >20% body weight loss, immobility, loss of grooming), at which time mice were euthanized. Metastatic colonization and tumors formed were counted postmortem.
Statistics
Statistical analysis of cell culture experimental data was performed using paired t-test or analysis of variance (ANOVA) (Microsoft Excel, Microsoft Corp.). Statistical analyses comparing rates of tumor formation between the groups were determined using two-way ANOVA followed by Bonferroni tests. The Kaplan–Meier curve for survival was estimated by groups. The long-rank test was employed to test the difference in the survival curves. No adjustment for multiple comparisons was performed. Fisher’s exact test was employed to test the difference in incidence of metastases between groups.
Results
Characterization of MiaPaCa-2 pancreatic cancer cells with disrupted mutant K-RAS oncogene
RAS activity
The MiaPaCa-2 pancreatic cancer cells used in this study have characteristics found in more than 90% of human pancreatic adenocarcinomas. MiaPaCa-2 cells exhibit mutation in the K-RAS oncogene (both alleles have codon 12 mutation GGT → GAT). We confirmed the presence of mutant K-RAS in MiaPaCa-2 cells by RFLP analysis (Supplementary Fig. 1). Mia-PaCa-2 cells also have mutations in the p53 tumor suppressor gene and a homozygous deletion of p16ink4a tumor suppressor.22 The MiaPaCa-2 parental cells and three clones selected as described in “Material and methods” section were further evaluated using RAS activation assay, K-RAS mutation analysis, and Western blotting. The levels of active RAS expressed in the MiaPaCa-2 clones at 48 hours after subculture were evaluated by RAS activation assay (Fig. 1A, upper panel). Insertion of the pBKNT-D vector resulted in a variable disruption of K-RAS activity in the selected clones based on the detected level of active GTP-bound form of RAS. Clone M-27 had the lowest level of active RAS. The total RAS protein level in M-25 and M-29 clones was slightly higher (1.36 and 1.35 times, respectively) than in MiaPaCa-2 cells and M-27 clone, as was quantified using ImageJ software (Fig. 1A, lower panel). This observation indicates the clonal variability as the result of random integration of the targeted RAS sequence into the cells genome. The Western blot analysis for K-RAS protein level, using antibody specific for K-RAS4B isoform, showed the significantly lower level of K-RAS expression in M-27 clone compared to MiaPaca-2 cells at 48 hours and 96 hours after subculture (6-fold and 2-fold decrease, respectively) (Fig. 1B). Using mutation detection assay, we further evaluated the status of mutant K-RAS in M-27 clone. Supplementary Table 2 demonstrates the results of quantitative analysis of the status of K-RASG12C mutation in colon cell lines, Caco-2 and HCT116, and pancreatic cell lines, MiaPaca-2 and M-27 clone. In MiaPaca-2 cells both K-RAS alleles carry K-RASG12C mutation (100% of K-RAS mutation). Because of insertion of the targeted vector pBKNT-D containing K-RASG12C sequence,17 the accurate detection of the percent of K-RAS mutation in M-27 clone was not possible (Supplementary Table 2). Therefore, we performed quantitative K-RAS evaluation in MaiPaCa-2, M-27, Caco-2, and HCT116 colon cell lines by RT-PCR. This analysis showed over 2-fold decrease in K-RAS transcript level in M-27 clone compared to MiPaCa-2 parental cells and Caco-2 and HCT116 colon cell lines (Table 1).
Figure 1.

Conformation of mutant K-RAS oncogene disruption after homologous recombination in MiaPaCa-2 pancreatic cell line. (A) Left panel. Expression levels of active RAS-GTP were detected by RAF affinity precipitation. Right panel. Total level of RAS protein in RAS activity assay input samples. (B) Level of K-RAS protein in MiaPaCa-2 cells and M-27 clone at 48 hours and 96 hours after subculture. β-Actin was used as loading control. Figure is representative of three independent experiments. Densitometric analysis was performed as described in “Materials and methods” section. In A, Clone/MiaPaCa-2 bands intensity ratios are presented. In 1B, The K-RAS band intensity after 10 minutes film exposure/β-actin ratios were calculated.
Table 1.
K-RAS gene transcript levels in MiaPaca-2 pancreatic cell line and M-27 clone with disrupted mutant K-RAS gene. Caco-2 and HCT116 colon cancer cell lines were used as reference. Quantitative RT PCR assessment was done 48 h after subculture.
| CELL LINE, cDNA TEMPLATE | 2−ΔCΤ × 10−3 |
|---|---|
| Caco-2 | 4.54 ± 0.78 |
| HCT116 | 3.96 ± 0.85 |
| MiaPaCa-2 | 3.83 ± 0.001 |
| M-27 | 1.55 ± 0.23* |
Note:
P = 0.0014 (MiaPaCa-2 vs M-27).
Effect of K-RAS disruption on cell growth and cell size
A statistically significant decrease in growth rates was observed in all selected clones with decreased RAS activity compared to MiaPaCa-2 cells (Fig. 2A). Additionally, the difference in growth rates among clones was noted, that is, M-27 clone grew slower than the M-25 and M-29 clones. Western blot analysis of proteins that control cell growth and proliferation showed that clone M-27 had the lowest expression levels of proliferation-specific nuclear antigen (PCNA) protein, which is involved in the control of eukaryotic DNA replication and c-MYC oncogene, controlling variety of cellular functions from transcription to metabolism (Fig. 2B). Analysis of cell parameters revealed that M-27 clone had the significantly smaller cells size compared to MiaPaCa-2 cells and the other two selected clones: M-25 and M-27 (Fig. 2C and Supplementary Fig. 2). This observation is consistent with the morphological alterations reported in HCT116 colon cancer cells with disrupted mutant K-RAS allele and is associated with the lower c-MYC expression (Fig. 2D).17
Figure 2.

Growth properties of MiaPaCa-2 and clones with disrupted mutant K-RAS oncogene. (A) Growth curve of MiaPaCa-2 cells and clones, *P = 0.032, **P ≤ 0.003 by t-test. (B) Western blot of PCNA and c-MYC in MiaPaCa-2 and clones. (C). Cell size analysis in MiaPaCa-2 and clones 96 hours after subculture *P ≤ 0.002 by t-test. (D) Levels of c-MYC protein in MiaPaCa-2 cells and M-27 clone at 48 and 96 hours after subculture. Figure is representative of three independent experiments. β-Actin was used as loading control.
Apoptosis
Suppression of apoptosis is one of the important and well-documented consequences of mutant K-RAS expression in cancer.23 It has been known that activated K-RAS can inhibit apoptotic signaling cascade through its effector PI3K. PI3K is in turn activates AKT and leads to suppression of apoptosis via several mechanisms, such as inhibition of caspases activation and inactivation of proapototic Bcl-2 family proteins. Analysis of downstream transducers of activated K-RAS in MiaPaCa-2 showed that expression of phosphorylated PI3, ERK, and AKT kinases in M-27 clone was lower at 96 hours after subculture (Fig. 3A). This indicates that inactivation of RAS in M-27 clone altered multiple cellular processes, including apoptosis signaling pathway. Different natural and synthetic compounds can induce the cell death through apoptosis. We have tested the effect of PPARγ ligand, 15d-PGJ2, on apoptosis induction in MiaPaCa-2 clones with disrupted mutant K-RAS. 15d-PGJ2 is a natural derivative of prostaglandin D2, a member of the cyclopentenone family, and has been reported previously to inhibit the pancreatic cell growth and invasiveness and induce apoptosis through activation of caspace-8, 9 and 3.24,25 We found that disruption of mutant K-RAS increased the cells sensitivity to 15d-PGJ2 treatment, such as we observed the induction of cleaved caspase 3 expression in MiaPaCa-2 clones, but not in MiaPaCa-2 parental cells upon treatment with 15d-PGJ2 at the concentration of 1 µM (Fig. 3B). As has been previously reported, the optimal concentration of 15d-PGJ2 necessary for the induction of apoptosis in MiaPaCa-2 parental cells is 35 µM.25
We also observed the increased number of apoptotic and necrotic cells in clones M-25 and M-27 when DMSO was added to the cultured media at the concentration of 0.5 v/v% (Fig. 3C).
Migration and invasion
We further evaluated the ability of MiaPaCa-2 clones to migrate and digest extracellular matrix proteins using cell migration and Matrigel invasion assay. MiaPaCa-2 parental cell line with the activated mutant K-RAS had the greatest ability to migrate and invade in this model. All clones exhibited the significant decrease in their ability to migrate and invade through Matrigel (P < 0.05 by ANOVA) with clone M-27 being the least motile (P < 0.05 by t-test) compared to other clones (Fig. 4A). Clones M-25 and M-27 were less invasive (P < 0.02, by t-test) compared to M-29 clone (Fig. 4B). The analysis of percent of invaded versus migrated cells for each cell line showed 21.24% for Miapca-2 cells, 1.64% for M-25 clone, 1.50% for M-27 clone, and 8.7% for M-29 clone. Matrigel is composed of laminin, collagen IV, heparin sulfate proteoglycans, and nidogen/enactin. Analysis of invasive ability of MiaPaCa-2 cells through different substrates showed that collagen IV is the preferable extracellular matrix for all clones (Supplementary Fig. 3), although M-27 continued to invade slower compared to other cell lines (P < 0.03, by t-test). There was no difference in invasive ability through laminin among different cell lines.
Figure 4.
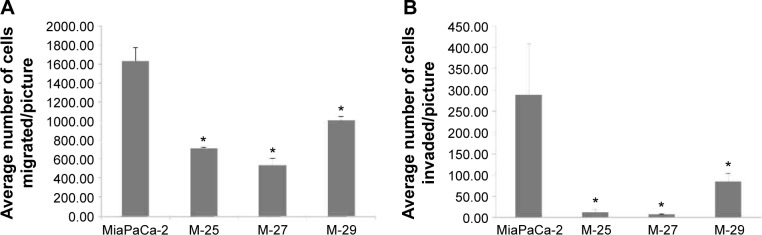
Interaction of MiaPaCa-2 cells and clones with basement membrane in vitro by Matrigel invasion assay. (A) Ability of cells to migrate through uncoated (control) inserts. (B) Invasion of cells through Matrigel-coated inserts. *P < 0.001 by ANOVA.
SCID mouse analysis
We further tested the ability of MiaPaCa-2 to form xenograft and orthotopic tumors in SCID mice. In xenograft study, all clones showed the significant delay in tumor growth compared to MiaPaCa-2 parental cell line (Fig. 5A and Table 2). In particular, the M-27 clone had the increased latency of tumor development (no palpable tumors 62 days postinjections when the experiment was terminated). Following this study, we tested the ability of M-27 clone to form metastasis using orthotopic mouse model. After the injection of MiaPaCa-2 parental cells and M-27 clone, embedded in Matrigel, into the tail of the pancreas, SCID mice were monitored weekly, sacrificed as they become morbid, and analyzed for the presence and location of metastasis. The duration of this experiment was 57 days. The Kaplan–Meier survival curves showed the statistically significant increase in survival rates of animals injected with M-27 clone (average survival time 48 days MiaPaCa-2-injected animals versus 53 days for M-27 clone-injected animals, Fig. 5B, P = 0.0485). All MiaPaCa-2 injected animals developed metastasis located in diaphragm, kidney, spleen, liver, and mesentery. In particular, five animals developed multiple metastasis in the mesentery wall (Supplementary Table 3). As for M-27-injected animals, three out of eight animals did not develop visible metastasis, and the rest of the mice did not have metastases in mesentery, kidney, and abdominal wall (Supplementary Table 3). Statistical analysis of the metastases incidence between two groups showed the statistically significant decrease in the incidence of mesentery metastases (P = 0.0294) in mice with M-27 orthotopic tumors (Table 3).
Figure 5.

Analysis of tumorigenicity of MiaPaCa-2 cells and clones in vivo. (A) Growth rates of subcutaneous tumors formed by MiaPaCa-2 cells and clones injected into four SCID mice. *P-values are presented in Table 2 by two-way ANOVA followed by Bonferroni test. (B) Kaplain–Meier survival curve of animals injected orthotopically into pancreas with MiaPaCa-2 (n = 9 mice) and M-27 (n = 8 mice). P = 0.0485 by long-rank test.
Table 2.
The means, standard error of slope, and P-values between cell lines in SCID mice xenografts.
| CELL LINES | NUMBER OF ANIMALS | MEAN ± SE | P-VALUE MiaPaCa-2 VS CLONES |
|---|---|---|---|
| MiaPaCa-2 | 4 | 0.264 ± 0.009 | |
| M-25 | 4 | 0.076 ± 0.068 | 0.0231 |
| M-27 | 4 | 0.000 ± 0.000 | 0.0024 |
| M-29 | 4 | 0.089 ± 0.049 | 0.0338 |
Table 3.
The statistical significance of difference in the incidence of metastases between the groups.
| METASTASIS LOCATION | MiaPaCa-2 (n = 9) | M-27 (n = 8) | P-VALUE |
|---|---|---|---|
| Liver | 55.56% | 25.00% | 0.3348 |
| Diaphragm | 33.33% | 12.20% | 0.5756 |
| Mesentery | 55.56% | 0.00% | 0.0294 |
| Kidney | 22.22% | 0.00% | 0.4706 |
| Spleen | 55.56% | 37.50% | 0.6372 |
| Abdominal wall | 12.15% | 0.00% | 0.4606 |
Molecular profiling of the MiaPaCa-2
The genetic and functional assays described earlier allowed us to conclude that inactivation of mutant K-RAS allele in M-27 clone induces in vitro and in vivo phenotypes indicative of reversal of malignant transformation. In order to characterize the transcriptional response of M-27 clone to disruption of mutant K-RAS, we performed in-house cDNA microarray analysis (UACC Genomic Shared Resource). Genes with two-fold and greater changes in expression between Mia-PaCa-2 and M-27 cells and a P-value of 0.5 have been identified and compared with the genes altered in other clones with disrupted mutant K-RAS activity. The six most altered genes common in all three clones are presented in Table 4. The most upregulated gene identified in MiaPaCa-2 was RhoGAP5, which encodes for Rho GTPase activating protein 5; the most significantly suppressed gene was found to be CAV-1 (real-time PCR validation in Fig. 6). These genes are known to be involved in K-RAS signaling, cells migration, and invasion pathways.
Table 4.
List of genes with significantly altered expression based on cDNA microarray result analysis.
| GENE NAME | ACCESSION NUMBER | FOLD CHANGE VERSUS MiaPaCa-2 CELLS, MEAN ± SD | ||
|---|---|---|---|---|
| M-25 | M-27 | M-29 | ||
| Caveolin-1 | AA487560 | 0.27 ± 0.07 | 0.28 ± 0.06* | 0.27 ± 0.09 |
| Collagen, type I, alpha 2 | AA490172 | 0.36 ± 0.05 | 0.44 ± 0.1 5 * | 0.27 ± 0.13 |
| Guanine nucleotide binding protein (G protein) alpha 12 | H79130 | 1.69 ± 0.5 | 3.46 ± 0.3* | 2.03 ± 0.7 |
| Plasminogen activator, urokinase receptor | AA455222 | 6.32 ± 0.5 | 6.44 ± 0.93* | 5.5 ± 2.03 |
| Protease, serine, 23 | R76394 | 4.01 ± 1.4 | 7. 2 ± 0.97* | 4.77 ± 4.8 |
| Rho GtPase activating protein 5 | N47967 | 6.35 ± 3.4 | 19.57 ± 6.64* | 7.6 1 ± 6.68 |
Note:
P < 0.05.
Figure 6.
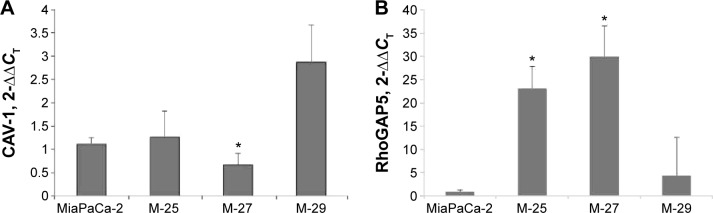
Validation of altered expression of RhoGTPase 5 (A) and caveolin-1 (B) by real-time PC.*P < 0.05 by t-test.
Functional validation of mutant K-RAS induced alterations in MiaPaCa cell culture model
We further evaluated the downstream effectors of RAS signaling in M-27 clone, which are regulated by CAV-1 and RhoGAP5.
Caveolin-1
We identified and confirmed decrease in CAV-1 expression both at the mRNA (Fig. 6A) and protein (Fig. 7A) levels. We further performed membrane and cytosolic fractionations to determine CAV-1 distribution within cells. CAV-1 is mainly localized in the membrane fraction, and its phosphorylated form is found in the cytosol fraction (Fig. 7B). Expression of CAV-1 and its phosphorylated form was reduced in both the cytosol and in membrane fractions, of M-27 clone by approximately 2-fold (as measured by ImageJ software) compared to MiaPaCa-2 cells, which is consistent with observed downregulation of CAV-1 transcript (Fig. 7A). To demonstrate the direct role of CAV-1 in pancreatic cell migration, we transiently transfected siRNA for CAV-1 into MiaPaCa-2 cells and measured the ability of these cells to migrate and invade. The knockdown of CAV-1 was confirmed by Western blot analysis in cells transfected with siRNA specific to CAV-1 (Fig. 7C, upper panel). Cells were depleted of CAV-1 protein and cell migration and cell invasion were significantly suppressed (P < 0.01, by t-test) (Fig. 7C, lower panel).
Figure 7.

Caveolin-1 downregulation in pancreatic cells with disrupted mutant K-ras signaling causes decrease in pancreatic cells migration and invasion. (A) Western blot analysis of CaV-1 protein in MiaPaCa-2 and M-27 clone. Figure is representative of two independent experiments. β-actin was used as loading control. (B) distribution of CAV-1 and phospho-CAV-1 in membrane and cytosol fraction of MiaPaCa-2 and M-27 cell lines. Figure is representative of two independent experiments. Flotillin was used as loading control for membrane fraction. (D) Migration and invasion of MiaPaCa-2 cells after knockdown of CaV-1 are inhibited. Upper panel is the western blot analysis of CAV-1 protein level in MiaPaCa-2 cells 24 hours after transfection with control siRNA or CAV-1 siRNA. Lower panel is the analysis of MiaPaCa-2 cell migration through uncoated inserts and invasion through Matrigel 48 hours after seeding. *P < 0.01 by t-test. Figure is representative of two independent experiments. In each experiment, control and CAV-1 siRNA transfections were done in triplicates following by migration and invasion assays in sextuplet.
RhoGAP 5
Another transcriptional target identified in M-27 cells was RhoGAP 5 gene, which encodes for Rho GTPase activating protein 5 (alternative names Rho-type GTPase-activating protein 5 or p190-B http://www.uniprot.org/uniprot/Q13017). RhoA GTP activating protein 5 (RhoGAP5) is the member of Rho GTPase-activating proteins (RhoGAPs). The RhoGAPs negatively regulate activity of Rho GTPases via increase their intrinsic GTPase activity and return to inactive state.26 The M-27 clone had the most significant (~35-fold) increase in RhoGAP 5 transcript level (Fig. 6B). One known Rho-GTPase regulated pathway is an actin filament organization, promoting filamentous (F)-actin formation through formins.27 We assessed the status of F-actin in MiaPaCa-2 and M-27 cells using high-affinity F-actin probe, which is based on high specificity and affinity of phalloidin binding to polymerized form of actin. As shown in Figure 8, F-actin is present mostly in MiaPaCa-2 cells, not in M-27 clone.
Figure 8.
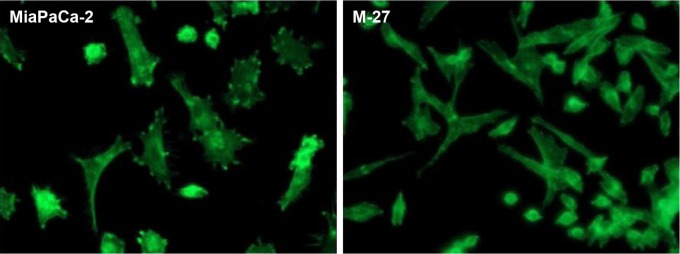
Representative immunofluorescence images of F-actin staining in MiaPaCa-2 and M-27 cells at 96 hours after subculture. Samples were collected and processed as described in “Materials and methods” section.
RalA GTPase
Another RAS-controlled pathway that can diverge to F-actin assembly is the RalA GTPase signaling pathway.28 RalA and RalB are members of the RAS family of small G proteins that are activated downstream of Ras via RalGEFs. Both RalA and RalB share approximately 80% homology at the amino acid level, but they have distinct roles in normal cells and during tumorigenesis.29 We found a twofold decrease in the level of RalA protein in M-27 clone compared to MiaPaCa-2 cells. In contrast to RalA, the level of RalB protein in M27 cells was similar to the one observed in MiaPaCa-2 cells (Fig. 9A). The level of Ral binding protein 1 (RalBP1) downstream of RalB did not change (Fig. 9A). Using siRNA for RalA, we found that RalA knockdown (Fig. 9B, upper panel) does not affect MiaPaCa-2 cell migration but significantly inhibits cell invasion (Fig. 9B, lower panel). This observation is consistent with finding reported in human bladder cancer cells.29 One last observation we would like to report is the significant suppression of MET/hepatocyte growth-factor (HGF) receptor tyrosine kinase (MET RTK) in M-27 clone compared to MiaPaCa-2 cells, while the level of CD44 protein adaptor was similar in both cell lines (Supplementary Fig. 4). Although RAS usually acts downstream of RTKs, RAS disruption in our system may indirectly influence MET production through adapter proteins such as growth-factor-receptor-bound protein 2 (GRB2) and GEF Son of Sevenless (Sos).
Figure 9.

RalA inhibition suppresses cell invasion in MiaPaCa-2 pancreatic cells. (A) RalA and RalB expression levels in MiaPaCa-2 and M-27 cells. (B) invasion of MiaPaCa-2 cells but not migration was inhibited after knockdown of RalA. Upper panel is the western blot analysis of RalA protein level in MiaPaCa-2 cells 24 hours after transfection with control siRNA or RalA siRNA. Lower panel is the analysis of MiaPaCa-2 cell migration through uncoated inserts and invasion through Matrigel 48 hours after seeding. *P < 0.001 by t-test. Figure is representative of two independent experiments. In each experiment, control and RalA sirna transfections were done in triplicates following by migration and invasion assays in sextuplet.
Discussion
There are numerous attempts underway to target different molecular pathways in pancreatic cancer with the goal to combat this disease. Unfortunately, the standard treatments for advance disease are mostly ineffective.30 K-RAS is the membrane-associated guanine nucleotide binding proteins of ~21 kDa that acts as a molecular switch for signal cascades that modulate many aspects of cell behavior, including proliferation, differentiation, motility, and death.31 Due to alternative exon 4 utilization of K-RAS gene, there are two splice variants, KRAS4A and KRAS4B, expressed in eukaryotic species, with K-RAS4B isoform being the most prevalent in human cells. Constitutive activation of K-RAS by substitution of amino acid residues at various positions is frequently found in human invasive cancers.32 Activated RAS triggers uncontrolled proliferation and morphological alteration and contributes to the malignant phenotype of transformed cells via an increased migration and invasion.33–35
Activating K-RAS gene mutations are inevitable in pancreatic cancer and found mostly in codon 12 of K-RAS gene.22,36,37 Although mutant K-RAS protein presents an attractive target for diagnostics and treatment of pancreatic cancer and successful experimental approaches to target RAS and RAS effectors, such as RAF, RalA, RalB, through siRNA interference have been reported,5,38 clinical attempts to directly suppress K-RAS activity have not succeeded.10 Pancreatic adenocarcinoma is highly heterogeneous disease with numerous molecular subtypes; therefore, it is imperative to understand the molecular basis of its heretogeneity and to identify common and relevant therapeutic targets.
The novelty of current research is two-fold: first, we attempted to mimic pancreatic tumor variability by using homologous recombination approach to disrupt mutant K-RAS activity. We identified and characterized three Mia-PaCa-2 clonally selected cell lines with the variable mutant K-RAS activity. Second, we focused on identification of the drugable downstream K-RAS effectors controlling pancreatic tumors invasion and metastasis.
We developed clonally selected pancreatic cell lines, which express homologous recombination vector targeting K-RAS oncogene. Te homologous recombination-based gene targeting technology requires homologous recombination efficiency of the cell line and usually results in a high proportion of nontargeted random integration. This is due to the significantly higher genomic insertion efficiency compared to homologous recombination efficiency.39 Following the positive/negative selection approach we screened 35 clonally selected recombinants and identified clone M-27 out of 35 screened clonally selected recombinants as the best targeted clone. We used clone M-27 alone with two other clones, M-25 and M-29, which exhibited the variable degree of suppression of mutant K-RAS activity, for further evaluation.
We found that the PI3K/AKT pathway was the main RAS effector that transduces RAS signaling in MiaPaCa-2 cells and regulates apoptosis, migration, and invasion. MiaPaCa-2 clones with low mutant K-RAS activity showed the higher sensitivity to apoptosis-inducing agent, 15-deoxy-[delta]12,14-prostaglandin J2 (15d-PGJ2). This finding confirms that AKT inhibitors, which are currently under active investigation as single agents or their combinations with apoptosis-inducing agents, is a promising approach for restriction of pancreatic cancer progression.40
We showed that MiaPaCa-2 clone phenotypes depend on their level of RAS activity. Clone M-29 is most similar to the MiaPaCa-2 parental cells in cell growth and size characteristics and migration and invasion in vitro, whereas M-27 clone, which expressed the lowest level of activated RAS, had the lowest number of cells that were capable of migration and invasion through Matrigel.
We tested the consequences of mutant K-RAS oncogene disruption in vivo using two mouse pancreatic cancer models: xenograft model was used to evaluate tumorigenic potential of MiaPaca-2 clones, and orthotopic model was utilized to evaluate the metastatic potential of M-27 clone. Clones M-25 and M-29 developed xenograft tumors but had an approximately 4-fold decrease in tumor volume compared to MiaPaCa-2 cells. Te M-27 clone did not develop xenograft tumors within 62 days of experiment duration. When MiaPaca-2 and M-27 cells were injected orthotopically into the pancreas, M-27 clone formed tumors but developed significantly less mesentery metastases. Te Kaplan–Meier curve showed an increase in survival rates of animals bearing tumors formed by M-27 clone. Tumor growth and metastatic invasion in orthotopic model are more complex compared to xenograft model, as it involves contributions from blood and lymph vessels, extracellular matrix components, and cells in the surrounding tissues, which provide growth factors and hormones. Terefore, the greater variability was observed among individual animals carrying orthotopic tumors.
For comparison with observations found in MiaPaCa-2 clones, we used the homologous recombination technique with pBKNT-D-targeted vector to disrupt K-RAS allele in BxPC-3 cells, which express wild-type K-RAS. Stable clones were isolated using positive selection by G418 (30 μg/mL), negative selection by ganciclavir, and screened for the targeted vector expression by RAS activity assay (Supplementary Fig. 5A). In contrast to MiaPaCa-2 clones with disrupted mutant K-RAS allele, disruption of wild-type K-RAS did not have any effect on the expression of phosphorylated p42/44 or AKT proteins levels (Supplementary Fig. 5B). These data indicate that alterations identified in MiaPaC-2a clones using K-RAS inactivation approach are specific to the activity of mutant K-RAS oncogene.
By comparing the gene expression profiles of MiaPaCa-2 parental cell line and clones, we have identified and validated two genes, RhoGAP5 and CAV-1, whose expression levels were modulated by K-RAS oncogenic inactivation. Further validation of signaling pathways downstream of RAS involving these genes identified Rho-GTPase effectors as excellent candidates for future design of therapeutic interventions in pancreatic cancer.
RAS superfamily of proteins is regulated via intrintic guanine nucleotide exchange and GTP hydrolysis. We found that the specific regulator of Rho family of GTPase, RhoGAP5, was upregulated in M-27 clone at the transcriptional level. The posttranslational regulation of RhoGAP5 by Src family tyrosine kinases also has been reported.41 Rho GTPases act as molecular switches to control signal transduction pathways by cycling between an inactive, GDP-bound and an active, GTP-bound form. Te GTP-bound Rho GTPases interact with a variety of downstream effectors to regulate different intracellular processes including cell growth and differentiation and cell migration.42 In their function in migration and invasion, Rho GTPases mediate changes in actin dynamics during the cell cycle and in the specialized cell structures (lamellipodium, podosomes and focal adhesions).43 In this regard, inhibition of RhoGTPase activity by the RhoGAPs counteracts tumor growth and invasion, and therefore, RhoGAPs are considered as tumor suppressors.44,45 There attempts are underway to evaluate RhoGTPase and RhoGAPs as targets for cancer therapy.46
We further looked at RAS-RalGTPase signaling pathway because RalGTPases play important roles in promoting the pancreatic neoplasia. Specifically, RalA GTPase has been critical to tumor initiation and RalB GTPase is involved in tumor metastasis.47
We found that RalA, but not RalB, protein expression is suppressed in M-27 clone with disrupted mutant K-RAS. We showed that inhibition of RalA expression with siRNA leads to suppression of MiaPaCa-2 cell invasion, but not migration. Altered Ral GTPases expression was not noted by the cDNA microarray screening. But the recent study by Gentry et al provided the evidence for the role of posttranslational modification in Ral protein functions initiated by the carboxyl-terminal hypervariable regions carboxyl-terminal tetrapeptide CAAX-motif. Both RalA and RalB require RAS converting enzyme CAAX endopeptidase for association with plasma membrane. Tese posttranslational modifications play important role in stability and function of RaL GTPases.48 Therefore, the RalGEF-Ral signaling pathway is an excellent candidate for future design of therapeutic interventions in pancreatic cancer.49–51
Caveolin-1 is a major component of membrane caveolae. It is an important regulator of signaling and molecule trafficking, as well as a mediator of cell proliferation and m etastasis.52 We found that CAV-1 transcription is downregulated in MiaPaCa-2 with disrupted mutant K-RAS. Using siRNA approach, we confirmed that downregulation of CAV-1 results in inhibition of pancreatic cells migration and invasion in vitro. Recently, we have identified the mechanism of K-RAS-mediated transcriptional induction of CAV-1 in colon cancer cells through AKT pathway and Sp1 transcription factor.53 We propose the similar mechanism for CAV-1 regulation in pancreatic cancer since AKT-signaling pathway was inhibited in M-27 cells.
Lastly, our finding of downregulation of the MET/HGF receptor tyrosine kinase in M-27 clone indicates that this is another candidate for future interventions. RTK are involved in cell–cell communication, metabolism, and cell motility.54 MET is overexpressed in up to 80% of invasive pancreatic cancers and correlates with poor overall patient survival.55 It has been reported that MET knockdown reduces tumor burden in orthotopic pancreatic cancer model.56 The RTK signaling pathway is upregulated in pancreatic cancer, and efforts have been put into preclinical and clinical development of antagonists of HGF/MET with several Phase II clinical trials.57
Despite the significant contribution of molecular research into pathogenesis of pancreatic cancer, the aggressive nature of this disease is not completely understood. Our findings open the possibilities of combined targeting AKT, RalA, and possible MET, pathways with different small molecule inhibitors (Fig. 10) to amplify the effect of anti-RAS therapy in metastatic pancreatic cancer.
Figure 10.

Diagram indicating the drugable targets (MET, RalA, and AKT) of RAS signaling pathways based on changes observed in MiaPaCa-2 pancreatic cell line after disruption of mutant K-RAS oncogene.
Supplementary Materials and Methods
RT-PCR assay for K-RAS mutations
MiaPaCa-2 and BxPC3 cell lines were collected after 48 hours of growth in culture. RNAs were isolated as described above. Reverse transcription (RT) reaction was performed on 2 μg of total RNA using random primers and Reverse Transcription System kit (Promega Corp.) according to the manufacturer’s protocol. Polymerase chain reaction (PCR) was performed on identical amounts of cDNA (100 ng) in a 25 μL reaction using puReTaq™Ready-To-Go™PCR Beads (Amersham Biosciences Corp.). The specific primers were designed to detect primer-mediated restriction fragment length polymorphism (RFLP) by creating a BstNI restriction site at codon 12 of the human K-RAS gene.18 The sense primer used was 5′-AAA CTT GTG GTA GTT GGA CCT-3′, and the antisense primer was 5′-TTG TTG GAT CAT ATT CGT CC. Mutation at codon 12 of K-RAS gene (G to C transition) changes the sequence of the BstNI site, so it is no longer recognizable by the BstNI enzyme and preserves the fragment size (92 bp). Restriction enzyme-digested PCR products were resolved on a 4% NuSieve:agarose (3:1) gel stained with ethidium bromide.
Taqman mutation detection assay
Competitive allele-specific Taqman PCR (Part no. 4467011; Life Technologies, Inc.) was performed according to the manufacturer’s protocol using a mutant allele assay, nucleotide mutation c.34G > T, amino acid change p.G12C (K-RAS_516_mut, Assay ID Hs00000113_mu), and K-RAS gene reference assay (K-RAS_rf, Assay ID Hs00000174_rf). DNA was isolated from MiaPaCa-2, M-27 and two colon cell lines Caco-2 and HCT116, using Qiagen DNA extraction kit (Qiagen, Inc.) according to the manufacturer’s protocol. Caco-2 colon cancer cells that express wild-type K-RAS and HCT116 colon cancer cells and carries K-RasG13D mutation were used as negative controls. The ΔCT values between amplification reactions for the K-RAS mutant allele assay (K-RAS_516_mut) and corresponding K-RAS reference assay obtained using the DNA template were calculated according to the formula: ΔCT = CT (mutant allele assay) − CT (gene reference assay) and compared to the predetermined detection ΔCT cutoff of 9.96 to determine the presence of K-Ras mutation. The percent of K-RAS mutation was calculated using the formula: % mutation = 1/2 × 100% (Detection™ Software manual (https://tools.lifetechnologies.com/content/sfs/manuals/cms_095871.pdf).
RFLP analysis of K-ras gene codon 12 mutations in MiaPaCa-2 and BxPc-3 pancreatic cell lines.
Phase-contrast appearances of MiaPaCa-2 cells (A) and clones (B).
Testing substrate specificity for MiaPaCa-2 and clones invasion.
Western blot analysis of expression of MET and CD44 in MiaPaCa-2 cells and M-27 clone. Figure is representative of two independent experiments. β-actin was used as loading control.
(A) RAS activation assay in BcPC-3 clones stably expressing K-RAS homologous recombination vector. Stable BxPC clones expressing homologous recombination vector were isolated using positive selection by G418 (30 μg/mL) and negative selection by ganciclavir and screened for the targeted vector expression by RAS activation assay. Expression levels of active RAS-GTP were detected by RAF affinity precipitation. (B) western blot analysis of the ERK and AKT protein levels in BxPC-3 cells and selected clones with disrupted K-RAS at 48 hours after subculture.
Supplementary Table 1.
List of antibodies used in this study.
| PROTEIN | 1° ANTIBODY DILUTION | 2° ANTIBODY DILUTION | SOURCE |
|---|---|---|---|
| K-Ras | 1:200 in BlottoA | 1:2000-M | sc-30 |
| PCNA | 1:500 in BlottoA | 1:2000-r | sc-9857 |
| C-MYC | 1:400 in BlottoA | 1:3000-r | sc-764 |
| Phospho-caveolin-1 | 1:500 in 5% BSA | 1:2000-r | CS#3251 |
| Caveolin-1 | 1:1000 in BlottoA | 1:2000-r | CS#3238 |
| Cleaved caspase 3 | 1:500 in BSA | 1:2000-r | CS#9661 |
| Phospho ERK | 1:2000 in 5% BSA | 1:3000-r | CS#4370 |
| ERK | 1:1000 in BlottoA | 1:3000-r | CS#9102 |
| Phospho AKT | 1:500 in 5% BSA | 1:2000-r | CS#4058 |
| AKT | 1:1000 in 5% BSA | 1:2000-r | CS#9272 |
| PI3K p110 α | 1:1000 in 5% BSA | 1:2000-r | CS#4255 |
| Phospho-Pi3K | :1000 in 5% BSA | 1:2000-r | CS#4228 |
| CD44 | 1:1000 in Blottoa | 1:2000-r | CS#3570 |
| Phospho MET | 1:1000 in 5% BSA | 1:2000-r | CS#3129 |
| MET | 1:1000 in BlottoA | 1:2000-M | CS#3148 |
| RalA | 1:1000 in BlottoA | 1:2000-r | CS#3526 |
| RalB | 1:1000 in BlottoA | 1:2000-r | CS#3523 |
| Ral BP1 | 1:1000 in BlottoA | 1:2000-r | CS#5739 |
| Phospho-Src | 1:500 in 5% BSA | 1:2000-r | CS#2101 |
| Src | 1:1000 in BlottoA | 1:2000-r | CS#2109 |
| B-actin | 1:5000 in 1.5% BSA | 1:10000-M | Sigma A5441 |
| Flotillin-1 | 1:1000 in BlottoA | 1:2000-r | CS#3253 |
Notes: BlottoA, 5% nonfat dry milk in TBST; M, anti-mouse secondary antibody; R, anti-rabbit secondary antibody; CS-Cell Signaling Inc., sc-Santa Cruz Biotechnology Inc.
Supplementary Table 2.
Quantitative K-rasG12C mutation analysis in MiaPaCa-2 and M-27 cell lines by taqMan mutation detection assay.
| CELL LINE, DNA TEMPLATE | CT MUTANT ASSAY | CT K-RAS REFERENCE ASSAY | ΔCT | ΔCT CUTOFF | % MUTATION |
|---|---|---|---|---|---|
| Caco-2 | 32.59 ± 0.1 4 | 22.32 ± 0.51 | 10.27 | 9.96 | 0 |
| HCT116 | 33.52 ± 3.44 | 23.09 ± 0.38 | 10.43 | 9.96 | 0 |
| MiaPaCa-2 | 20.51 ± 0.62 | 22.57 ± 0.36 | −2.058 | 9.96 | 100% |
| M-27 | 18.63 ± 0.28 | 21.69 ± 0.43 | −3.07 | 9.96 | N/A* |
Note:
Can not be properly evaluated due to interference with the inserted mutant K-ras sequence in the homologous recombination vector.
Supplementary Table 3.
Location and number of metastasis observed in SCID mice injected orthotopically with MiaPaCa-2 and M-27 cells.
| DAY OF DEATH (DAYS POST CELL INJECTION) | DIAPHRAGM | MESENTERY | KIDNEY | SPLEEN | ABDOMINAL WALL | LIVER | |
|---|---|---|---|---|---|---|---|
| MiaPaCa-2 | |||||||
| 0398-00 | 50 | too many | 2 | ||||
| 0398-R1 | 41 | 2 | 1 | 2 | |||
| 0398-L1 | 50 | too many | 3 | ||||
| 0399-R2 | 48 | 4 | 2 | ||||
| 0400-00 | 48 | 5 | |||||
| 0400-R1 | 42 | too many | 2 | ||||
| 0400-R2 | 56 | too many | 2 | 4 | |||
| 0400-L1 | 41 | 4 | too many | 3 | |||
| 0402-R2 | 41 | 2 | 1 | 4 | |||
| M-27 | |||||||
| 0394-00 | 39 | 1 | 6 | ||||
| 0394-R2 | 57 | 1 | |||||
| 0394-L1 | 57 | ||||||
| 0395-R1/L | 50 | ||||||
| 0396-00 | 56 | 1 | 2 small | ||||
| 0396-R2 | 56 | 1 | 2 small | ||||
| 0397-R1 | 50 | ||||||
| 0397-L1 | 48 | ||||||
Acknowledgments
We thank Dr. Senia Shirasawa and Dr. Takehiko Sasazuki, Japan Central Research Institute for Advance Molecular Medicine, Tokyo, Japan for providing the vector construct for targeted disruption of the human K-RAS gene. We would like to acknowledge the personnel of the University of Arizona Cancer Center Experimental Mouse Shared Resource (EMSR) and Genomics Shared Resource (GSR) at the University of Arizona Cancer Center for technical support in performing studies involving animals and cDNA microarray, respectively.
Abbreviations
- RhoGAP5
RhoA GTP activating protein 5
- CAV-1
caveolin-1
- RTK
receptor for tyrosine kinase
- RalA
RAS-like small GTPase A
- siRNA
small interfering RNA
- DPC4
deleted in pancreatic cancer locus 4
- MAPKs
mitogen-activated protein kinases
- PI3Ks
phosphoinositide 3-phosphate lipid kinases
- PIP2
phosphatidylinositol 4,5-phospate
- PIP3
phosphatidylinositol 3,4,5-phosphate
- GEFs
guanine exchange factors
- RalGDS
Ral guanine nucleotide dissociation stimulator
- neo
Escherihia coli neomycin resistancegene
- tk
herpes simplex thymidine kinase
- RT
reverse transcription
- RFLP
restriction fragment length polymorphism
- bp
base pair
- MLB
Mg2+ lysis buffer
- PPARγ
peroxisome proliferator-activated receptor gamma
- 15d-PGJ2
15-deoxy-Δ1214-prostaglandin J2
- DMSO
dimethyl sulfoxide
- RIPA
radioimmunoprecipitation assay
- h
hour
- PBS
phosphate-buffered saline
- SCID
severe combined immunodeficient
- s.c.
subcutaneously
- RhoGAPs
Rho GTPase-activating proteins
- GRB2
growth-factor-receptor-bound protein 2
- Sos
GEF Son of Sevenless
- HGF
hepatocyte growth factor
Footnotes
ACADEMIC EDITOR: Marc D. Basson, Editor in Chief
PEER REVIEW: Six peer reviewers contributed to the peer review report. Reviewers’ reports totaled 1,207 words, excluding any confidential comments to the academic editor.
FUNDING: This work was supported by National Institutes of Health grants P50CA095060, R01CA157595, and 5P30CA23074-32 (The University of Arizona Cancer Center Support Grant). The authors confirm that the funder had no influence over the study design, content of the article, or selection of this journal.
COMPETING INTERESTS: Authors disclose no potential conflicts of interest.
Paper subject to independent expert blind peer review. All editorial decisions made by independent academic editor. Upon submission manuscript was subject to anti-plagiarism scanning. Prior to publication all authors have given signed confirmation of agreement to article publication and compliance with all applicable ethical and legal requirements, including the accuracy of author and contributor information, disclosure of competing interests and funding sources, compliance with ethical requirements relating to human and animal study participants, and compliance with any copyright requirements of third parties. This journal is a member of the Committee on Publication Ethics (COPE).
Author Contributions
Conceived and designed the experiments: NAI. Analyzed the data: JP, RSH, HChen, BAS, HCui, NAI. Wrote the first draft of the manuscript: JP. Contributed to the writing of the manuscript: RSH, HChen, BAS, HCui. Agree with manuscript results and conclusions: All. Jointly developed the structure and arguments for the paper: JP, RSH, NAI. Made critical revisions and approved final version: JP, RSH, NAI. All authors reviewed and approved the final manuscript.
REFERENCES
- 1.You L, Chen G, Zhao YP. Core signaling pathways and new therapeutic targets in pancreatic cancer. Chin Med J. 2010;123(9):1210–1215. [PubMed] [Google Scholar]
- 2.Feldmann G, Maitra A. Molecular genetics of pancreatic ductal adenocarcinomas and recent implications for translational efforts. J Mol Diagn. 2008;10(2):111–122. doi: 10.2353/jmoldx.2008.070115. [DOI] [PMC free article] [PubMed] [Google Scholar]
- 3.Longnecker DS, Terhune PG. What is the true rate of K-ras mutation in carcinoma of the pancreas? Pancreas. 1998;17(4):323–324. doi: 10.1097/00006676-199811000-00001. [DOI] [PubMed] [Google Scholar]
- 4.Fleming JB, Shen GL, Holloway SE, Davis M, Brekken RA. Molecular consequences of silencing mutant K-ras in pancreatic cancer cells: justification for K-ras-directed therapy. Mol Cancer Res. 2005;3(7):413–423. doi: 10.1158/1541-7786.MCR-04-0206. [DOI] [PubMed] [Google Scholar]
- 5.Baines AT, Lim KH, Shields JM, et al. Use of retrovirus expression of interfering RNA to determine the contribution of activated K-Ras and ras effector expression to human tumor cell growth. Methods Enzymol. 2006;407:556–574. doi: 10.1016/S0076-6879(05)07045-X. [DOI] [PubMed] [Google Scholar]
- 6.Rejiba S, Wack S, Aprahamian M, Hajri A. K-ras oncogene silencing strategy reduces tumor growth and enhances gemcitabine chemotherapy efficacy for pancreatic cancer treatment. Cancer Sci. 2007;98(7):1128–1136. doi: 10.1111/j.1349-7006.2007.00506.x. [DOI] [PMC free article] [PubMed] [Google Scholar]
- 7.Hofmann I, Weiss A, Elain G, et al. K-RAS mutant pancreatic tumors show higher sensitivity to MEK than to PI3K inhibition in vivo. PLoS One. 2012;7(8):e44146. doi: 10.1371/journal.pone.0044146. [DOI] [PMC free article] [PubMed] [Google Scholar]
- 8.Qian J, Niu J, Li M, Chiao PJ, Tsao MS. In vitro modeling of human pancreatic duct epithelial cell transformation defines gene expression changes induced by K-ras oncogenic activation in pancreatic carcinogenesis. Cancer Res. 2005;65(12):5045–5053. doi: 10.1158/0008-5472.CAN-04-3208. [DOI] [PubMed] [Google Scholar]
- 9.Lim KH, Counter CM. Reduction in the requirement of oncogenic Ras signaling to activation of PI3K/AKT pathway during tumor maintenance. Cancer Cell. 2005;8(5):381–392. doi: 10.1016/j.ccr.2005.10.014. [DOI] [PubMed] [Google Scholar]
- 10.Collins MA, Pasca di Magliano M. Kras as a key oncogene and therapeutic target in pancreatic cancer. Front Physiol. 2013;4:407. doi: 10.3389/fphys.2013.00407. [DOI] [PMC free article] [PubMed] [Google Scholar]
- 11.Wellbrock C, Karasarides M, Marais R. The RAF proteins take centre stage. Nat Rev Mol Cell Biol. 2004;5(11):875–885. doi: 10.1038/nrm1498. [DOI] [PubMed] [Google Scholar]
- 12.Schreck R, Rapp UR. Raf kinases: oncogenesis and drug discovery. Int J Cancer. 2006;119(10):2261–2271. doi: 10.1002/ijc.22144. [DOI] [PubMed] [Google Scholar]
- 13.Castellano E, Downward J. Role of RAS in the regulation of PI 3-kinase. Curr Top Microbiol Immunol. 2010;346:143–169. doi: 10.1007/82_2010_56. [DOI] [PubMed] [Google Scholar]
- 14.Vogt PK, Gymnopoulos M, Hart JR. PI 3-kinase and cancer: changing accents. Curr Opin Genet Dev. 2009;19(1):12–17. doi: 10.1016/j.gde.2008.11.011. [DOI] [PMC free article] [PubMed] [Google Scholar]
- 15.Pruitt K, Der CJ. Ras and Rho regulation of the cell cycle and oncogenesis. Cancer Lett. 2001;171(1):1–10. doi: 10.1016/s0304-3835(01)00528-6. [DOI] [PubMed] [Google Scholar]
- 16.Bodemann BO, White MA. Ral GTPases and cancer: linchpin support of the tumorigenic platform. Nat Rev Cancer. 2008;8(2):133–140. doi: 10.1038/nrc2296. [DOI] [PubMed] [Google Scholar]
- 17.Shirasawa S, Furuse M, Yokoyama N, Sasazuki T. Altered growth of human colon cancer cell lines disrupted at activated Ki-ras. Science. 1993;260(5104):85–88. doi: 10.1126/science.8465203. [DOI] [PubMed] [Google Scholar]
- 18.Jiang W, Kahn SM, Guillem JG, Lu SH, Weinstein IB. Rapid detection of ras oncogenes in human tumors: applications to colon, esophageal, and gastric cancer. Oncogene. 1989;4(7):923–928. [PubMed] [Google Scholar]
- 19.Crowley-Weber CL, Payne CM, Gleason-Guzman M, et al. Development and molecular characterization of HCT-116 cell lines resistant to the tumor promoter and multiple stress-inducer, deoxycholate. Carcinogenesis. 2002;23(12):2063–2080. doi: 10.1093/carcin/23.12.2063. [DOI] [PubMed] [Google Scholar]
- 20.Ignatenko NAZH, Watts G, Skovan BA, Stringer DE, Gerner EW. The chemopreventive agent [alpha]-difluoromethylornithine blocks K-ras dependent tumor formation and specific gene expression in Caco-2 cells. Mol Carcinog. 2004;39:221–233. doi: 10.1002/mc.20008. [DOI] [PubMed] [Google Scholar]
- 21.Watts GS, Futscher BW, Isett R, Gleason-Guzman M, Kunkel MW, Salmon SE. cDNA microarray analysis of multidrug resistance: doxorubicin selection produces multiple defects in apoptosis signaling pathways. J Pharmacol Exp Ther. 2001;299(2):434–441. [PubMed] [Google Scholar]
- 22.Rozenblum E, Schutte M, Goggins M, et al. Tumor-suppressive pathways in pancreatic carcinoma. Cancer Res. 1997;57(9):1731–1734. [PubMed] [Google Scholar]
- 23.Downward J. Ras signalling and apoptosis. Curr Opin Genet Dev. 1998;8(1):49–54. doi: 10.1016/s0959-437x(98)80061-0. [DOI] [PubMed] [Google Scholar]
- 24.Hashimoto K, Ethridge RT, Evers BM. Peroxisome proliferator-activated receptor gamma ligand inhibits cell growth and invasion of human pancreatic cancer cells. Int J Gastrointest Cancer. 2002;32(1):7–22. doi: 10.1385/IJGC:32:1:7. [DOI] [PubMed] [Google Scholar]
- 25.Hashimoto K, Farrow BJ, Evers BM. Activation and role of MAP kinases in 15d-PGJ2-induced apoptosis in the human pancreatic cancer cell line MIA PaCa-2. Pancreas. 2004;28(2):153–159. doi: 10.1097/00006676-200403000-00006. [DOI] [PubMed] [Google Scholar]
- 26.Schmidt A, Hall A. Guanine nucleotide exchange factors for Rho GTPases: turning on the switch. Genes Dev. 2002;16(13):1587–1609. doi: 10.1101/gad.1003302. [DOI] [PubMed] [Google Scholar]
- 27.Sit ST, Manser E. Rho GTPases and their role in organizing the actin cytoskeleton. J Cell Sci. 2011;124(pt 5):679–683. doi: 10.1242/jcs.064964. [DOI] [PubMed] [Google Scholar]
- 28.Oxford G, Owens CR, Titus BJ, et al. RalA and RalB: antagonistic relatives in cancer cell migration. Cancer Res. 2005;65(16):7111–7120. doi: 10.1158/0008-5472.CAN-04-1957. [DOI] [PubMed] [Google Scholar]
- 29.Shirakawa R, Horiuchi H. Ral GTPases: crucial mediators of exocytosis and tumourigenesis. J Biochem. 2015;157(5):285–299. doi: 10.1093/jb/mvv029. [DOI] [PubMed] [Google Scholar]
- 30.Stathis A, Moore MJ. Advanced pancreatic carcinoma: current treatment and future challenges. Nat Rev Clin Oncol. 2010;7(3):163–172. doi: 10.1038/nrclinonc.2009.236. [DOI] [PubMed] [Google Scholar]
- 31.Shields JM, Pruitt K, McFall A, Shaub A, Der CJ. Understanding Ras: ‘it ain’t over ‘til it’s over’. Trends Cell Biol. 2000;10(4):147–154. doi: 10.1016/s0962-8924(00)01740-2. [DOI] [PubMed] [Google Scholar]
- 32.Bos JL. Ras oncogenes in human cancer: a review. Cancer Res. 1989;49(17):4682–4689. [PubMed] [Google Scholar]
- 33.Giehl K. Oncogenic Ras in tumour progression and metastasis. Biol Chem. 2005;386(3):193–205. doi: 10.1515/BC.2005.025. [DOI] [PubMed] [Google Scholar]
- 34.Jing Yuan, Fang BCR. The MAPK signalling pathways and colorectal cancer. Lancet Oncol. 2005;6:322–327. doi: 10.1016/S1470-2045(05)70168-6. [DOI] [PubMed] [Google Scholar]
- 35.Schramm K, Krause K, Bittroff-Leben A, Goldin-Lang P, Thiel E, Kreuser ED. Activated K-ras is involved in regulation of integrin expression in human colon carcinoma cells. Int J Cancer. 2000;87(2):155–164. doi: 10.1002/1097-0215(20000715)87:2<155::aid-ijc1>3.0.co;2-j. [DOI] [PubMed] [Google Scholar]
- 36.Berrozpe G, Schaefer J, Peinado MA, Real FX, Perucho M. Comparative analysis of mutations in the p53 and K-ras genes in pancreatic cancer. Int J Cancer. 1994;58(2):185–191. doi: 10.1002/ijc.2910580207. [DOI] [PubMed] [Google Scholar]
- 37.Li D, Xie K, Wolf R, Abbruzzese JL. Pancreatic cancer. Lancet. 2004;363(9414):1049–1057. doi: 10.1016/S0140-6736(04)15841-8. [DOI] [PubMed] [Google Scholar]
- 38.Zorde Khvalevsky E, Gabai R, Rachmut IH, et al. Mutant KRAS is a druggable target for pancreatic cancer. Proc Natl Acad Sci U S A. 2013;110(51):20723–20728. doi: 10.1073/pnas.1314307110. [DOI] [PMC free article] [PubMed] [Google Scholar]
- 39.Vasquez KM, Marburger K, Intody Z, Wilson JH. Manipulating the mammalian genome by homologous recombination. Proc Natl Acad Sci U S A. 2001;98(15):8403–8410. doi: 10.1073/pnas.111009698. [DOI] [PMC free article] [PubMed] [Google Scholar]
- 40.Hu C, Dadon T, Chenna V, et al. Combined inhibition of cyclin-dependent kinases (Dinaciclib) and AKT (MK-2206) blocks pancreatic tumor growth and metastases in patient-derived Xenograft models. Mol Cancer Ther. 2015;14(7):1532–1539. doi: 10.1158/1535-7163.MCT-15-0028. [DOI] [PMC free article] [PubMed] [Google Scholar]
- 41.Roof RW, Haskell MD, Dukes BD, Sherman N, Kinter M, Parsons SJ. Phosphotyrosine (p-Tyr)-dependent and -independent mechanisms of p190 RhoGAP-p120 RasGAP interaction: Tyr 1105 of p190, a substrate for c-Src, is the sole p-Tyr mediator of complex formation. Mol Cell Biol. 1998;18(12):7052–7063. doi: 10.1128/mcb.18.12.7052. [DOI] [PMC free article] [PubMed] [Google Scholar]
- 42.Bishop AL, Hall A. Rho GTPases and their effector proteins. Biochem J. 2000;348(pt 2):241–255. [PMC free article] [PubMed] [Google Scholar]
- 43.Albiges-Rizo C, Destaing O, Fourcade B, Planus E, Block MR. Actin machinery and mechanosensitivity in invadopodia, podosomes and focal adhesions. J Cell Sci. 2009;122(pt 17):3037–3049. doi: 10.1242/jcs.052704. [DOI] [PMC free article] [PubMed] [Google Scholar]
- 44.Sahai E, Marshall CJ. RHO-GTPases and cancer. Nat Rev Cancer. 2002;2(2):133–142. doi: 10.1038/nrc725. [DOI] [PubMed] [Google Scholar]
- 45.Moon SY, Zheng Y. Rho GTPase-activating proteins in cell regulation. Trends Cell Biol. 2003;13(1):13–22. doi: 10.1016/s0962-8924(02)00004-1. [DOI] [PubMed] [Google Scholar]
- 46.Vigil D, Cherfils J, Rossman KL, Der CJ. Ras superfamily GEFs and GAPs: validated and tractable targets for cancer therapy? Nat Rev Cancer. 2010;10(12):842–857. doi: 10.1038/nrc2960. [DOI] [PMC free article] [PubMed] [Google Scholar]
- 47.Lim KH, O’Hayer K, Adam SJ, et al. Divergent roles for RalA and RalB in malignant growth of human pancreatic carcinoma cells. Curr Biol. 2006;16(24):2385–2394. doi: 10.1016/j.cub.2006.10.023. [DOI] [PubMed] [Google Scholar]
- 48.Gentry LR, Nishimura A, Cox AD, et al. Divergent roles of CAAX motif-signaled posttranslational modifications in the regulation and subcellular localization of Ral GTPases. J Biol Chem. 2015;290(37):22851–22861. doi: 10.1074/jbc.M115.656710. [DOI] [PMC free article] [PubMed] [Google Scholar]
- 49.Neel NF, Martin TD, Stratford JK, Zand TP, Reiner DJ, Der CJ. The RalGEFRal effector signaling network: the road less traveled for anti-ras drug discovery. Genes Cancer. 2011;2(3):275–287. doi: 10.1177/1947601911407329. [DOI] [PMC free article] [PubMed] [Google Scholar]
- 50.Yan C, Liu D, Li L, et al. Discovery and characterization of small molecules that target the GTPase Ral. Nature. 2014;515(7527):443–447. doi: 10.1038/nature13713. [DOI] [PMC free article] [PubMed] [Google Scholar]
- 51.Kashatus DF. Ral GTPases in tumorigenesis: emerging from the shadows. Exp Cell Res. 2013;319(15):2337–2342. doi: 10.1016/j.yexcr.2013.06.020. [DOI] [PMC free article] [PubMed] [Google Scholar]
- 52.Senetta R, Stella G, Pozzi E, Sturli N, Massi D, Cassoni P. Caveolin-1 as a promoter of tumour spreading: when, how, where and why. J Cell Mol Med. 2013;17(3):325–336. doi: 10.1111/jcmm.12030. [DOI] [PMC free article] [PubMed] [Google Scholar]
- 53.Basu Roy UK, Henkhaus RS, Loupakis F, Cremolini C, Gerner EW, Ignatenko NA. Caveolin-1 is a novel regulator of K-RAS-dependent migration in colon carcinogenesis. Int J Cancer. 2013;133(1):43–57. doi: 10.1002/ijc.28001. [DOI] [PMC free article] [PubMed] [Google Scholar]
- 54.Lemmon MA, Schlessinger J. Cell signaling by receptor tyrosine kinases. Cell. 2010;141(7):1117–1134. doi: 10.1016/j.cell.2010.06.011. [DOI] [PMC free article] [PubMed] [Google Scholar]
- 55.Yu J, Ohuchida K, Mizumoto K, et al. Overexpression of c-met in the early stage of pancreatic carcinogenesis; altered expression is not sufficient for progression from chronic pancreatitis to pancreatic cancer. World J Gastroenterol. 2006;12(24):3878–3882. doi: 10.3748/wjg.v12.i24.3878. [DOI] [PMC free article] [PubMed] [Google Scholar]
- 56.Hill KS, Gaziova I, Harrigal L, et al. Met receptor tyrosine kinase signaling induces secretion of the angiogenic chemokine interleukin-8/CXCL8 in pancreatic cancer. PLoS One. 2012;7(7):e40420. doi: 10.1371/journal.pone.0040420. [DOI] [PMC free article] [PubMed] [Google Scholar]
- 57.Cecchi F, Rabe DC, Bottaro DP. Targeting the HGF/Met signaling pathway in cancer therapy. Expert Opin Ther Targets. 2012;16(6):553–572. doi: 10.1517/14728222.2012.680957. [DOI] [PMC free article] [PubMed] [Google Scholar]
Associated Data
This section collects any data citations, data availability statements, or supplementary materials included in this article.
Supplementary Materials
RFLP analysis of K-ras gene codon 12 mutations in MiaPaCa-2 and BxPc-3 pancreatic cell lines.
Phase-contrast appearances of MiaPaCa-2 cells (A) and clones (B).
Testing substrate specificity for MiaPaCa-2 and clones invasion.
Western blot analysis of expression of MET and CD44 in MiaPaCa-2 cells and M-27 clone. Figure is representative of two independent experiments. β-actin was used as loading control.
(A) RAS activation assay in BcPC-3 clones stably expressing K-RAS homologous recombination vector. Stable BxPC clones expressing homologous recombination vector were isolated using positive selection by G418 (30 μg/mL) and negative selection by ganciclavir and screened for the targeted vector expression by RAS activation assay. Expression levels of active RAS-GTP were detected by RAF affinity precipitation. (B) western blot analysis of the ERK and AKT protein levels in BxPC-3 cells and selected clones with disrupted K-RAS at 48 hours after subculture.
Supplementary Table 1.
List of antibodies used in this study.
| PROTEIN | 1° ANTIBODY DILUTION | 2° ANTIBODY DILUTION | SOURCE |
|---|---|---|---|
| K-Ras | 1:200 in BlottoA | 1:2000-M | sc-30 |
| PCNA | 1:500 in BlottoA | 1:2000-r | sc-9857 |
| C-MYC | 1:400 in BlottoA | 1:3000-r | sc-764 |
| Phospho-caveolin-1 | 1:500 in 5% BSA | 1:2000-r | CS#3251 |
| Caveolin-1 | 1:1000 in BlottoA | 1:2000-r | CS#3238 |
| Cleaved caspase 3 | 1:500 in BSA | 1:2000-r | CS#9661 |
| Phospho ERK | 1:2000 in 5% BSA | 1:3000-r | CS#4370 |
| ERK | 1:1000 in BlottoA | 1:3000-r | CS#9102 |
| Phospho AKT | 1:500 in 5% BSA | 1:2000-r | CS#4058 |
| AKT | 1:1000 in 5% BSA | 1:2000-r | CS#9272 |
| PI3K p110 α | 1:1000 in 5% BSA | 1:2000-r | CS#4255 |
| Phospho-Pi3K | :1000 in 5% BSA | 1:2000-r | CS#4228 |
| CD44 | 1:1000 in Blottoa | 1:2000-r | CS#3570 |
| Phospho MET | 1:1000 in 5% BSA | 1:2000-r | CS#3129 |
| MET | 1:1000 in BlottoA | 1:2000-M | CS#3148 |
| RalA | 1:1000 in BlottoA | 1:2000-r | CS#3526 |
| RalB | 1:1000 in BlottoA | 1:2000-r | CS#3523 |
| Ral BP1 | 1:1000 in BlottoA | 1:2000-r | CS#5739 |
| Phospho-Src | 1:500 in 5% BSA | 1:2000-r | CS#2101 |
| Src | 1:1000 in BlottoA | 1:2000-r | CS#2109 |
| B-actin | 1:5000 in 1.5% BSA | 1:10000-M | Sigma A5441 |
| Flotillin-1 | 1:1000 in BlottoA | 1:2000-r | CS#3253 |
Notes: BlottoA, 5% nonfat dry milk in TBST; M, anti-mouse secondary antibody; R, anti-rabbit secondary antibody; CS-Cell Signaling Inc., sc-Santa Cruz Biotechnology Inc.
Supplementary Table 2.
Quantitative K-rasG12C mutation analysis in MiaPaCa-2 and M-27 cell lines by taqMan mutation detection assay.
| CELL LINE, DNA TEMPLATE | CT MUTANT ASSAY | CT K-RAS REFERENCE ASSAY | ΔCT | ΔCT CUTOFF | % MUTATION |
|---|---|---|---|---|---|
| Caco-2 | 32.59 ± 0.1 4 | 22.32 ± 0.51 | 10.27 | 9.96 | 0 |
| HCT116 | 33.52 ± 3.44 | 23.09 ± 0.38 | 10.43 | 9.96 | 0 |
| MiaPaCa-2 | 20.51 ± 0.62 | 22.57 ± 0.36 | −2.058 | 9.96 | 100% |
| M-27 | 18.63 ± 0.28 | 21.69 ± 0.43 | −3.07 | 9.96 | N/A* |
Note:
Can not be properly evaluated due to interference with the inserted mutant K-ras sequence in the homologous recombination vector.
Supplementary Table 3.
Location and number of metastasis observed in SCID mice injected orthotopically with MiaPaCa-2 and M-27 cells.
| DAY OF DEATH (DAYS POST CELL INJECTION) | DIAPHRAGM | MESENTERY | KIDNEY | SPLEEN | ABDOMINAL WALL | LIVER | |
|---|---|---|---|---|---|---|---|
| MiaPaCa-2 | |||||||
| 0398-00 | 50 | too many | 2 | ||||
| 0398-R1 | 41 | 2 | 1 | 2 | |||
| 0398-L1 | 50 | too many | 3 | ||||
| 0399-R2 | 48 | 4 | 2 | ||||
| 0400-00 | 48 | 5 | |||||
| 0400-R1 | 42 | too many | 2 | ||||
| 0400-R2 | 56 | too many | 2 | 4 | |||
| 0400-L1 | 41 | 4 | too many | 3 | |||
| 0402-R2 | 41 | 2 | 1 | 4 | |||
| M-27 | |||||||
| 0394-00 | 39 | 1 | 6 | ||||
| 0394-R2 | 57 | 1 | |||||
| 0394-L1 | 57 | ||||||
| 0395-R1/L | 50 | ||||||
| 0396-00 | 56 | 1 | 2 small | ||||
| 0396-R2 | 56 | 1 | 2 small | ||||
| 0397-R1 | 50 | ||||||
| 0397-L1 | 48 | ||||||