

Abstract
The Patient Protection and Affordable Care Act is expected to reduce the number of uninsured people in the United States during the next eight years, but more than 10% are expected to remain uninsured. Uninsured people are one of the main populations using publicly funded safety net sexually transmitted disease (STD) prevention services. Estimating the proportion of the uninsured population expected to need STD services could help identify the potential demand for safety net STD services and improve program planning. In 2013, an estimated 8.27 million people met the criteria for being in need of STD services. In 2023, 4.70 million uninsured people are expected to meet the criteria for being in need of STD services. As an example, the cost in 2014 U.S. dollars of providing chlamydia screening to these people was an estimated $271.1 million in 2013 and is estimated to be $153.8 million in 2023. A substantial need will continue to exist for safety net STD prevention services in coming years.
The Patient Protection and Affordable Care Act is expected to increase the number of people in the United States with health insurance during the next eight years,1 partly by expanding access to Medicaid2 and creating health insurance marketplaces.3 However, insurance coverage is not expected to reach 100% of the population.1 Although the Affordable Care Act provides premium subsidies for those who are at 400% of the federal poverty level4 and allows for dependent coverage up to 26 years of age,5 some factors that have limited insurance coverage in the past will still be present, to some degree. For example, cost may be a barrier, even with subsidies. A 2009 survey found that 48% of those who are uninsured cited cost as a reason for not having health coverage.6 People who are uninsured and have to pay for their care may be more likely to seek low- or no-cost options for care.
Studies have shown that patients who seek care at sexually transmitted disease (STD) clinics have lower incomes than the general population, are less likely to have health insurance, and have cited low cost of care as an important reason for presenting to STD clinics.7–9 Furthermore, cost has been cited as an important reason for choosing care at STD clinics, and the imposition of fees or copays has been shown to reduce the number of patient visits.8,10,11 Surveys have shown that many STD clinic patients have insurance, but some STD clinic patients with insurance have reported that they would not be willing to use their insurance due to confidentiality concerns.8,9 From 2002 to 2006–2010, receipt of STD services among U.S. women increased among most subpopulations, with the exception of uninsured women.12 These factors suggest that low- or no-cost STD care may continue to be important for people lacking health insurance or with limited coverage.
STDs such as chlamydia are common,13 and the U.S. Preventive Services Task Force recommends that sexually active women aged ≤24 years be screened annually for chlamydia.14 The Centers for Disease Control and Prevention (CDC) additionally recommends chlamydia screening for all pregnant women regardless of age, annually for men who have sex with men, and for people newly diagnosed with human immunodeficiency virus infection.15 Although there are no other guidelines for chlamydia screening in men, having multiple sex partners is a risk factor for infection and repeat infection.15–17 For both men and women diagnosed with chlamydia, CDC recommends repeat screening three months after treatment.15
Given the changes in the health-care landscape in the United States, we estimated the size of the uninsured population aged 15–44 years in need of STD services based on existing clinical guidelines or elevated STD risk. To estimate a lower bound of the cost of providing STD services to the population in need of services, we estimated the annual cost of chlamydia screening, diagnostic testing, treatment, and repeat testing from 2013–2023 according to CDC guidelines.
METHODS
To estimate the size of the uninsured population, we used data from the U.S. Census, Congressional Budget Office (CBO), and the National Survey of Family Growth (NSFG), a nationally representative survey of the reproductive-aged population, which is described elsewhere.18 The CBO has produced estimates of the percentage of the non-elderly population who will be uninsured for each year through 2023.1,19 Data on the U.S. population aged 15–44 years came from the 2010 U.S. Census and Census projections for the years 2015, 2020, and 2025.20,21 We used straight-line extrapolation for years between the published estimates and apportioned population growth among racial/ethnic groups equal to their current proportions of the population (Technical Appendix).
To calculate the size of the population that is expected to need STD services and to estimate chlamydia prevalence, we used data from the NSFG18 and the National Health and Nutrition Examination Survey (NHANES).22 Data on self-reported pregnancy status, number and sex of sex partners in the last 12 months, and insurance status by age group and race/ethnicity were taken from the NSFG. Data from 2006–2010 were combined into a single sample to increase the sample size and enable age, race/ethnicity, and sex-stratified analysis. People in the population expected to need STD services were defined as women aged 15–24 years with ≥1 sex partner in the last 12 months or aged 25–44 years with >1 sex partner in the last 12 months or pregnant, or men with ≥1 male sex partner or >1 sex partner in the last 12 months.
Data on chlamydia prevalence by age group and race/ethnicity were taken from NHANES. We analyzed chlamydia prevalence data from NHANES for those aged 15–39 years; these data were grouped into two age categories: 15–24 and 25–44 years. For cost analysis purposes, the chlamydia prevalence for people aged 40–44 years was assumed to be the same as for people aged 25–39 years. High relative standard errors and small cell sizes prevented including insurance status for subgroup analysis of chlamydia prevalence. Data for the years 1999–2010 were combined into a single sample for the subgroup analyses.
Estimates were taken from the literature for the cost of providing chlamydia screening, diagnostic testing, repeat testing, and treatment services from the cost perspective of local or state health departments.23,24 Sequelae and patient time and travel costs were not included. All costs were adjusted to 2014 U.S. dollars using the Medical Care component of the Consumer Price Index (Technical Appendix).25
RESULTS
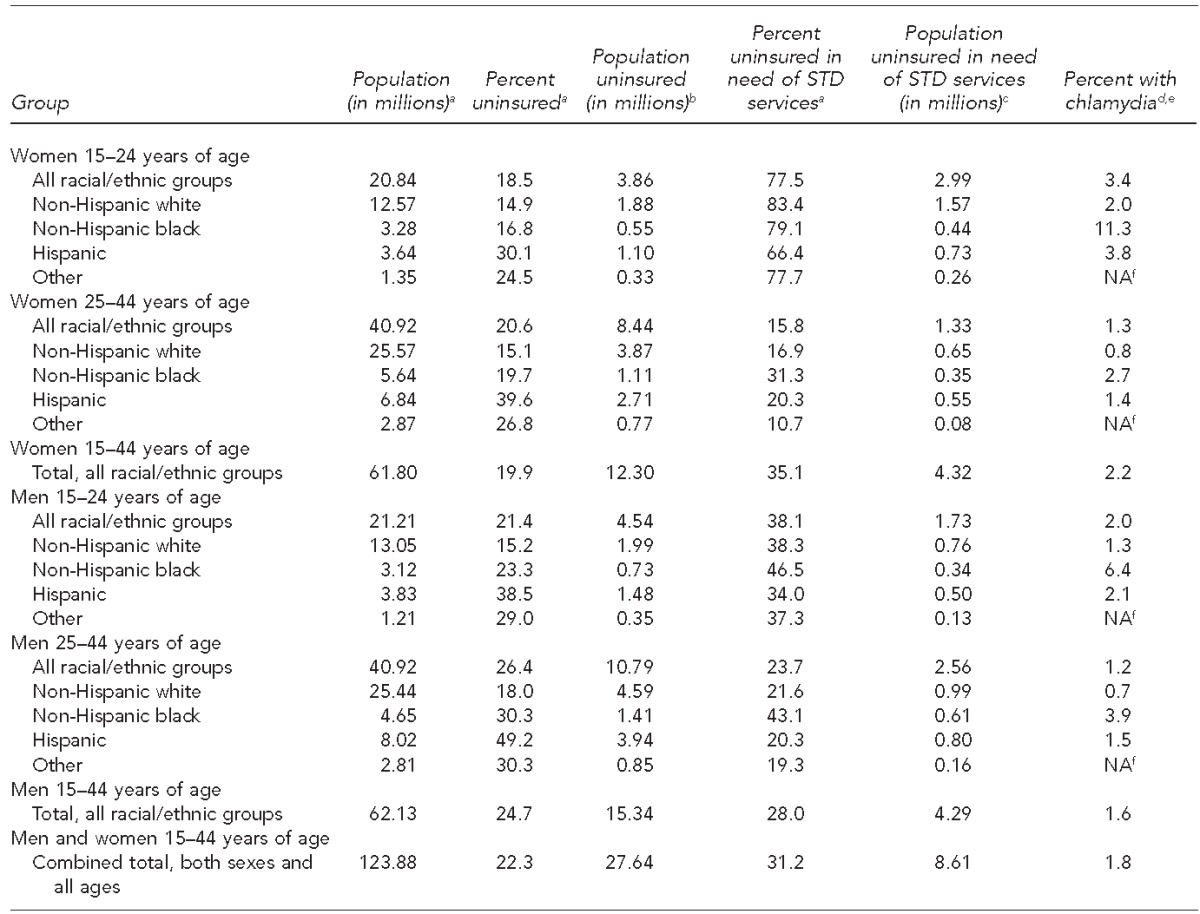
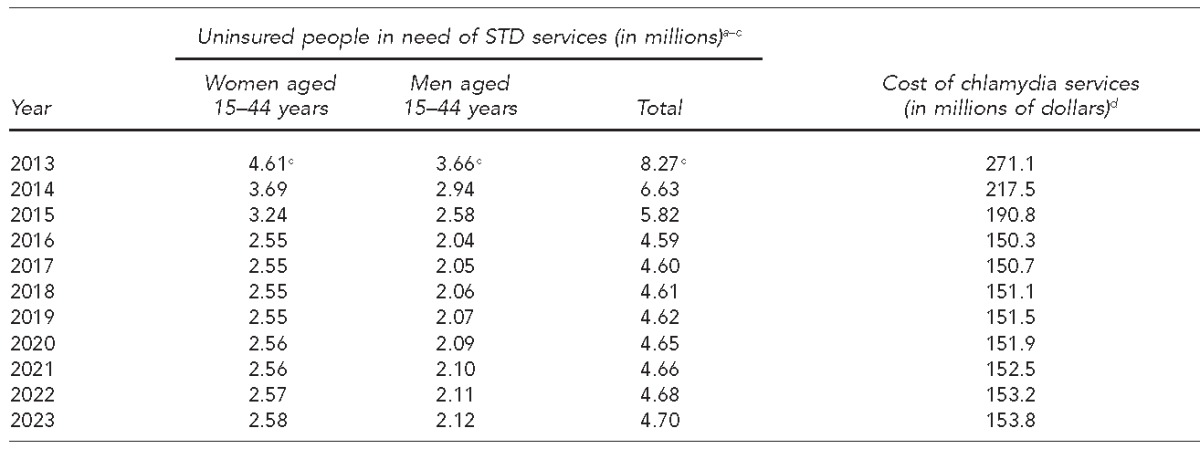
The percentage uninsured and in need of services varied by age group, sex, and race/ethnicity (Table 1). The number of uninsured men and women needing STD services was estimated to be 8.27 million in 2013 (6.6% of the population aged 15–44 years), falling to 4.59 million by 2016 (3.6% of the population aged 15–44 years), and remaining essentially unchanged through 2023. The cost of providing chlamydia screening, diagnostic testing, and treatment to this population is expected to decline from $271.1 million in 2013 to $150.3 million in 2016, and then increase thereafter due to population growth.
Table 1.
Population, insurance status, and the need for STD services for uninsured men and women aged 15–44 years in the United States, by age and race/ethnicity, 2006–2010
aData source: Centers for Disease Control and Prevention (US). National Survey of Family Growth, 2006–2010 [cited 2015 Aug 25]. Available from: URL: http://www.cdc.gov/nchs/nsfg/nsfg_2006_2010_puf.htm
bPopulation uninsured (in millions) was calculated by multiplying population (in millions) by percent uninsured.
cPopulation needing STD services was defined as women aged 15–24 years with ≥1 sex partner within the last 12 months or aged 25–44 years with >1 sex partner within the last 12 months or pregnant, or men with ≥1 male sex partner or >1 sex partner within the last 12 months. Data source: Centers for Disease Control and Prevention (US). National Survey of Family Growth, 2006–2010 [cited 2015 Aug 25]. Available from: URL: http://www.cdc.gov/nchs/nsfg/nsfg_2006_2010_puf.htm
dData source: Centers for Disease Control and Prevention (US). National Health and Nutrition Examination Survey (NHANES), 1999–2010 [cited 2015 Aug 25]. Available from: URL: http://www.cdc.gov/nchs/nhanes/nhanes_questionnaires.htm
eNHANES provides data on chlamydia prevalence for people aged 15–39 years; values in the table assume that the prevalence for people aged 40–44 years equals the prevalence for people aged 25–39 years.
fEstimate unstable due to high relative standard error
STD = sexually transmitted disease
NA = not available
DISCUSSION
Our estimates suggest that a substantial need for safety net STD services for uninsured people will remain through 2023. Access to STD services is important for reducing morbidity and for population health.15 The percentages of people who are uninsured and need STD services are relatively higher in racial/ethnic groups that bear a disproportionate STD burden, including non-Hispanic black and Hispanic people.13 The cost estimates focused on chlamydia screening alone because more cases of chlamydia are reported than gonorrhea or syphilis, and the recommendations for chlamydia screening are well established.13–15 The total cost of providing STD prevention services to uninsured people in need of STD services would be higher than the cost of chlamydia screening because the cost of chlamydia services does not include the cost of providing screening or diagnostic testing for other STDs or the cost of recommended vaccinations. Therefore, the cost of chlamydia screening represents a lower bound, but one that would be applicable to a relatively large proportion of the population.
The drop in cost shown during the years 2013–2016 indicates that insurance coverage is expected to increase during that time, but a substantial need for STD services in the uninsured population will remain. Although not all people who need STD services will receive them, providing low- or no-cost STD services with limited or no delay is important in maintaining access, particularly for people lacking regular health-care providers.26
Limitations
Our analysis was subject to several limitations. We used several data sources that spanned varying time frames, which could have introduced error. Population growth was assumed to be proportional to the current population, and chlamydia prevalence in those aged 40–44 years was assumed to be the same as that of 25- to 39-year-olds; these assumptions about population growth and chlamydia prevalence in adults aged 40–44 years are simplifications. It was also assumed that chlamydia prevalence would remain the same through 2023. These limitations have a relatively small potential impact on the overall cost estimate, however; chlamydia treatment and repeat screening costs add 10% to the overall costs (e.g., the total costs for 2023 without repeat screening would be an estimated $139.6 million). Another limitation was the scope of this analysis, which focused on those without insurance. Surveys have shown that a demand for safety net STD care exists among patients with insurance.8–11 Patients who cannot seek confidential care without using their insurance may be inhibited from seeking care.9,11,26
CONCLUSION
Estimates using data from health surveys, the U.S. Census, and the CBO suggest that several million uninsured people aged 15–44 years will be in need of STD services during the next eight years. The substantial cost of providing chlamydia screening services to this population indicates that a role for safety net STD services will continue in coming years.
Table 2.
Size of the uninsured U.S. population aged 15–44 years in need of STD services, and the cost of chlamydia screening, testing, and treatment (in 2014 U.S. dollars)
aData source: Centers for Disease Control and Prevention (US). National Survey of Family Growth, 2006–2010 [cited 2015 Aug 25]. Available from: URL: http://www.cdc.gov/nchs/nsfg/nsfg_2006_2010_puf.htm
bPopulation needing STD services was defined as women aged 15–24 years with ≥1 sex partner within the last 12 months or aged 25–44 years with >1 sex partner within the last 12 months or pregnant, or men with ≥1 male sex partner or >1 sex partner within the last 12 months.
cData on uninsured people in need of STD services for the years 2013–2023 were calculated using data from: Congressional Budget Office (US). CBO's May 2013 estimate of the effects of the Affordable Care Act on health insurance coverage [cited 2015 Aug 25]. Available from: URL: https://www.cbo.gov/sites/default/files/cbofiles/attachments/43900-2013-05-ACA.pdf
dCosts expressed in millions of 2014 U.S. dollars for chlamydia screening, diagnostic testing, treatment, and repeat screening of patients diagnosed with chlamydia. Chlamydia positivity in rescreened people was assumed to be 13.9% in women and 11.3% in men. Sources: Gift TL, Gaydos CA, Kent CK, Marrazzo JM, Rietmeijer CA, Schillinger JA, et al. The program cost and cost-effectiveness of screening men for chlamydia to prevent pelvic inflammatory disease in women. Sex Transm Dis 2008;35(11 Suppl):S66-75. Department of Labor (US), Bureau of Labor Statistics. Consumer price index [cited 2015 Apr 20]. Available from: URL: http://www.bls.gov/cpi
STD = sexually transmitted disease
Technical Appendix. Calculations used to estimate the size and direct medical cost of screening, testing, and treatment services for the safety net population for sexually transmitted disease prevention, United States, 2013–2023
To estimate the current and future uninsured population in the United States, we used data from multiple sources, and then combined these estimates with cost estimates from the literature to estimate the cost of chlamydia screening in the uninsured population, as described in the main article.
Methods
Census data from 20101 and projections for 2015, 2020, and 20252 were used to estimate the current and future U.S. populations of men and women aged 15–44 years. These estimates were then adjusted to estimate the noninstitutionalized U.S. population. To estimate the size of the U.S. population in interim years for which no projections were available, we used straight-line extrapolation as follows:
In this equation, i = 1, 2, 3, or 4 and represented the number of years since T0, the most recent year for which published estimates were available. T1 would be the next year for which population estimates from the U.S. Census Bureau were available. These calculations were performed separately for men and women, and for age groups 15–24 and 25–44 years for each sex. For example, the U.S. population of women aged 15–24 years was 21.31 million in 2010 (T0) and was projected to increase to 21.36 million in 2015 (T1).1,2 Therefore, the estimated population of women aged 15–24 years in 2014 was (in millions): 21.31 + [4 X (21.36 – 21.31) / 5 = 21.35].
The National Survey of Family Growth (NSFG) is a survey of the noninstitutionalized U.S. population aged 15–44 years.3,4 The noninstitutionalized U.S. population differs from the population included in the U.S. Census because the U.S. Census includes people residing in the United States, including institutionalized people (e.g., military personnel based in the United States and people in adult and juvenile correctional institutions).5 The relationship between the noninstitutionalized population estimated in the NSFG for 2006–2010 and the 2010 U.S. Census population varied by sex and age group, but averaged 98.5% (NSFG as a percentage of the 2010 U.S. Census population) for those aged 15–44 years. To estimate the growth in the noninstitutionalized U.S. population, we assumed the noninstitutionalized population would increase at the same rate as the U.S. resident population.
The U.S. Congressional Budget Office estimates for the percentage of the non-elderly population covered by health insurance were applied to the population estimates generated by the aforementioned procedure to estimate the size of the noninstitutionalized U.S. population aged 15–44 years with and without health insurance.6,7
The NSFG provides estimates of risk behavior, pregnancy, and health insurance status. To calculate the population of uninsured people needing STD services, we first identified the risk factors described in the Methods section of the main article (i.e., women aged 15–24 years with ≥1 sex partner in the last 12 months or aged 25–44 years with >1 sex partner in the last 12 months or pregnant, or men with ≥1 male sex partner or >1 sex partner in the last 12 months). People with ≥1 risk factor were defined as needing STD services. We then estimated the percentage of uninsured people needing STD services by sex, race/ethnicity, and age group. These percentages were used to estimate the percentage of the uninsured population needing STD services for the entire period 2013–2023. We had no data that could be used to estimate potential changes in the need for STD services among the uninsured population during that interval.
The National Health and Nutrition Examination Survey (NHANES) was used to estimate the chlamydia prevalence by sex, age, and race/ethnicity. As noted in the main article, data were available for people aged 15–39 years; we assumed for the purposes of this estimation that the prevalence for people aged 40–44 years was the same as for people aged 25–39 years. Chlamydia positivity was used to estimate the cost of providing chlamydia preventive services to the population needing STD services; people who are diagnosed with chlamydia should receive repeat testing 3–4 months after treatment.8
Cost data were drawn from previous studies.9,10 Costs and other variables used in the cost portion of the analysis are shown in the Technical Appendix Table. Because diagnostic testing visits incur different costs from opportunistic screening visits, we assumed that 20% of chlamydial infections were symptomatic in both men and women11 and that symptomatic people would seek treatment, thus incurring costs for diagnostic testing.10 We assumed that asymptomatic people would be screened opportunistically and assessed a lower cost for screening tests because we assessed only the incremental costs of collecting a test specimen and performing the test itself.9 Costs were also assessed for repeat screening of all people with chlamydia, with 13.9% of women and 11.3% of men infected with chlamydia at the time of repeat screening.12,13 We assumed that repeat visits would incur higher costs equivalent to diagnostic testing because the visits would be motivated by the need for the repeat test. All costs were adjusted to 2014 U.S. dollars using the Medical Care component of the Consumer Price Index.14 Future costs were not discounted.
Technical Appendix Table.
Costs and epidemiologic parameters related to chlamydia testing and treatment for the U.S. safety net population aged 15–44 years, 2013–2023
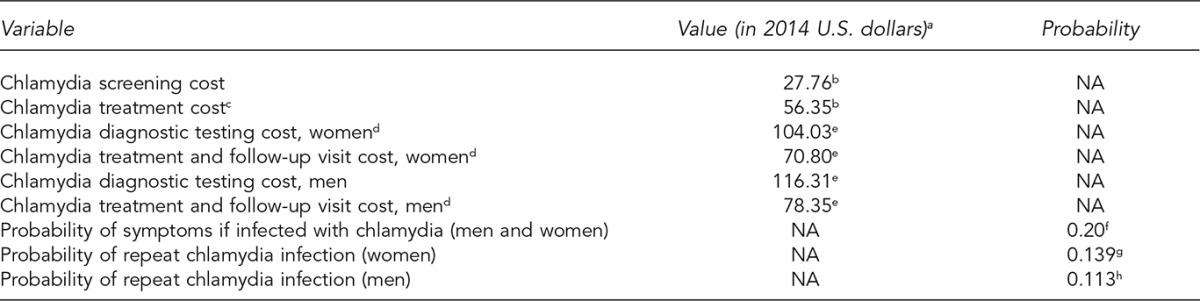
aAll costs were adjusted using the Medical Care component of the Consumer Price Index because of symptoms or because of repeat testing following a previous chlamydia diagnosis. Source: Health Resources and Services Administration (US), Bureau of Labor Statistics. Consumer price index [cited 2015 Apr 20]. Available from: URL: http://www.bls.gov/cpi
bGift TL, Gaydos CA, Kent CK, Marrazzo JM, Rietmeijer CA, Schillinger JA, et al. The program cost and cost-effectiveness of screening men for chlamydia to prevent pelvic inflammatory disease in women. Sex Transm Dis 2008;35(11 Suppl):S66-75.
cTreatment cost was applied to patients diagnosed as a result of screening.
dTreatment and follow-up visit costs were applied to patients who were infected with chlamydia and who sought evaluation.
eOwusu-Edusei K Jr, Doshi SR, Apt BS, Gift TL. The direct cost of chlamydial infections: estimates for the employer-sponsored privately insured population in the United States, 2003–2007 [published erratum appears in Sex Transm Dis 2011;38:888]. Sex Transm Dis 2010;37:519-21.
fSatterwhite CL, Torrone E, Meites E, Dunne EF, Mahajan R, Ocfemia MC, et al. Sexually transmitted infections among U.S. women and men: prevalence and incidence estimates, 2008. Sex Transm Dis 2013;40:187-93.
gHosenfeld CB, Workowski KA, Berman S, Zaidi A, Dyson J, Mosure D, et al. Repeat infection with chlamydia and gonorrhea among females: a systematic review of the literature. Sex Transm Dis 2009;36:478-89.
hFung M, Scott KC, Kent CK, Klausner JD. Chlamydia and gonococcal reinfection among men: a systematic review of data to evaluate the need for retesting. Sex Transm Infect 2007;83:304-9.
The cost of providing chlamydia preventive services was calculated as follows:
Cost (j,k,l) = population (j,k,l) × [CT prevalence (j,k,l) × [probability of symptoms × (cost of diagnostic testing (j) + treatment & follow-up visit cost (j)) + [(1 − probability of symptoms) × (cost of CT screening + treatment cost (j))]] + [(1 − CT prevalence (j,k,l)) × cost of CT screening]]
Cost of repeat testing (j,k,l) = population (j,k,l) × CT prevalence (j,k,l) × [cost of diagnostic testing (j) + probability of repeat CT infection ( j) × treatment & follow-up visit cost (j)]
In these equations, j = sex (male, female), k = race/ethnicity (non-Hispanic white, non-Hispanic black, Hispanic, or other), and l = age group (15–24 years, 25–44 years). The costs for each subgroup were summed for each year to equal the total cost for the given year.
For example, in the year 2013, there were an estimated 1.72 million uninsured non-Hispanic white females aged 15–24 years needing STD services. The chlamydia positivity rate was 1.8%. Therefore:
Cost = 1.72 million × [0.018 × [0.2 × ($104.03 + $70.80) + (1 − 0.20) × ($27.76 + $56.35)] + [(1 − 0.018) × 27.76] = $50.0 million
Cost of repeat testing = 1.72 million × 0.0018 × ($104.03 + 0.139 × $70.80) = $3.5 million
The combined cost for uninsured non-Hispanic white females aged 15–24 years needing STD services in 2013 would have been $53.5 million. To calculate the total cost in 2013 for chlamydia screening, treatment, and repeat testing in uninsured people aged 15–44 years needing services, these calculations would be completed for all sex, age, and racial/ethnic population subgroups, then summed.
REFERENCES
- 1.Census Bureau (US) 2010 U.S. Census [cited 2015 Jul 3] Available from: URL: http://www.census.gov/2010census.
- 2.Census Bureau (US) Table 3. Projections of the population by sex and selected age groups for the United States: 2015 to 2060 (NP2014-T3) [cited 2015 Jun 15] Available from: URL: http://www.census.gov/population/projections/files/summary/NP2014-T3.xls.
- 3.Groves RM, Mosher WD, Lepkowski JM, Kirgis NG. Planning and development of the continuous National Survey of Family Growth. Vital Health Stat. 2009;1(48) [PubMed] [Google Scholar]
- 4.Lepkowski JM, Mosher WD, Groves RM, West BT, Wagner J, Gu H. Responsive design, weighting, and variance estimation in the 2006–2010 National Survey of Family Growth. Vital Health Stat. 2013;2(158) [PubMed] [Google Scholar]
- 5.Census Bureau (US) 2010 Census summary file 1. 2012 [cited 2015 Jun 22] Available from: URL: www.census.gov/prod/cen2010/doc/sf1.pdf.
- 6.Congressional Budget Office (US) CBO's May 2013 estimate of the effects of the Affordable Care Act on health insurance coverage [cited 2015 Aug 25] Available from: URL: https://www.cbo.gov/sites/default/files/cbofiles/attachments/43900-2013-05-ACA.pdf.
- 7.Congressional Budget Office (US) The budget and economic outlook: 2014 to 2024. CBO [cited 2014 Apr 7] Available from: URL: http://www.cbo.gov/sites/default/files/cbofiles/attachments/45010-Outlook2014_Feb.pdf.
- 8.Workowski KA, Bolan GA. Sexually transmitted diseases treatment guidelines, 2015. MMWR Recomm Rep. 2015;64(RR-3):1–137. [PMC free article] [PubMed] [Google Scholar]
- 9.Gift TL, Gaydos CA, Kent CK, Marrazzo JM, Rietmeijer CA, Schillinger JA, et al. The program cost and cost-effectiveness of screening men for chlamydia to prevent pelvic inflammatory disease in women. Sex Transm Dis. 2008;35(11 Suppl):S66–75. doi: 10.1097/OLQ.0b013e31818b64ac. [DOI] [PubMed] [Google Scholar]
- 10.Owusu-Edusei K, Jr, Doshi SR, Apt BS, Gift TL. The direct cost of chlamydial infections: estimates for the employer-sponsored privately insured population in the United States, 2003–2007 [published erratum appears in Sex Transm Dis 2011;38:888] Sex Transm Dis. 2010;37:519–21. doi: 10.1097/OLQ.0b013e3181d73e4c. [DOI] [PubMed] [Google Scholar]
- 11.Satterwhite CL, Torrone E, Meites E, Dunne EF, Mahajan R, Ocfemia MC, et al. Sexually transmitted infections among U.S. women and men: prevalence and incidence estimates, 2008. Sex Transm Dis. 2013;40:187–93. doi: 10.1097/OLQ.0b013e318286bb53. [DOI] [PubMed] [Google Scholar]
- 12.Hosenfeld CB, Workowski KA, Berman S, Zaidi AA, Dyson J, Mosure D, et al. Repeat infection with chlamydia and gonorrhea among females: a systematic review of the literature. Sex Transm Dis. 2009;36:478–89. doi: 10.1097/OLQ.0b013e3181a2a933. [DOI] [PubMed] [Google Scholar]
- 13.Fung M, Scott KC, Kent CK, Klausner JD. Chlamydia and gonococcal reinfection among men: a systematic review of data to evaluate the need for retesting. Sex Transm Infect. 2007;83:304–9. doi: 10.1136/sti.2006.024059. [DOI] [PMC free article] [PubMed] [Google Scholar]
- 14.Bureau of Labor Statistics. Consumer price index [cited 2015 Apr 20] Available from: URL: http://www.bls.gov/cpi.
Footnotes
The findings and conclusions in this article are those of the authors and do not necessarily represent the official position of the Centers for Disease Control and Prevention.
REFERENCES
- 1.Congressional Budget Office (US) The budget and economic outlook: 2014 to 2024. CBO [cited 2014 Apr 7] Available from: URL: http://www.cbo.gov/sites/default/files/cbofiles/attachments/45010-Outlook2014_Feb.pdf.
- 2.Centers for Medicare & Medicaid Services (US) Medicaid and CHIP coverage [cited 2015 Aug 25] Available from: URL: https://www.healthcare.gov/medicaid-chip/getting-medicaid-chip.
- 3.Centers for Medicare & Medicaid Services (US) Health insurance marketplace [cited 2014 Jan 31] Available from: URL: https://www.healthcare.gov.
- 4. Pub. L. No. 111-148, 26 U.S.C., 36B (2010)
- 5. Pub. L. No. 111-148, 42 U.S.C., 300gg-14 (2010)
- 6.Adams PF, Martinez ME, Vickerie JL. Summary health statistics for the U.S. population: National Health Interview Survey, 2009. Vital Health Stat. 2010;10(248) [PubMed] [Google Scholar]
- 7.Landry DJ, Forrest JD. Public health departments providing sexually transmitted disease services. Fam Plann Perspect. 1996;28:261–6. [PubMed] [Google Scholar]
- 8.Celum CL, Bolan G, Krone M, Code K, Leone P, Spaulding C, et al. Patients attending STD clinics in an evolving health care environment. Sex Transm Dis. 1997;24:599–605. doi: 10.1097/00007435-199711000-00009. [DOI] [PubMed] [Google Scholar]
- 9.Hoover KW, Parsell B, Leichliter JS, Habel MA, Tao G, Pearson WS, et al. Characteristics of U.S. STD clinic patients and their access to healthcare, 2013. Am J Public Health. 2015 In press. [Google Scholar]
- 10.Rietmeijer CA, Alfonsi GA, Douglas JM, Lloyd LV, Richardson DB, Judson FN. Trends in clinic visits and diagnosed chlamydia trachomatis and Neisseria gonorrhoeae infections after the introduction of a copyament in a sexually transmitted infection clinic. Sex Transm Dis. 2005;32:243–6. doi: 10.1097/01.olq.0000149851.97269.91. [DOI] [PubMed] [Google Scholar]
- 11.Drainoni ML, Sullivan M, Sequeira S, Bacic J, Hsu K. Health reform and shifts in funding for sexually transmitted infection services. Sex Transm Dis. 2014;41:455–60. doi: 10.1097/OLQ.0000000000000135. [DOI] [PubMed] [Google Scholar]
- 12.Haderxhanaj LT, Gift TL, Loosier PS, Cramer RC, Leichliter JS. Trends in receipt of sexually transmitted disease services among women 15 to 44 years old in the United States, 2002 to 2006–2010. Sex Transm Dis. 2014;41:67–73. doi: 10.1097/OLQ.0000000000000058. [DOI] [PMC free article] [PubMed] [Google Scholar]
- 13.Centers for Disease Control and Prevention (US) Atlanta: Department of Health and Human Services (US); 2014. Sexually transmitted disease surveillance 2013. [Google Scholar]
- 14.LeFevre ML U.S. Preventive Services Task Force. Screening for chlamydia and gonorrhea: U.S. Preventive Services Task Force recommendation statement. Ann Intern Med. 2014;161:902–10. doi: 10.7326/M14-1981. [DOI] [PubMed] [Google Scholar]
- 15.Workowski KA, Bolan GA. Sexually transmitted diseases treatment guidelines, 2015. MMWR Recomm Rep. 2015;64(RR-3):1–137. [PMC free article] [PubMed] [Google Scholar]
- 16.Rietmeijer CA, Van Bemmelen R, Judson FN, Douglas JM., Jr Incidence and repeat infection rates of Chlamydia trachomatis among male and female patients in an STD clinic: implications for screening and rescreening. Sex Transm Dis. 2002;29:65–72. doi: 10.1097/00007435-200202000-00001. [DOI] [PubMed] [Google Scholar]
- 17.Datta SD, Sternberg M, Johnson RE, Berman S, Papp JR, McQuillan G, et al. Gonorrhea and chlamydia in the United States among persons 14 to 39 years of age, 1999 to 2002. Ann Intern Med. 2007;147:89–96. doi: 10.7326/0003-4819-147-2-200707170-00007. [DOI] [PubMed] [Google Scholar]
- 18.Groves RM, Mosher WD, Lepkowski JM, Kirgis NG. Planning and development of the continuous National Survey of Family Growth. Vital Health Stat. 2009;1(48) [PubMed] [Google Scholar]
- 19.Congressional Budget Office (US) CBO's May 2013 estimate of the effects of the Affordable Care Act on health insurance coverage [cited 2015 Aug 25] Available from: URL: https://www.cbo.gov/sites/default/files/cbofiles/attachments/43900-2013-05-ACA.pdf.
- 20.Census Bureau (US) 2010 U.S. Census [cited 2013 Jul 3] Available from: URL: http://www.census.gov/2010census.
- 21.Census Bueau (US) Table 3. Projections of the population by sex and selected age groups for the United States: 2015 to 2060 (NP2014-T3) [cited 2015 Jun 15] Available from: URL: http://www.census.gov/population/projections/files/summary/NP2014-T3.xls.
- 22.Zipf G, Chiappa M, Porter KS, Ostchega Y, Lewis BG, Dostal J. National Health and Nurtition Examination Survey: plan and operations, 1999–2010. Vital Health Stat. 2013;1(56) [PubMed] [Google Scholar]
- 23.Owusu-Edusei K, Jr, Doshi SR, Apt BS, Gift TL. The direct cost of chlamydial infections: estimates for the employer-sponsored privately insured population in the United States, 2003–2007 [published erratum appears in Sex Transm Dis 2011;38:888] Sex Transm Dis. 2010;37:519–21. doi: 10.1097/OLQ.0b013e3181d73e4c. [DOI] [PubMed] [Google Scholar]
- 24.Gift TL, Gaydos CA, Kent CK, Marrazzo JM, Rietmeijer CA, Schillinger JA, et al. The program cost and cost-effectiveness of screening men for chlamydia to prevent pelvic inflammatory disease in women. Sex Transm Dis. 2008;35(11 Suppl):S66–75. doi: 10.1097/OLQ.0b013e31818b64ac. [DOI] [PubMed] [Google Scholar]
- 25.Department of Labor (US), Bureau of Labor Statistics. Consumer price index [cited 2015 Apr 20] Available from: URL: http://www.bls.gov/cpi.
- 26.Cramer R, Leichliter JS, Gift TL. Are safety net sexually transmitted disease clinical and preventive services still needed in a changing health care system? Sex Transm Dis. 2014;41:628–30. doi: 10.1097/OLQ.0000000000000187. [DOI] [PMC free article] [PubMed] [Google Scholar]