Abstract
Currently accepted input parameter limitations in entropy-based, non-linear signal processing methods, for example, sample entropy (SampEn), may limit the information gathered from tested biological signals. The ability of quadratic sample entropy (QSE) to identify changes in electroencephalogram (EEG) signals of 11 patients with a diagnosis of Alzheimer's disease (AD) and 11 age-matched, healthy controls is investigated. QSE measures signal regularity, where reduced QSE values indicate greater regularity. The presented method allows a greater range of QSE input parameters to produce reliable results than SampEn. QSE was lower in AD patients compared with controls with significant differences (p < 0.01) for different parameter combinations at electrodes P3, P4, O1 and O2. Subject- and epoch-based classifications were tested with leave-one-out linear discriminant analysis. The maximum diagnostic accuracy and area under the receiver operating characteristic curve were 77.27 and more than 80%, respectively, at many parameter and electrode combinations. Furthermore, QSE results across all r values were consistent, suggesting QSE is robust for a wider range of input parameters than SampEn. The best results were obtained with input parameters outside the acceptable range for SampEn, and can identify EEG changes between AD patients and controls. However, caution should be applied because of the small sample size.
Keywords: electroencephalography, diseases, entropy, signal classification, medical signal processing, biomedical electrodes, sensitivity analysis
Keywords: Alzheimer disease classification, quadratic sample entropy, electroencephalogram, nonlinear signal processing methods, tested biological signals, EEG, signal regularity, QSE input parameters, P3 electrodes, P4 electrodes, O1 electrodes, O2 electrodes, subject-based classifications, epoch-based classifications, leave-one-out discriminant analysis, maximum diagnostic accuracy, receiver operating characteristic curve
1. Introduction
Alzheimer's disease (AD) is the most prevalent form of dementia [1], resulting in progressive memory loss and subsequently, death [2]. The only current accurate method of diagnosis is necropsy [1]. The gradual decline may mean the patient is undiagnosed as suffering from AD until the late stages of the disease. The increasing prevalence of AD and expected future pharmaceuticals means it is important to diagnose AD as early as possible. Recently, clinical guidelines recognise this preclinical phase, but AD diagnosis still relies on cognitive testing and the elimination of any other causes [2].
Electroencephalogram (EEG) recordings show that the power spectrum of brain signals of AD patients shifts to lower frequencies and that there is reduced coherence in cortical areas [3] although these changes in the EEG are not always identifiable in the early stages of the disease [4]. However, current guidelines do not identify the possible usefulness of EEGs to detect changes caused by AD. Changes because of AD have also been identified with other brain signal recording techniques, but many of these are prohibitive for wide-scale use because of issues with cost and invasiveness.
The complexity of an EEG signal arises from the non-linear interactions between the electric fields created by the neurons in the brain [5]. The EEG is a complex and aperiodic time series reflecting the cortical brain activity and therefore non-linear techniques are appropriate and may allow for increased insights into the mechanisms in the brain [6]. Non-linear analysis has been used to analyse changes in the EEGs of AD patients, showing increased regularity and decreased complexity in comparison to controls (see [7] for a review). However, many of the techniques applied to EEGs are inappropriate because of their unsuitability for short, noisy and non-stationary time series [8].
‘Entropy’ measures the degree of disorder in a system. When applied to signals it describes their level of repeatability and predictability [9]. Reduced entropy indicates greater regularity. Kolmogorov–Sinai (KS) entropy was found to be unsuitable for biomedical signals [10], so approximate entropy (ApEn) was created to allow for the calculation of KS entropy in biological signals [11]. However, the entropy level described by ApEn for a signal is not independent of the combinations of its input parameters. Sample entropy (SampEn) was introduced to overcome this issue [12]. This calculates the negative natural logarithm that a small sequence of data from the signal, which subsequently appears in it, will still do so if the size of such sequence increases by one sample. However, this is still adversely influenced by SampEn input parameters. One method developed to overcome the limitations of SampEn is quadratic sample entropy (QSE) [13].
This pilot study extends the usefulness of QSE in analysing the EEG signals of AD patients by extending the previously tested QSE input parameter combinations presented in [14], QSE values of the EEG background activity in AD patients and control subjects were compared. It is hypothesised that the patients’ EEGs will show an increased regularity. We further hypothesise that QSE will provide more robust estimations of the entropy than SampEn.
2. Subject database
The group contained 22 subjects. AD patients [5 men, 6 women, 72.5 ± 8.3 years and mean ± standard deviation (SD)] were recruited from the Alzheimer's Patients’ Relatives Association of Valladolid, Spain. A mini-mental state examination (MMSE) [15] was used to assess cognitive function, with the AD patients scoring 13.1 ± 5.9 (mean ± SD). The age-matched control group (7 men, 4 women, 72.8 ± 6.1 years and mean ± SD) were without past or present neurological disorders. The MMSE score was 30 ± 0 (mean ± SD) for all controls. Informed consent was obtained for all subjects and the local ethics committee approved the study. Further details can be found in [16].
The EEG was recorded with the international 10–20 system (electrodes F3, F4, F7, F8, Fp1, Fp2, T3, T4, T5, T6, C3, C4, P3, P4, O1 and O2) in an eyes closed, resting state with a sampling frequency of 256 Hz and 12-bit A-to-D precision using a Profile Study Room 2.3.411 EEG equipment (Oxford Instruments) with a low-pass hardware filter of 100 Hz. A specialist clinician selected a number of 5 s epochs (1280 points) with a minimal artefact contamination to be used offline for analysis. This epoch length is a compromise between the signal being long enough for reliable signal analysis and significantly limiting the effect of artefacts. A total of 30 ± 12.4 (mean ± SD) epochs from each electrode per subject were collected. These were then further filtered with a Hamming band-pass filter between 0.5 and 40 Hz to remove the DC component and residual high frequency noise. Further details can be found in [17].
3. Methods
QSE measures the regularity of a signal [18], overcoming the influence of input parameters m and r on the outcome of SampEn by normalising the regularity, calculated by SampEn, to the size of the matching region m [19]. Lower QSE indicates more regularity. SampEn identifies regularity based on the probability that a sample of length m from a signal that matches a subsequent part of that signal from which sample m is taken, within a tolerance r, will also match if the sample is m + 1 long [12]; thus parameter m defines the size of the patterns that can be compared and r acts as a filter, with any noise greater than r not affecting the result [10]. QSE gives a density statistic rather than the SampEn probability statistic. The reduction of the effects of parameters m and r allows for the possible use of a greater range of these parameters than that which is currently accepted with ApEn and SampEn [11, 12] to produce an accurate and reliable measure of entropy [19]. QSE produces finite results with stochastic, noisy deterministic and composite processes and is suitable for use with short, noisy data recordings [13]. It has previously been applied to R-R heart rate intervals [13, 18] where it was able to distinguish between normal heart rhythms and atrial fibrillation but, to the best of our knowledge, ours is the first thorough study of EEG in AD detailing extended input parameters with QSE.
Given a series of N points {x(n)} = x(1), x(2), …, x(N), SampEn, the method that is fully explained in [12] but reproduced here for completeness, must first be calculated. A sequence of embedding vectors Xm(i) to Xm(N–m + 1) is formed from the signal samples, where
| (1) |
The distance between any two vectors, Xm(i) and Xm(j), is defined as the maximum of the absolute distance between the scalar components of each vector:
| (2) |
The number of j for which the distance between Xm(i) and Xm(j) is less than r, Bi is defined as the number of j values where 1 ≤ j ≤ N–m and j ≠ i for any given Xm(i), with j being the number of matches for which the distance between Xm(i) and Xm(j) is less than or equal to r. Self-matches are not included, which ensures that all matches are true pattern repeats. This can then be used to define and Bm(r), respectively:
| (3) |
| (4) |
The methodology is then repeated, increasing m to m + 1, finding the number of vector matches, Ai, and defining and Am(r), respectively
| (5) |
| (6) |
This gives us two probabilities that can then be used to calculate SampEn as follows
| (7) |
Biomedical signals are of finite length. Equation (7) can therefore be estimated by
| (8) |
QSE is then calculated by adding the natural logarithm of 2r, removing the influence of the size of N through normalisation [19]:
| (9) |
Data was initially normalised to retain the distribution with mean = 0 and SD = 1 and while ensuring r remained the same proportion for all calculations.
QSE was computed in Matlab® with m = 1 and 2, within ranges accepted for SampEn [12]. However, r = 0.05–1.0 with intervals of 0.05 were tested for tolerance [19]. This is wider than the range of test parameters given for the application with SampEn of m = 1 or 2 and r = 0.1, 0.15, 0.2 or 0.25, where large r produce unspecific results with results tending to 0 for all cases and small r values produce adverse regularity estimates [11]. The nature of the QSE calculation only allows results to be truly comparable with results calculated with the same parameters [19].
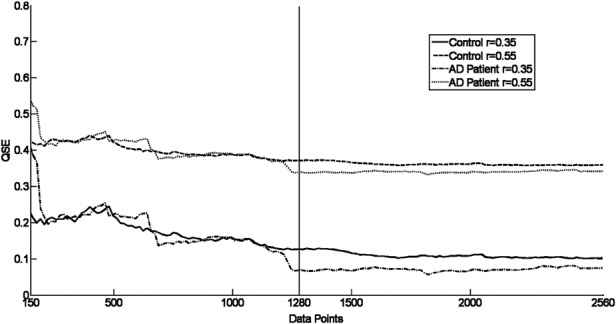
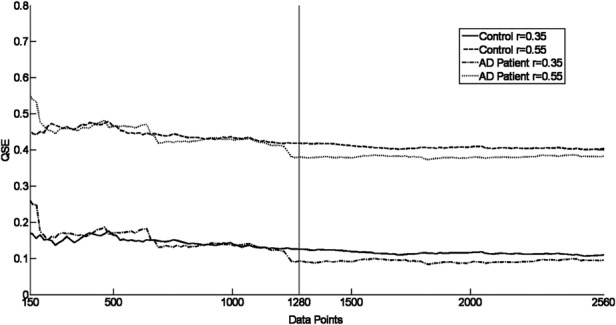
To review the stability of QSE for an EEG epoch of 1280 data points, research on the effect of the length on QSE was undertaken. The QSE of a control and AD signal of 150–2560 data points was calculated with m = 1 and 2 for r = 0.35 and 0.55. A representative of the results found is shown in Figs. 1 and 2. This study showed that a data length of 1280 samples – the length of the EEG epochs considered in this study – was sufficient to correctly characterise the QSE with the result being stable for N ≥ 1000.
Figure 1.

QSE values for two signals from electrode O1 showing stabilisation of the entropy for the signal for m = 1 with N > 150
Figure 2.

QSE values for two signals from electrode O1 showing stabilisation of the entropy for the signal for m = 2 with N > 150
Student's t-test (p < 0.01) was used to evaluate differences between the two groups. Normality was analysed with Lilliefors test (α = 0.01) and variance with Levene's test (α = 0.01).
Linear discriminant analysis (LDA) was selected to measure the ability of QSE to identify the two groups. LDA separates two or more classes based on Gaussian and homoscedastic variables. Accuracy was evaluated by the total number of subjects’ correctly classified (ROC) curve [20]. ROC curves produce a graph of all possible sensitivity/specificity pairs by analysing all decision thresholds given a classifier and hypothesis. Sensitivity is the fraction of AD patients correctly identified (true positive) and specificity is the ratio of controls correctly identified (true negative). The area under the ROC curve (AUC) was also computed. AUC can be interpreted as the probability that the classifier will rank one randomly chosen subject higher than another.
To avoid any overfitting, classification was estimated with a leave-one-subject-out cross-validation: the classifier was trained using data from all subjects but one, and then was tested on the left-out subject, providing unbiased estimations of the classification for small datasets. We implemented this into two schemes. The first one was subject-based (SB), where the instances are the average QSE value of all signals with the same input parameters from each electrode and each subject, producing 22 tests of 21 classifiers, whose results are then averaged. In the epoch-based (EB) scheme, each QSE value resulting from a single EEG epoch is used as an instance in its own right. This takes into account the variability among different epochs from the same electrode and subject.
4. Results
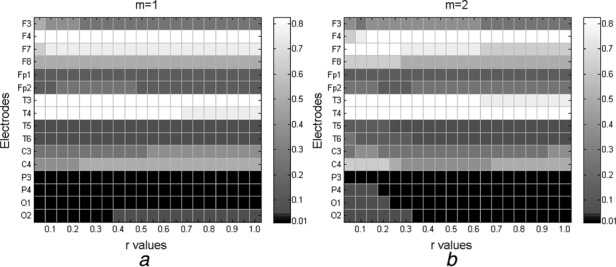
The entropy was found to be greater in control subjects than in AD patients except for two instances (F3 when m = 1 and r = 0.25 and T3 when m = 2 and r = 0.05) and electrode T4 in almost all cases except for r = 0.05 when m = 1 and between r = 0.3 and 0.8 when m = 2. All p values are detailed in Fig. 3. This suggests that AD patients’ EEGs are more regular than those of age-matched controls.
Figure 3.

All p values for all parameter combinations at all electrodes shown with logarithmic grey scale with statistically significant differences (p < 0.01) in black
a m = 1
b m = 2
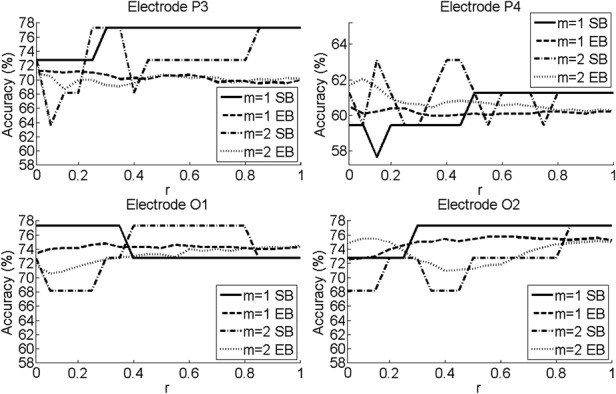
Classification results focused on statistically significant electrodes. Fig. 4 shows the accuracy for SB and EB results obtained at those four electrodes.
Figure 4.

Accuracy results from ROC calculations for varying r from statistically significant electrodes for SB and EB classifications
With m = 1 with SB, the maximum accuracy was 77.27% in P3, O1 and O2, while the maximum accuracy at P4 was 68.18%. With EB, the highest accuracy was 75.75% at O2 (r = 0.55 to r = 0.65). With m = 2 and SB, the maximum accuracy was 77.27% in P3, O1 and O2, while maximum accuracy at P4 was 72.73%. With EB, the highest accuracy was seen with O2 of 75.75%. With SB, the accuracy of results generally increased as r increased. However, the accuracy remains more consistent for all values of r with EB. The lowest sensitivities and specificities for statistically significant comparisons were always greater than 50%.
5. Discussion
The small range of input parameters to produce reliable representation of KS entropy in ApEn and SampEn [11, 12] may arbitrarily limit our understanding of signals under analysis. In this pilot study, QSE analysed the resting EEGs of 11 control and 11 age-matched AD patients to measure the signal regularity, showing an increased regularity in patients. Results show measuring QSE with r > 0.25 with m = 1 or 2 leads to more accurate results than the suggested ApEn and SampEn ranges. That QSE allows the use of a wider range of combinations with r being particularly advantageous given that the most accurate results are to be found outside this limited range. This greater range is possible because of the increased reliability with QSE.
A regularity increase of a similar magnitude was found in the EEG of AD patients for all parameter combinations tested, further supporting the reliability of the increased parameter range suggested for QSE possible by creating an entropy measure independent of r [18]. This increase of regularity mirrors most other studies using both EEG and magnetoencephalogram (MEG) recordings (see [3, 21] for reviews) including all studies investigating this EEG database with non-linear methods [17, 22]. It has also been shown that, with EEG signals, the number of data points needed to reliably calculate QSE must be significantly greater than the number suggested as required for atrial fibrillation detection [19].
With QSE, significant differences between the two groups were found at the same electrodes as with ApEn (P3, O1 and O2 with 77.27% accuracy and P4 with 72.73% accuracy with m = 1 and r = 0.25) [22] and SampEn (P3, P4, O1 and O2 with 77.27% accuracy with m = 1 and r = 0.25) [16], although these results are not calculated with leave-one-out cross-validation.
Multivariate multiscale permutation entropy has been applied successfully in a small pilot study [three healthy controls, three ADs, three mild cognitive impairments (MCI)], finding reduced complexity in AD and MCI patients in comparison to controls. However, scales greater than four were not investigated [23]. Multiscale SampEn has identified reduced complexity due to AD when investigating the SampEn gradient for scales 6–12 [24]. Statistically significant differences were found at F3, F7, Fp1, Fp2, T5, T6, P3, P4, O1 and O2. However, results using these methods are significantly more complex to interpret than those obtained with QSE, because of the graphical nature of the result.
Other non-entropy methods have also found comparable results. Synchrony has been found to be able to distinguish AD patients from controls with an accuracy of 83% but this was obtained by combining results from a number of synchrony methods [25]. Reduced complexity in AD patients has also been found with correlation dimension and the largest Lyapunov exponent [3]. However, these methods need very long datasets for reliable, accurate computation and so results must be viewed with caution.
Classification results suggest that intra-subject variability is low enough that a relatively simple classifier, such as LDA is able to provide similar performance in both cases. With this database, LDA was applied to detrended fluctuation analysis where the greatest accuracies were found at T6: 72.73% with SB and 71.07% with EB [26]. Thus, this suggests that QSE might lead to more reliable detections of AD patients using EEGs than other methods.
The small sample size of the test group leads this to be a pilot study: further research must include greater number of patients and ranges of pathologies, including further research into QSE input parameter m. It may also be that similar changes to those seen could occur because of other types of dementia or other diseases, such as Parkinson's disease, depression or schizophrenia [8].
6. Conclusion
In conclusion, QSE has been shown to highlight an increase of regularity in AD patients’ EEG signals across a greater range of input parameters than those suggested for use with ApEn and SampEn, with statistically significant differences between AD patients and controls at electrodes P3, P4, O1 and O2. The QSE method is more robust than SampEn, from which it is based, as it is able to highlight differences in AD patients and controls for a range of input parameters beyond what is currently accepted with SampEn or ApEn. Furthermore, this pilot study has shown that it is possible to obtain stable QSE values for relatively short EEG signals of 1000 data points or longer.
7. Acknowledgment
The authors thank Dr. Pedro Espino (Hospital Clinico San Carlos, Madrid, Spain) for his help in the recording and selection of EEG epochs.
8. Funding and declaration of interest
Conflict of interest: none declared.
9 References
- 1.Rossor M.: ‘Alzheimer's disease’, in Donaghy M. (Ed.): ‘Brain's diseases of the nervous system’ (Oxford University Press, Oxford, 2001), pp. 750–754 [Google Scholar]
- 2.McKann G.M., Knopman D.S., Chertkow H., et al. : ‘The diagnosis of dementia due to Alzheimer's disease: recommendations from the National Institute on Aging-Alzheimer's Association workgroups on diagnostic guidelines for Alzheimer's disease’, Alzheimers Dement., 2011, 7, (3), pp. 263–269 (doi: ) [DOI] [PMC free article] [PubMed] [Google Scholar]
- 3.Jeong J.: ‘EEG dynamics in patients with Alzheimer's disease’, Clin. Neurophysiol., 2004, 115, (7), pp. 1490–1505 (doi: ) [DOI] [PubMed] [Google Scholar]
- 4.Markand O.N.: ‘Organic brain syndromes and dementias’, in Daly D.D., Pedley T.A. (Eds.): ‘Current practice of clinical electroencephalography’ (Raven Press, New York, 1990), pp. 401–423 [Google Scholar]
- 5.Zhang X.S., Roy R.J.: ‘Derived fuzzy knowledge model for estimating the depth of anaesthesia’, IEEE Trans. Biomed. Eng., 2001, 48, (3), pp. 312–323 (doi: ) [DOI] [PubMed] [Google Scholar]
- 6.Kantz H., Schreiber T.: ‘Nonlinear time series analysis’ (Cambridge University Press, Cambridge, 1997) [Google Scholar]
- 7.Dauwels J., Vialatte F., Cichocki A.: ‘Diagnosis of Alzheimer's disease from EEG signals: Where are we standing?’, Curr. Alzheimer Res., 2010, 7, (6), pp. 487–505 (doi: ) [DOI] [PubMed] [Google Scholar]
- 8.Stam C.J.: ‘Nonlinear dynamical analysis of EEG and MEG: review of an emerging field’, Clin. Neurophysiol., 2005, 116, (10), pp. 2266–2301 (doi: ) [DOI] [PubMed] [Google Scholar]
- 9.Pham T.D., Elfiqi H.Z., Knecht S., Wersching H., Baune B.T., Berger K.: ‘Structural simplexity of the brain’, J. Neurosci. Methods, 2010, 188, (1), pp. 113–126 (doi: ) [DOI] [PubMed] [Google Scholar]
- 10.Pincus S.M.: ‘Assessing serial irregularity and its implications for health’, Ann. NY Acad. Sci., 2001, 954, pp. 245–267 (doi: ) [DOI] [PubMed] [Google Scholar]
- 11.Pincus S.M.: ‘Approximate entropy as a measure of system complexity’, Proc. Natl. Acad. Sci., 1991, 88, (6), pp. 2297–2301 (doi: ) [DOI] [PMC free article] [PubMed] [Google Scholar]
- 12.Richman J.S., Moorman J.R.: ‘Physiological time-series analysis using approximate entropy and sample entropy’, Am. J. Physiol. Heart Circ. Physiol., 2000, 278, (6), pp. H2039–H2049 [DOI] [PubMed] [Google Scholar]
- 13.Lake D.E., Moorman J.R.: ‘Accurate estimation of entropy in very short physiological time series: the problem of atrial fibrillation detection in implanted ventricular devices’, Am. J. Physiol. Heart Circ. Physiol., 2011, 300, (1), pp. H319–H325 (doi: ) [DOI] [PubMed] [Google Scholar]
- 14.Simons S., Abásolo D., Escudero J.: ‘Quadratic sample entropy and multiscale quadratic entropy of the electroencephalogram in Alzheimer's disease’. Proc. 5th Int. Conf. on Medical Signal and Information Processing, Liverpool, UK, July 2012 [Google Scholar]
- 15.Folstein M.F., Folstien S.E., McHugh P.R.: ‘Mini-mental state. A practical method for grading the cognitive state of patients for the clinician’, J. Psychiatr. Res., 1975, 12, (3), pp. 189–198 (doi: ) [DOI] [PubMed] [Google Scholar]
- 16.Abásolo D., Hornero R., Espino P., Álvarez D., Poza J.: ‘Entropy analysis of the EEG background activity in Alzheimer's disease patients’, Physiol. Meas., 2006, 27, (3), pp. 241–253 (doi: ) [DOI] [PubMed] [Google Scholar]
- 17.Abásolo D., Escudero J., Hornero R., Gómez C., Espino P.: ‘Approximate entropy and auto mutual information analysis of the electroencephalogram in Alzheimer's disease patients’, Med. Biol. Eng. Comput., 2008, 46, (10), pp. 1019–1028 (doi: ) [DOI] [PubMed] [Google Scholar]
- 18.Lake D.E.: ‘Renyi entropy measures of heart rate Gaussianity’, IEEE Trans. Biomed. Eng., 2006, 53, (1), pp. 21–27 (doi: ) [DOI] [PubMed] [Google Scholar]
- 19.Lake D.E.: ‘Improved entropy rate estimation in physiological data’. Proc. 33rd Annual Int. Conf. of the IEEE EMBS, Engineering in Medicine and Biology Society, Boston, MA, USA, August–September 2011, pp. 1463–1466 [DOI] [PubMed] [Google Scholar]
- 20.Fawcett T.: ‘An introduction to ROC analysis’, Pattern Recogn. Lett., 2006, 27, (8), pp. 861–874 (doi: ) [Google Scholar]
- 21.Stam C.J.: ‘Use of magnetoencephalography (MEG) to study functional brain networks in neurodegenerative disorders’, J. Neurol. Sci., 2010, 289, (1–2), pp. 128–134 (doi: ) [DOI] [PubMed] [Google Scholar]
- 22.Abásolo D., Hornero R., Espino P., Poza J., Sánchez C.I., de la Rosa R.: ‘Analysis of regularity in the EEG background activity of Alzheimer's disease patients with approximate entropy’, Clin. Neurophysiol., 2005, 116, (8), pp. 1826–1834 (doi: ) [DOI] [PubMed] [Google Scholar]
- 23.Morabito F.C., Labate D., La Foresta F., Bramanti A., Morabito G., Palamara I.: ‘Multivariate multi-scale permutation entropy for complexity analysis of Alzheimer's disease EEG’, Entropy, 2012, 14, (7), pp. 1186–1202 (doi: ) [Google Scholar]
- 24.Escudero J., Abásolo D., Hornero R., Espino P., López M.: ‘Analysis of electroencephalograms in Alzheimer's disease patients with multiscale entropy’, Physiol. Meas., 2006, 27, (11), pp. 1091–1106 (doi: ) [DOI] [PubMed] [Google Scholar]
- 25.Dauwels J., Vialatte F., Musha T., Cichocki A.: ‘A comparative study of synchrony measures for the early diagnosis of Alzheimer's disease based on EEG’, Neuroimage, 2010, 49, (1), pp. 668–693 (doi: ) [DOI] [PubMed] [Google Scholar]
- 26.Abásolo D., Hornero R., Escudero J., Espino P.: ‘A study on the possible usefulness of detrended fluctuation analysis of the electroencephalogram background activity in Alzheimer's disease’, IEEE Trans. Biomed. Eng., 2008, 55, (9), pp. 2171–2179 (doi: ) [DOI] [PubMed] [Google Scholar]


