

Summary
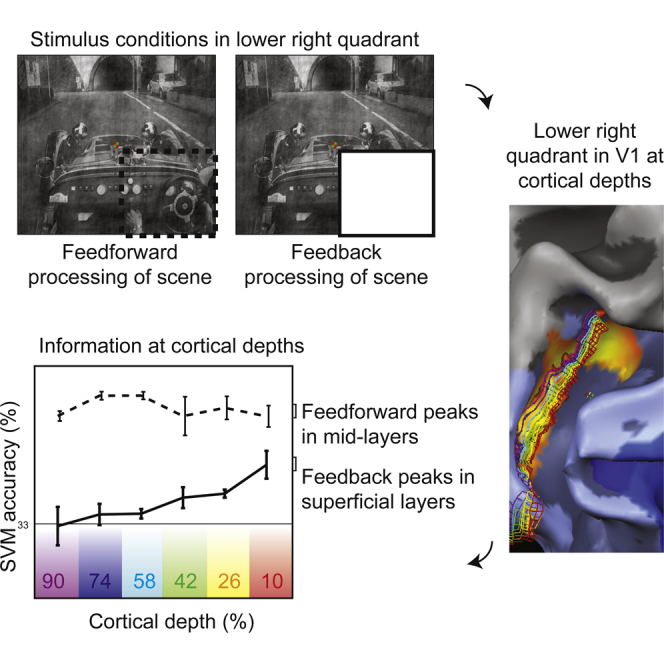
Neuronal cortical circuitry comprises feedforward, lateral, and feedback projections, each of which terminates in distinct cortical layers [1–3]. In sensory systems, feedforward processing transmits signals from the external world into the cortex, whereas feedback pathways signal the brain’s inference of the world [4–11]. However, the integration of feedforward, lateral, and feedback inputs within each cortical area impedes the investigation of feedback, and to date, no technique has isolated the feedback of visual scene information in distinct layers of healthy human cortex. We masked feedforward input to a region of V1 cortex and studied the remaining internal processing. Using high-resolution functional brain imaging (0.8 mm3) and multivoxel pattern information techniques, we demonstrate that during normal visual stimulation scene information peaks in mid-layers. Conversely, we found that contextual feedback information peaks in outer, superficial layers. Further, we found that shifting the position of the visual scene surrounding the mask parametrically modulates feedback in superficial layers of V1. Our results reveal the layered cortical organization of external versus internal visual processing streams during perception in healthy human subjects. We provide empirical support for theoretical feedback models such as predictive coding [10, 12] and coherent infomax [13] and reveal the potential of high-resolution fMRI to access internal processing in sub-millimeter human cortex.
Graphical Abstract
Highlights
-
•
High-resolution MRI shows functional information patterns in non-stimulated V1
-
•
Non-stimulated V1 receives cortical feedback information to superficial layers
-
•
Feedback to non-stimulated V1 superficial layers is predictive of visual context
Muckli et al. have discovered that the superficial layers of visual cortex V1 receive information when not directly stimulated. This information contains contextual feedback from higher visual areas. The data provide empirical evidence for layer-specific cortical feedback relevant for the neurobiology of predictive coding.
Results
To isolate feedback processing, we exploited the retinotopic organization of the visual cortex and blocked informative feedforward activation by occluding visual scene input in a contiguous subregion of the visual field. Using retinotopy, we isolated voxels that responded only to the occluded portion of the scene; in these voxels, we recorded brain activity by high-resolution and high-field fMRI and separated it into six different cortical depth layers. Scene-specific information did not directly stimulate the classical receptive fields of neurons in these voxels (i.e., through visual input), thus any scene responses are due to contextual feedback stimulating non-classical receptive fields. We studied multivariate activation patterns restricted to individual cortical depths to test for the presence of contextual scene information.
In the first experiment, we presented three visual scenes controlled for global luminance, contrast, and energy (“car on street,” “people at market,” and “ship in harbor,” as in [14]). The visual scenes were either presented in full (as “feedforward” stimulation) or with the right lower visual field quadrant occluded by a mask (“feedback” condition; Figure 1A). Voxels responding in the feedforward condition contained a mixture of feedforward, lateral, and feedback signals; however, for simplicity, we refer to feedforward and feedback conditions. The second experiment consisted of two one-quarter-occluded images (“crowd of people” and “vintage car”; luminance, contrast, and energy controlled), which were presented in the original space and in two spatially shifted versions (2° and 8° visual angle). This shifting of the surrounding context allowed us to test how a parametric change of contextual information modulates feedback. We presented “target” and “surround” checkerboard mapping stimuli in both experiments (Figure 1B) to isolate feedback-receiving voxels and eliminate spill-over from feedforward-stimulated regions (e.g., mediated by horizontal interactions within V1) [14].
Figure 1.
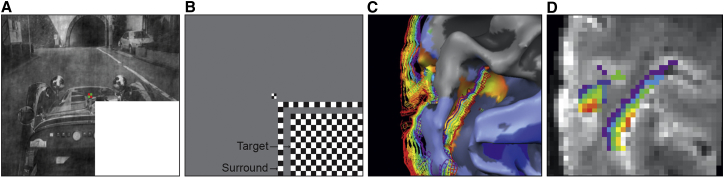
Experimental Procedure
(A) Example stimulus for the “feedback” condition, in which the lower right quadrant was occluded by a white mask (see [14]). The “feedforward” condition comprised the full image (not shown).
(B) “Target” and “surround” checkerboards (presented individually during scanning) to locate voxels responding to the lower right visual field.
(C) Left hemisphere cortical reconstruction of subject 2 in experiment 1, overlaid with a contrast of target response greater than surround response (light blue V1 and V3; dark blue V2). The cortical grid mesh depicts reconstructed depth layers from deep/inner (purple; close to white matter) to superficial/outer (red; close to the pial surface) cortical boundary.
(D) Corresponding regions of interest to (C) overlaid onto GE-EPI images.
We recorded functional brain imaging data with gradient echo (GE) and spin- and GE-based 3D-GRASE fMRI sequences at 0.8 mm3 resolution. We segmented the cortex using anatomic MRI scans (bias-field-corrected T1 over PD normalized) [15] and adjusted deep, inner, and superficial outer gray matter boundaries along the local GE-image intensity values to eliminate pial blood vessels and to correct for GE-EPI distortions. We used relative cortical depth values to create Laplace-based equipotential grid lines at six depths (from deep, inner [at the gray-white matter boundary] to superficial, outer [next to pia] 90%, 74%, 58%, 42%, 26%, and 10% depths; Figures 1C and 1D). The depth grid lines covered the cortical representation of the occluded image section in the lower right visual field quadrant of retinotopic areas V1d, V2d, and V3d (Figure 2), mapped independently but also as part of each run.
Figure 2.

Layer-Specific Regions of Interest
(A) For subject 1: surface reconstruction overlaid with “target > surround” activity map (left); cortical grid lines depicting depth layers (middle); regions of interest in depth layers overlaid onto GE-EP images (right).
(B) For subject 3: inflated surface reconstruction overlaid with map of target responses outlined in red (V1), green (V2), and white (V3); borders between visual areas V1 and V3 are shown by black (dashed) lines (left); inflated surface reconstruction overlaid with polar angle retinotopic mapping data (middle); regions of interest colored in activity (top) or depth overlaid onto GE-EP images (right).
(C) As in (B), but for subject 4. Note: The cortex appears thicker when the slice plane cuts through it at a shallow angle (right column).
In these “non-stimulated” patches of cortex, the GE-EPI data showed stronger responses in the superficial depths (close to the pial surface), whereas the 3D-GRASE data showed comparable responses across all cortical depths [16]. The bias of GE fMRI imaging to stronger responses in superficial cortical depths is due to larger blood vessels that lie on the cortex pial surface (Figure S1). Larger blood vessels could washout BOLD signal from a wider cortical area, compromising its retinotopic specificity (but see [17]). However, by including only voxels that respond retinotopically to the target and not the surround, we were able to exclude voxels exhibiting non-specific signals from draining veins. As a result, the filtered GE-fMRI responses in the superficial depths were still present but less pronounced and displayed constant retinotopic specificity across cortical depths (Figure S1).
To map the information at different cortical depths, we performed a multivoxel pattern analysis using two approaches: (1) decoding based on support vector machine (SVM) classification and (2) GLM-based encoding (Figure S2).
In decoding analyses, single-block SVM classification was significant at each depth for each subject (permutation tested at 5%; no corrections) during feedforward stimulation of V1. The highest performance was at 80% correct classification (chance 33%) at a cortical depth of 58% (third deepest depth; Figure 3A). For the feedback condition (i.e., the occluded images), only the superficial, outermost depth (10%) was significant in all four subjects, second-most outer depth (26%) was significant in three of four subjects, mid-depth (42%) was significant in two of four, and no subjects showed significance at the 58% mid-level, where feedforward information peaked. Deepest, inner depths (90% and 74%) were only significant in one subject (subject 3). We tested for the main effects of signal (feedforward and feedback) and depth using a 2 (signal) × 6 (depth) linear mixed model (see the Experimental Procedures). We found main effects of signal and depth and an interaction. For the feedforward signal, SVM accuracy was significantly larger for depth 58% compared to depth 90% (t(15) = 4.6; p = 0.0003), whereas for the feedback signal, SVM accuracy at depth 10% (i.e., the superficial layer) was significantly larger than depth 58% (t(15) = 4.9; p = 0.0001), depth 74% (t(15) = 3.0; p = 0.002), and depth 90% (t(15) = 5.5; p = 0.00005).
Figure 3.

Layer-Specific Information Decoding
(A) For V1 using GE fMRI data, SVM classification performance for all four subjects during feedforward (red dashed) and feedback (green) processing, in individual depths (color-coded purple to red). Chance decoding level was 33%, and significant classification is marked by circles.
(B) For V1, V2, and V3 averaged across subjects using GE fMRI data, SVM classification performance in cortical depths (from white matter 90% depth to superficial depth 10%). Left panels show prediction of single trials in the left out run; right panel shows the averaged condition of the left out run. Significant differences in decoding performance between depths are marked on subject-averaged single run plots (permutation tested); error bars represent SEM (across subjects and leave-one-run-out folds).
(C) As in (A), but for subject 2 and 4’s 3D-GRASE fMRI data.
(D) We trained an SVM algorithm on a given cortical depth and a given signal (i.e., either feedforward or feedback) and tested its performance against the same or the other signal across all depths. Asterisks indicate significance against theoretical chance level (FDR q < 0.05).
See also Figures S1–S4.
Within a classical hierarchical framework, it is reasonable to assume that the white occluders elicit identical patterns of brain activity. However, if lateral and feedback connections transmit contextual information to the non-stimulated region of cortex as shown by the decoding analysis, then we can also identify the univariate effect of single voxels and investigate the spatial extent in this informative structure. We addressed this in our encoding analysis. In brief, this involved a re-randomization analysis following the permutation of the explanatory variables in the general linear model of induced responses. This enabled us to evaluate the null distribution of the percent variance explained and associate the observed responses with a p value. We found that informative voxels explained significantly more variance for the original GLM (one predictor per scene) compared to a permutation GLM (randomized condition assignment). Subjects showed a J-function with some informative voxels in the deepest, innermost depth (90%), the least-informative voxels in the second innermost depth (74%), and the strongest peak in the superficial, outer depth (10%). We consistently found the highest percentage of informative voxels in the outer depths of V1 in all subjects (Figure S2).
Subsequent to the GE measurement, we scanned the same four subjects again for four runs with identical trials but used the 3D-GRASE sequence to acquire fMRI data that we expected to be less sensitive to large draining veins [16]. The 3D-GRASE sequence has reduced contrast to noise ratio, and we could only cover V1 because of the small acquisition field of view. For two subjects (1 and 3), feedforward stimulation did not lead to consistent informative readout in any of the six depths. For the other two subjects (2 and 4), classification based on visual stimulation was clear and significant. In subjects 2 and 4, we also found significant feedback information, again in the superficial depth of V1 (Figure 3C). Encoding analysis of 3D-GRASE data confirmed the presence of more informative voxels in the superficial, outer depth of V1 (Figure S2).
To investigate how feedback interacts with feedforward processing, whether they carry different information content, and whether they coexist in specific layers, we performed cross-layer decoding. We trained an SVM algorithm on a given depth and a given signal (i.e., either feedforward or feedback) and tested its performance against the same or the other signal, across all depths (Figure 3D). We found that training on feedback and testing on feedforward leads to highest (FDR q < 0.05) accuracy (FBxFF > FFxFB t(575) = 4.67; >FBxFB t(575) = 6.85) except when testing and training on feedforward (FFxFF). Training the model on the coarser feedback information pattern leads to a more general model that allows for accurate decoding of the finer feedforward multivoxel pattern. However, the opposite is not true as the model built on specific feedforward information cannot be generalized to decode the coarser feedback information content.
With the cross-layer cross-signal decoding, we can also demonstrate the following general points: (1) the feedforward signal is homogeneous across layers (i.e., training on depth layers allows to generalize to other depth layers) and (2) although feedforward and feedback activation are very different in amplitude, they can share common information in their patterns of BOLD signal.
Up until now, we have described decoding analyses across cortical depths in V1. We performed identical analyses in V2 and V3. The decoding analysis in V2 revealed that contextual Information was significant in the most inner depth (90%) in two subjects (Figure S4; subjects S2 and S4), and in the most outer two depths (10% or 26%) in another three subjects (S1, S2, and S3). In V3, there was reduced feedforward information compared to V1 and V2. All subjects had significant classification at mid-depth 58%, and three subjects showed significant information at least at two other depths. There was no consistent pattern in the feedback condition in V3 (Figure S4). We propose that both the reduced size of area V3 and its reduced functional specialization for static scene information might explain the decreased decoding performance.
In the spatial shift experiment, we tested the precision of feedback signals by shifting the contextual surround image. We trained the classifier to discriminate two images and then tested it on shifted versions of these two images. Consistent with the first experiment, feedback was most prominent in the outer layers. Furthermore, decoding was only significant when cross-classifying across the smallest shift (2°) in the superficial depth (10%) in subject 1, second and third outermost depths (26% and 42%, respectively) for subject 2, and the two outermost depths (10% and 26%) in subjects 3 and 4 (Figure 4).
Figure 4.

Feedback Sensitivity to Shifts of the Surround
(A) Occluded stimuli used in experiment 2. We shifted the original stimuli (0°) by 2° and 8°.
(B) Cortical depth layers shown in the sagittal plane of subject 2, from deep, inner (purple) to superficial, outer (red).
(C) SVM decoding performance for different depths of V1 when cross-classifying images of different shifts, for all four subjects.
Discussion
When primary visual cortex does not receive sensory input, it nonetheless communicates with other brain areas. Such internally generated processing states are not sufficiently understood [18, 19] but are an essential feature of the brain, accounting for 90% of overall energy consumption [20, 21]. We propose that such internal communications include feedback sent across large cortical networks, including back to sensory areas [22–24]. The effects of feedback inputs on sensory neurons are uniquely challenging to study because it requires that feedback inputs be separated from externally induced (feedforward) processing. Access to feedback signals during human visual cognition will explicate century-old theories of inferential brain processing [6]. Taking advantage of the retinotopic organization of V1, we use a partial occlusion paradigm whereby we can drive higher visual areas to feed natural scene information back to regions of V1 that do not receive feedforward scene inputs [14]. We propose that ultra-high-field fMRI (7T) provides a means to investigate the presence of such contextual feedback in distinct cortical layers.
We found contextual feedback information in the superficial layers of V1. Several candidate regions could be sending contextual information to V1, including extrastriate visual (V2–V7) and more distant cortical and subcortical areas. We know from studies of rodent cortex that long-distance cortical feedback and associative thalamo-cortical interactions have dense projections to supragranular layer L1 [1]. Up to 90% of synaptical input in layer 1 is from long-distance sources, with only 10% from local neurons [1, 2]. Larkum proposes a neuronal mechanism that integrates the long-distance top-down projections with bottom-up input, which involves layer 5 pyramidal cells that have distal tuft dendrites in layer 1. David Mumford [10, 25] proposed a conceptual interpretation that cortical feedback from higher areas predicts the most likely feedforward input to the “active blackboard” of V1. The predictive coding framework describes neuronal computations in cortex, which integrate the predictions carried by cortical feedback with sensory inputs carried by feedforward projections [4]. Predicted (or irrelevant) sensory inputs may be dis-amplified by the inhibition of apical amplification [13]. In such a functional architecture, feedback signals from regions with larger receptive fields would code at a more abstract level and at a coarser spatial scale. Consistent with this idea, we found that the information in supragranular layers is similar even when we shifted the surrounding visual context by 2° (visual angle).
Functional MRI is sensitive to neuronal energy consumption, which includes dendritic activity and activity of inhibitory interneurons [26]. The use of ultra-high-resolution fMRI allowed us to focus on the information in activation patterns at different cortical depths. Previous ultra-high-resolution layer-specific fMRI focused on activation amplitude rather than information [27–31]. Our design permits the sampling of top-down dendritic activity that contains scene information in superficial layers of human V1.
Author Contributions
Conceptualization, L.M. and F.D.M.; Methodology, L.M., F.D.M., E.Y., K.U., and F.W.S.; Software, L.M., L.V., F.W.S., and R.G.; Formal Analysis, L.M., L.V., L.S.P., and F.D.M.; Investigation, L.M., F.D.M., E.Y., L.S.P., and F.W.S.; Writing – Original Draft, L.M. and L.S.P.; Writing – Review & Editing, L.M., L.S.P., L.V., F.D.M., F.W.S., K.U., E.Y., and R.G.; Visualization, L.M., L.S.P., and L.V.
Acknowledgments
The institutional review board at the University of Minnesota and the ethics committee at the University of Glasgow approved the studies. We thank Jan Zimmermann for support in data acquisition and Jack Gallant, Kendrick Kay, and Elia Formisano for discussion of encoding analysis. R.G. is supported by ERC grant “ColumnarCodeCracking” (ERC-2010-AdG; grant agreement no. 269853). E.S., K.U., and work conducted in CMRR are supported by NIH grants P41 EB015894 (NIBIB) and P30 NS076408 (NINDS). L.M., L.V., and L.S.P. are supported by ERC grant (ERC StG 2012_311751-“Brain reading of contextual feedback and predictions”) dedicated to L.M.
Published: October 1, 2015
Footnotes
This is an open access article under the CC BY-NC-ND license (http://creativecommons.org/licenses/by-nc-nd/4.0/).
Supplemental Information includes Supplemental Experimental Procedures and four figures and can be found with this article online at http://dx.doi.org/10.1016/j.cub.2015.08.057.
Supplemental Information
References
- 1.Larkum M. A cellular mechanism for cortical associations: an organizing principle for the cerebral cortex. Trends Neurosci. 2013;36:141–151. doi: 10.1016/j.tins.2012.11.006. [DOI] [PubMed] [Google Scholar]
- 2.Markov N.T., Vezoli J., Chameau P., Falchier A., Quilodran R., Huissoud C., Lamy C., Misery P., Giroud P., Ullman S. Anatomy of hierarchy: feedforward and feedback pathways in macaque visual cortex. J. Comp. Neurol. 2014;522:225–259. doi: 10.1002/cne.23458. [DOI] [PMC free article] [PubMed] [Google Scholar]
- 3.Sillito A.M., Cudeiro J., Jones H.E. Always returning: feedback and sensory processing in visual cortex and thalamus. Trends Neurosci. 2006;29:307–316. doi: 10.1016/j.tins.2006.05.001. [DOI] [PubMed] [Google Scholar]
- 4.Bastos A.M., Usrey W.M., Adams R.A., Mangun G.R., Fries P., Friston K.J. Canonical microcircuits for predictive coding. Neuron. 2012;76:695–711. doi: 10.1016/j.neuron.2012.10.038. [DOI] [PMC free article] [PubMed] [Google Scholar]
- 5.Bullier J. Integrated model of visual processing. Brain Res. Brain Res. Rev. 2001;36:96–107. doi: 10.1016/s0165-0173(01)00085-6. [DOI] [PubMed] [Google Scholar]
- 6.Clark A. Whatever next? Predictive brains, situated agents, and the future of cognitive science. Behav. Brain Sci. 2013;36:181–204. doi: 10.1017/S0140525X12000477. [DOI] [PubMed] [Google Scholar]
- 7.Gilbert C.D., Sigman M. Brain states: top-down influences in sensory processing. Neuron. 2007;54:677–696. doi: 10.1016/j.neuron.2007.05.019. [DOI] [PubMed] [Google Scholar]
- 8.Meyer K. Another remembered present. Science. 2012;335:415–416. doi: 10.1126/science.1214652. [DOI] [PubMed] [Google Scholar]
- 9.Muckli L., Petro L.S. Network interactions: non-geniculate input to V1. Curr. Opin. Neurobiol. 2013;23:195–201. doi: 10.1016/j.conb.2013.01.020. [DOI] [PubMed] [Google Scholar]
- 10.Mumford D. On the computational architecture of the neocortex. II. The role of cortico-cortical loops. Biol. Cybern. 1992;66:241–251. doi: 10.1007/BF00198477. [DOI] [PubMed] [Google Scholar]
- 11.Park H.J., Friston K. Structural and functional brain networks: from connections to cognition. Science. 2013;342:1238411. doi: 10.1126/science.1238411. [DOI] [PubMed] [Google Scholar]
- 12.Friston K. A theory of cortical responses. Philos. Trans. R. Soc. Lond. B Biol. Sci. 2005;360:815–836. doi: 10.1098/rstb.2005.1622. [DOI] [PMC free article] [PubMed] [Google Scholar]
- 13.Phillips W.A., Clark A., Silverstein S.M. On the functions, mechanisms, and malfunctions of intracortical contextual modulation. Neurosci. Biobehav. Rev. 2015;52:1–20. doi: 10.1016/j.neubiorev.2015.02.010. [DOI] [PubMed] [Google Scholar]
- 14.Smith F.W., Muckli L. Nonstimulated early visual areas carry information about surrounding context. Proc. Natl. Acad. Sci. USA. 2010;107:20099–20103. doi: 10.1073/pnas.1000233107. [DOI] [PMC free article] [PubMed] [Google Scholar]
- 15.Van de Moortele P.F., Auerbach E.J., Olman C., Yacoub E., Uğurbil K., Moeller S. T1 weighted brain images at 7 Tesla unbiased for Proton Density, T2∗ contrast and RF coil receive B1 sensitivity with simultaneous vessel visualization. Neuroimage. 2009;46:432–446. doi: 10.1016/j.neuroimage.2009.02.009. [DOI] [PMC free article] [PubMed] [Google Scholar]
- 16.De Martino F., Zimmermann J., Muckli L., Ugurbil K., Yacoub E., Goebel R. Cortical depth dependent functional responses in humans at 7T: improved specificity with 3D GRASE. PLoS ONE. 2013;8:e60514. doi: 10.1371/journal.pone.0060514. [DOI] [PMC free article] [PubMed] [Google Scholar]
- 17.Blinder P., Tsai P.S., Kaufhold J.P., Knutsen P.M., Suhl H., Kleinfeld D. The cortical angiome: an interconnected vascular network with noncolumnar patterns of blood flow. Nat. Neurosci. 2013;16:889–897. doi: 10.1038/nn.3426. [DOI] [PMC free article] [PubMed] [Google Scholar]
- 18.Douglas R.J., Martin K.A. Mapping the matrix: the ways of neocortex. Neuron. 2007;56:226–238. doi: 10.1016/j.neuron.2007.10.017. [DOI] [PubMed] [Google Scholar]
- 19.Markov N.T., Kennedy H. The importance of being hierarchical. Curr. Opin. Neurobiol. 2013;23:187–194. doi: 10.1016/j.conb.2012.12.008. [DOI] [PubMed] [Google Scholar]
- 20.Raichle M.E. Neuroscience. The brain’s dark energy. Science. 2006;314:1249–1250. [PubMed] [Google Scholar]
- 21.Raichle M.E. The restless brain. Brain Connect. 2011;1:3–12. doi: 10.1089/brain.2011.0019. [DOI] [PMC free article] [PubMed] [Google Scholar]
- 22.Clavagnier S., Falchier A., Kennedy H. Long-distance feedback projections to area V1: implications for multisensory integration, spatial awareness, and visual consciousness. Cogn. Affect. Behav. Neurosci. 2004;4:117–126. doi: 10.3758/cabn.4.2.117. [DOI] [PubMed] [Google Scholar]
- 23.Dehaene S., Changeux J.P. Experimental and theoretical approaches to conscious processing. Neuron. 2011;70:200–227. doi: 10.1016/j.neuron.2011.03.018. [DOI] [PubMed] [Google Scholar]
- 24.Markov N.T., Ercsey-Ravasz M., Van Essen D.C., Knoblauch K., Toroczkai Z., Kennedy H. Cortical high-density counterstream architectures. Science. 2013;342:1238406. doi: 10.1126/science.1238406. [DOI] [PMC free article] [PubMed] [Google Scholar]
- 25.Mumford D. On the computational architecture of the neocortex. I. The role of the thalamo-cortical loop. Biol. Cybern. 1991;65:135–145. doi: 10.1007/BF00202389. [DOI] [PubMed] [Google Scholar]
- 26.Logothetis N.K. What we can do and what we cannot do with fMRI. Nature. 2008;453:869–878. doi: 10.1038/nature06976. [DOI] [PubMed] [Google Scholar]
- 27.De Martino F., Moerel M., Xu J., van de Moortele P.F., Ugurbil K., Goebel R., Yacoub E., Formisano E. High-resolution mapping of myeloarchitecture in vivo: localization of auditory areas in the human brain. Cereb. Cortex. 2014 doi: 10.1093/cercor/bhu150. Published online July 3, 2014. [DOI] [PMC free article] [PubMed] [Google Scholar]
- 28.Goense J., Merkle H., Logothetis N.K. High-resolution fMRI reveals laminar differences in neurovascular coupling between positive and negative BOLD responses. Neuron. 2012;76:629–639. doi: 10.1016/j.neuron.2012.09.019. [DOI] [PMC free article] [PubMed] [Google Scholar]
- 29.Koopmans P.J., Barth M., Orzada S., Norris D.G. Multi-echo fMRI of the cortical laminae in humans at 7 T. Neuroimage. 2011;56:1276–1285. doi: 10.1016/j.neuroimage.2011.02.042. [DOI] [PubMed] [Google Scholar]
- 30.Polimeni J.R., Fischl B., Greve D.N., Wald L.L. Laminar analysis of 7T BOLD using an imposed spatial activation pattern in human V1. Neuroimage. 2010;52:1334–1346. doi: 10.1016/j.neuroimage.2010.05.005. [DOI] [PMC free article] [PubMed] [Google Scholar]
- 31.Olman C.A., Harel N., Feinberg D.A., He S., Zhang P., Ugurbil K., Yacoub E. Layer-specific fMRI reflects different neuronal computations at different depths in human V1. PLoS ONE. 2012;7:e32536. doi: 10.1371/journal.pone.0032536. [DOI] [PMC free article] [PubMed] [Google Scholar]
Associated Data
This section collects any data citations, data availability statements, or supplementary materials included in this article.