Abstract
Recent advances in next-generation sequencing technologies require alignment algorithms and software that can keep pace with the heightened data production. Standard algorithms, especially protein similarity searches, represent significant bottlenecks in analysis pipelines. For metagenomic approaches in particular, it is now often necessary to search hundreds of millions of sequence reads against large databases. Here we describe mBLAST, an accelerated search algorithm for translated and/or protein alignments to large datasets based on the Basic Local Alignment Search Tool (BLAST) and retaining the high sensitivity of BLAST. The mBLAST algorithms achieve substantial speed up over the National Center for Biotechnology Information (NCBI) programs BLASTX, TBLASTX and BLASTP for large datasets, allowing analysis within reasonable timeframes on standard computer architectures. In this article, the impact of mBLAST is demonstrated with sequences originating from the microbiota of healthy humans from the Human Microbiome Project. mBLAST is designed as a plug-in replacement for BLAST for any study that involves short-read sequences and includes high-throughput analysis. The mBLAST software is freely available to academic users at www.multicorewareinc.com.
Keywords: BLAST, mBLAST, algorithm, performance, sequence alignments, acceleration
Introduction
Recent advances in next-generation sequencing (NGS) platforms [1] have made it possible to produce sequence data in vastly larger volumes and at a fraction of earlier costs. These NGS technologies have resulted in exponential growth of sequence data, outpacing the long-term trend of computers to double in speed every 18 months (Moore’s law). This has led to the cost of compute infrastructure necessary to perform analytical processing being a limiting factor in several areas of genomics research. Sequence data by itself provides little information, and analysis is critical for creating knowledge. The most important analytical process is comparison of data to sequences with known molecular properties. This task is computationally complex, but algorithms capable of performing this type of database comparison such as the Basic Local Alignment Search Tool (BLAST; [2,3]) have been available for some time. Many variants of BLAST are also in use, with National Center for Biotechnology Information (NCBI) BLAST and WU-Blast [4] being the most popular. These programs have been optimized for over a decade and have become the de-facto standard for benchmarking comparisons in the bioinformatics industry.
The BLAST package of algorithms contains 4 major categories: nucleotide, protein, translated and special. Each of these has sub-components. For example, the protein searches can be conducted with BLASTP, Psi-, Phi- or RPS-BLAST [5,6]. While the original BLAST program was well optimized for searching the individual sequence reads (strings) produced by 1990s technology, a single run on a current-generation sequencer now generates over 109 short read DNA sequence strings. Additionally, these must now be independently analyzed against a much larger data set of known sequences, which can be hundreds of gigabytes (or tens of billions of sequences) in size. A BLASTX or TBLASTX search of multiple sequence runs against GenBank databases thus requires substantial supercomputing resources. Considering that sequencing technology to emerge in the next one to two years will likely increase data output by yet more orders of magnitude, the importance of investment in optimized data analysis solutions to address the increasingly intractable problem of genomic sequence analysis becomes clear.
With that in mind, effort has been invested into developing ways to decrease the performance time of BLAST while still maintaining high sensitivity. Improvements on BLAST have included parallelized versions using threads on symmetric multiprocessor machines (though still limited due to the limited number of processors used); Hyper-blast achieved 12 times speed-up using inter-node parallelism and a specialized database partitioning method [7]; CloudBlast delivered 57 times speedup compared to the 52.4 of the publicly available mpiBlast [8]; Dynamic Blast on UABgrid resources showed 50% reduction in time [9] and because BLAST is highly parallel in nature, making it amenable to adaptation to a grid environment [10], researchers increasingly use larger grids to reduce the execution time of search jobs.
While these improvements in the execution time of BLAST are useful, there is still a considerable challenge for projects that produce terabase amounts of sequence data, where greater acceleration of BLAST execution is required. One such field that uses the technological breakthroughs associated with the decreased cost of DNA sequencing is metagenomics (e.g. [11,12]). Shotgun sequencing for metagenomic profiling of microbial communities and other complementary technologies (e.g. [13]) provides information not only on the organismal components (bacterial, viral, and eukaryotic) of a microbiome, but also on the whole gene content of the community, for example allowing description of the metabolic capacity of a community, or detection of genes of interest such as antibiotic resistances or virulence factors. For shotgun metagenomic analysis there is a need for deep sequencing of each specimen, in order to adequately sample the genomes of many different organisms, present at a wide range of abundance. This results in terabase-scale data sets that must be analyzed at the level of individual DNA sequence reads. Since the source organism is unknown in these experiments, searches are necessary against all known sequences from all candidate organisms, further compounding the computational challenge. While such experiments are still expensive, it is now possible, for example, to contemplate sequencing the organisms capable of living on or in the human body [14], a project many times more challenging than the human genome itself. It is also possible to sequence whole genomes from entire ecosystems living on plants, in soils and in underground hydrocarbon deposits and contaminated locations. However, data analysis is the most significant bottleneck in the ability to convert massive metagenomic data sets into sound scientific conclusions.
To address this analysis challenge, we set out to optimize BLAST for the latest multi-core CPUs, which as a hardware class have greatly increased in their performance and parallelism since the original BLAST algorithm was devised. The mBLAST package consists of mBLASTX, mBLASTP and mTBLASTX, which perform alignments similar to BLASTX, BLASTP and TBLASTX respectively (named for the BLAST programs they closely emulate with an additional prefix “m”, connoting a thousand-fold performance gain). According to our performance tests on an 8 node cluster system, the mBLAST suite of programs achieved a speed-up of several thousand fold, with both read- and gene-length queries, and only marginal reduction in sensitivity. The algorithm was used to successfully process over 3TB of microbial sequences from the Human Microbiome Project (HMP) [15,16]within the time boundaries of the project. The datasets used for estimating speed-up and performance evaluation were from the HMP however the algorithm can be applied to any sequence data used for protein-level comparison to databases.
Materials and Methods
Hardware configuration
The computer used for NCBI blast time benchmarks was a Dell M610 blade with 2 × quad-core E5540 2.53Ghz CPUs (hyperthreading disabled), 48GB of RAM, and 2× 300GB 10K RPM SAS drives striped in a RAID 0 configuration. The blade OS was Ubuntu 8.04 (kernel 2.6.28-11-server). The configuration of the machine used for mBLAST algorithms was a Dell PowerEdge M610 Blade with 2 × Intel Xeon quad core E5540 (2.53GHz) processors, 48 GB of RAM, 2 × 250 GB striped (RAID 0) hard drives (500 GB total), two 1 Gb/s Broadcom network interface cards (only one of them was actually connected to the network for a total of 1Gb/s) and running Ubuntu LTS 10.04 and LSF 7.04. The algorithms were also directly compared on different server class machines (with very similar specifications) at the University of Illinois with very closely comparable results.
Each BLAST job was repeated 3 times and the average time is used as the standard for comparison. NCBI BLAST 2.2.22+ was used for all the benchmarks by strictly controlling the number of cores (1 core) with the most sensitive parameter sets. Between each run we cleared out the cached memory on the test blade (as processes are run on the blades, the Linux kernel will attempt to cache data in memory to avoid having to read it from disk).
Comparison of read level protein searches
Illumina reads from a metagenomic sample were mapped to a set of Roche-454 pyrosequencing reads from the same sample using BLAT [17], with a cut off of 95% identify over 90% of the Illumina read. Mapping to KEGG version 58 [18] was used for selecting pyrosequences reads, requiring an alignment e-value of at least 1e-05 to be considered a hit. For each of 1,000 randomly selected Roche-454 reads that hit KEGG, we selected 100 random Illumina reads with significant sequence matches as representative data for comparing BLASTX hits of both sequence datasets. The Illumina read hits were parsed using 1e-05 and the Roche/454 pyrosequence hits were parsed using 35 bits and 55 % identity.
Running mBLASTX
To execute an mBLASTX alignment you first must pre-generate a neighborhood matrix from the scoring matrix you plan to use (this resource is pre-generated for the default BLOSUM62 matrix). Then you need to create a set of accelerated data files for the reference. Once these files are created for a specific scoring matrix and/or reference they can be used repeatedly. These steps are only needed the first time you use a new subject database.
MNeighborGen is used to generate the neighborhood matrix (for details see Supplementary File 1). The program MHashGen builds the accelerated data files for the reference, (for details see Supplementary File 2).
The mBLAST software package includes mBLASTX, mTBLASTX and mBLASTP for aligning translated nucleotide queries to a protein database, translated queries to a translated nucleotide database and protein queries to a protein database respectively. For proper usage of these tools along with a full description of available parameters and their function see Supplementary File 3 and Supplementary File 4.
iBLASTX
To evaluate the effects of optimizations on sensitivity, a program called inverseBLASTX (iBLASTX) was developed. In iBLASTX, the following notation is used: Q is the set of queries (in the case of BLASTX, a set of strings of nucleotide sequences), R is the set of references (in the case of BLASTX, the reference database of proteins used was NR), S is the set of seeds and neighbors that are candidates for extension, H is the space of High Scoring Pairs (HSP) (the output of BLASTX that identifies the alignments), U is the function that extends the seeds, calculates E-values, and then compares against the statistical E-values to identify the alignments H. With this notation, BLASTX can be described as follows: H=U(S(P1, P2,,…, PM) (Q)) where Pi are the parameters and M is the number of parameters. mBLASTX can be described in exactly the same terms. Note that the transformation, U, which follows the seed finding stage, is essentially the same in BLASTX and mBLASTX.
In order to identify the correct settings of the parameters Pi, a sequential search of the parameter space (which would be otherwise computationally intractable itself) is conducted using iBLASTX to identify the (P1, P2,…, PM) so that at least 98% of the HSPs in H are present in H. For each common HSP in H and H, iBLASTX identifies the seed(s) in S, which would result in that HSP when subjected to transformation U. For each value of a parameter, it identifies whether this HSP would be output by mBLASTX or not and creates a histogram of the loss of sensitivity of mBLASTX vs. BLASTX for various values of the parameter. After identifying the values of the parameter for which the sensitivity is maintained, iBLASTX modifies the next parameter using the previously chosen parameter at that fixed value.
Comparison of BLASTX against mBLASTX
The input query used for this comparison is a random set of 100 bp Illumina reads obtained from the SRA sample SRS015890. A subset of queries with various sizes were randomly picked from a database containing 16,595,429 queries and used for testing mBLASTX. These 16.5 million queries were derived from a 20,599,707 sequence dataset that was screened for human contaminants, redundancy (100% identity over 100% length) and reads containing N, resulting in a 1.2 Gb database consisting of 2,482,697 proteins. Three distinct dataset sizes were chosen to address specific questions. A small dataset with 1000 reads was selected as a set of reads that can be processed in 5–10 mins, therefore appropriate for the quick testing of the correctness of the mBLAST algorithm and its sensitivity/specificity to NCBI BLASTX. The medium dataset consisted of 5,000 reads and it was designed to finish overnight with NCBI BLASTX. This set was aimed to provide comparisons of the algorithm on medium size sets. The large dataset of 100,000 reads was prepared to gauge the time performance of the datasets in addition to specificity comparisons. The program was also extensively tested on even larger datasets such consisting of 1 million and 20 million queries to analyze its memory handling capability and optimal time performance. Such large datasets have a very high run cost with NCBI BLAST algorithms, hence direct comparisons were not possible with datasets over 1 million.
The BLASTX alignments were generated using the NCBI-blastx-2.2.22+ with the following command ‘blastxplus -db All_annodb.faa -query <input> -word_size 3 -threshold 14 -seg no -num_descriptions 10 -num_alignments 10 -out <output>’. Top 10 hits that have an e-value of 1e-5 or lower were then parsed using a custom Perl script to obtain results for convenient comparison. The mBLASTX results were generated using mBLASTX Version 1.1.05 02/24/2011 (Linux) with the following command line ‘mblastx -m 32 -q <input> -d <data directory containing the mhashgen hash files for the database> -o <output>’. The sensitivity and specificity of both algorithms were then compared by calculating the number of queries hit, common queries that have hits in both, queries that do not have hits in both, number of unique hits in each of the outputs and number of hits shared by both using a Perl script. The following criteria were used for considering hits found by both algorithms: a) Same query hitting the same subject - top blastx hit present in top "n" mblastx hits where n = 1,5,10 and 32; b) The subject in the alignments are in the same frame; c) The start and stop positions of the hit in the subject should be within +/−10 positions.
For the pathway module analysis the KEGG modules that represent modular functional units of the KEGG pathways [18] were used. Module coverage was calculated through HUMAnN [19] from MBLASTX alignments against the KEGG genes database(version 58) with top 20 hit and e-value of 1. Modules that were covered at 90% or higher in 90% of the samples in each body site were identified and plotted. Only modules with at least 4 genes were considered. In total 624 samples were analyzed (stool 137 samples, posterior fornix 53, buccal mucosa 109, anterior nares 87, supragingival plaque 115 and tongue dorsum 123)[16].
Comparison of TBLASTX against mTBLASTX
The database used for TBLASTX alignments for the virus detection pipeline included sequences from human and microbial genomes (bacteria, archaea, small eukaryota, virus and bacteriophage). The subject database included all sequences in NCBI NT, not just complete genomes (sequences 297,590, size 8.6 Gb), in order to incorporate as much diversity as possible. The query sequence was obtained from a plasma sample from a febrile child. Total nucleic acids were extracted from the sample, RNA was reverse transcribed, and the cDNA and DNA were amplified. We derived our methods for cDNA synthesis and amplification from [20,21]. Ungapped mTBLASTX results were compared to TBLASTX results, both parsed at 1e-5 (mTBLASTX top 32 results, TBLASTX also top 32) using Perl scripts and was used to generate the sensitivity report using the following criteria: a) Same query hitting the same subject - top TBLASTX hit present in top "n" mTBLASTX hits where n = 1, 5, 10 and 32; b) The query in the alignments are in the same frame; c) The subject in the alignments are in the same frame; d) The start and stop positions of the hit in the subject should be within +/−30% of the TBLASTX alignment length.
For the virus detection analysis we obtained Illumina GAIIX sequences that had been generated from plasma samples collected from febrile children ([22]; Acc. No: SRR057960, SRR057863, SRR057962, SRR057864, SRR057938, SRR057831, SRR057939 and SRR057832). A nucleotide database was made from all of the viral entries in NT, downloaded on October 10, 2011. Database sequences that were less than 100 basepairs were removed. Illumina GAIIX sequences were aligned to this database using mTBLASTX with the following parameters: -f T –t 26 –Z 5 –X 7 –Y 20 –M 40 –T 64 –m 6 –I 50 –e 1.0E-03. Output was parsed to retain alignments with greater than 70% identity for further analysis. The database was translated into 6 frames for mBLASTX alignments using transeq [23] with the following parameters: -frame 6 -table 0 –trim. Illumina sequences were aligned to the translated reference database using mBLASTX with the same parameters and parsing conditions described above for mTBLASTX. For comparison, nucleotide sequence alignments were carried out using BLASTN using the following parameters: --repeat-freq 97% -e 10% -U –T 4 –w 15 –-top-random –read-names –penalize-unknowns.
Comparison of BLASTP against mBLASTP
The input queries used for this comparison are the proteins deduced from genes predicted on the scaffolds from the metagenomic assembly of SRA sample SRS013215 (available at: ftp://public-ftp.hmpdacc.org/HMHASM/assemblies/SRS013215.scaffolds.fa.gz). The database used was uniref100 DB (version 11/30/2010; 11,465,597 sequences, size 5Gb). The BLASTP alignments were generated using the command 'blastall -v 20 -b 20 -X 15 -e 1e-5 -M BLOSUM62 -J F -K 10 -f 11 -Z 25.0 -W 3 -U F -I F -E -1 -y 7.0 -G -1 -A 40 -Y 0.0 -F "T" -g T -p blastp -z 1702432768 -m 7'. Top 20 hits were parsed in the btab format. The mBLASTP results were generated using mBLASTP version 1.4.0 01/27/2011 (Linux) with the following command line (30 % identity of HSP), 'mblastp -F S -t 22 -Z 2 -X 5 -Y 42 -d <data directory containing the mhashgen hash files for the database> -q <input>'. The sensitivity and specificity was calculated similar to the BLASTX vs. mBLASTX comparison, using internal Perl scripts. The criteria for considering hits found by both algorithms were: a) Same query hitting the same subject - top blastp hit present in top "n" mblastp hits where n = 1, 5, 10 and 32; b) The subject in the alignments are in the same frame; c) The start and stop positions of the hit in the subject should be within +/−20% of the blastp alignment length.
Results
Read length and alignment sensitivity
Read lengths vary considerably on different sequencing platforms, from less than 100 to over 1,000 bases per read. Two of the major platforms are Illumina, with (at the time of performing our analysis tests) a standard read length of 100 bp, and Roche-454 with reads that average around 400 bases. Illumina has advantages over Roche-454 in producing more reads per run at a lower cost and higher accuracy. In some cases, however, the shorter Illumina reads provide less information for database alignments than Roche-454 data. To examine the differences in using Illumina reads or longer Roche-454 reads, we compared alignments to a common reference database from both sets of data. 1,000 Roche-454 reads and 100 Illumina reads that mapped to each were randomly selected from a metagenomic DNA sample collected from human stool (available in the NCBI Short Read Archive under the accession no. SRS015890) as representative data to allow a direct comparison between the two technologies. Each of these sets were aligned to the KEGG database [18], and the hits from the Roche-454 reads were compared to the hits of the 100 corresponding Ilumina reads. In 90% of the cases, the same KO (KEGG ortholog) annotation was obtained from corresponding sets of Roche-454 and Illumina reads. False negative rate, defined as KOs hit only by the Roche/454 but not Illumina reads, was estimated to be 12% (117/1,000). False positive rate, defined as the Illumina reads that hit additional or different KOs than the Roche-454 reads, was 8% (84/1,000). We thus concluded that the lower cost of sampling with 100 bp Illumina reads does not sacrifice the sensitivity seen with longer read lengths. We have thus focused on accelerating BLAST for use with Illumina data, which is expected to pose the biggest challenge.
Optimization of BLASTX
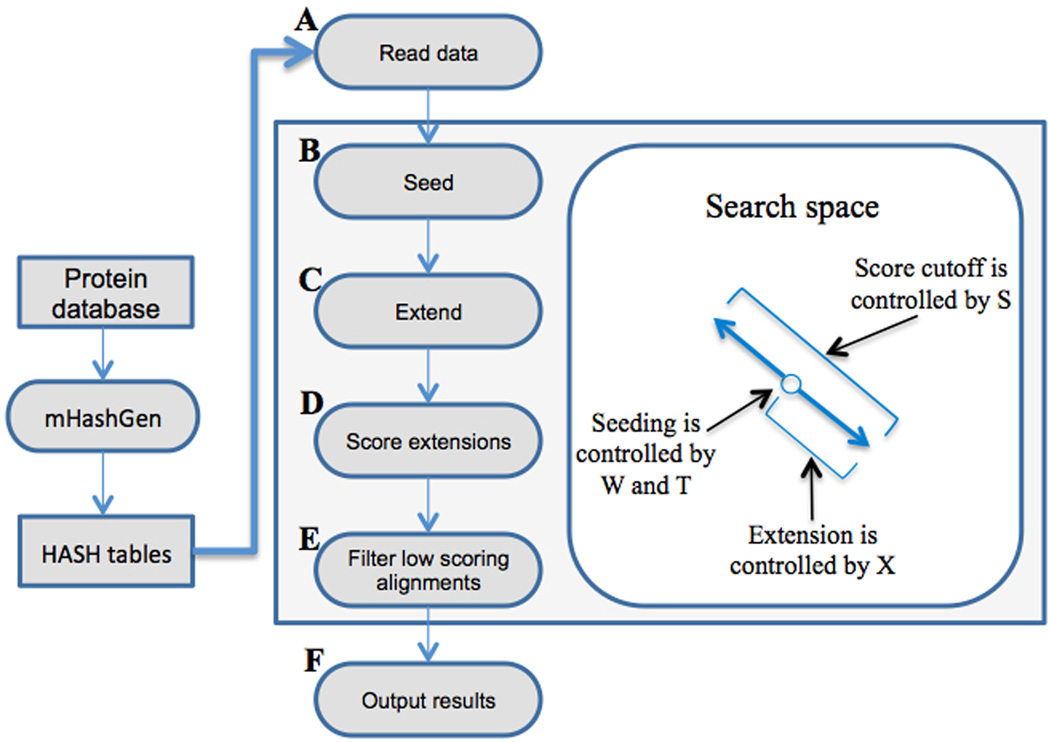
The BLAST algorithm can be divided into six stages (Figure 1, A–F). The seeding step (B) finds and marks the locations of short sequences of length W (word size) in the queries and reference strings that are either identical or are neighbors, i.e., whose score when computed using a substitution matrix such as the Blosum62 matrix [24] is above a certain T (threshold) value. Finding seeds is a critical aspect of the BLAST algorithm. By identifying the “right” seeds, i.e., the ones that result in sought-after alignments, and reducing the number of “wrong” or unproductive seeds at this step, the number of computations can be reduced dramatically. In the extension step (C), alignments are generated from the seeds. When the critical parameter controlling extensions, X (drop-off score), is set too low, the alignments terminate after only a few mismatches have been found, while high values of X allow alignments to continue through dissimilar regions. In the evaluation step, alignments are compared to an E-value threshold to identify alignments that are statistically relevant. The combination of these parameters (W, T, X) has a significant effect on the speed and sensitivity (S, score) of BLAST searches.
Figure 1.
The processing steps in the mBLASTX workflow. The database is first indexed using the mHashGen module and these index files are used in the alignment process. The query files are reads (A) and matching seeds between the queries and subjects are identified (B). These matches are then extended to high scoring segment pairs (C). These extensions are evaluated (D) and only significant alignments are kept (E) and displayed in the output (F).
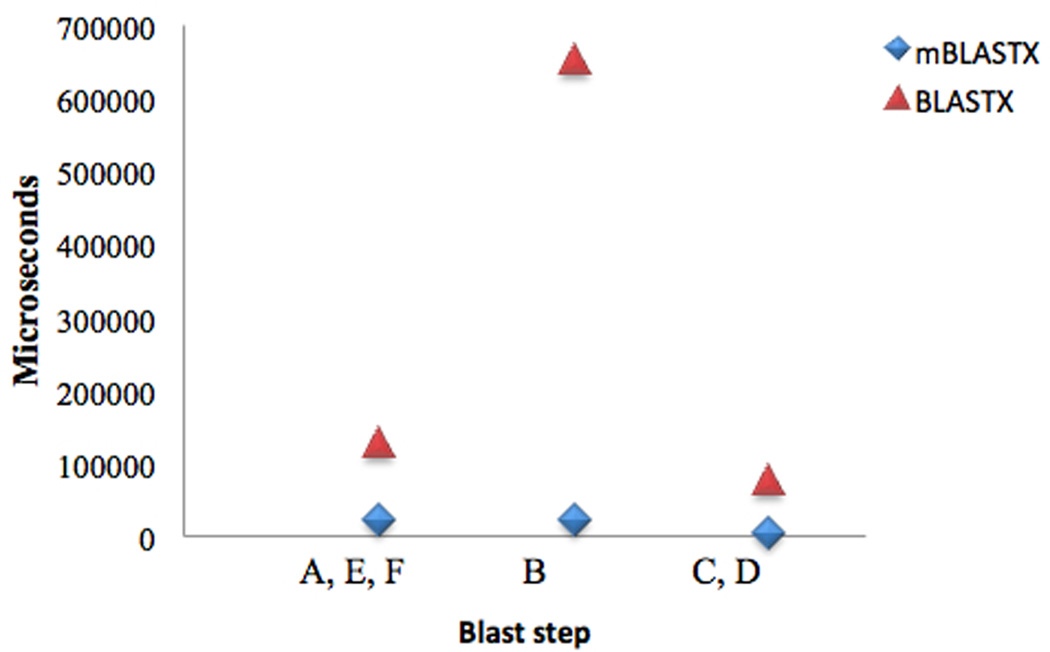
Our BLAST time benchmarks were performed on dedicated systems with hardware configuration specified in three replicates (see Methods). An average total time per query (of 100 bp length) against the NR database for NCBI’s BLASTX using default parameters is 828 milliseconds (ms). The “finding seeds” step (B) consumed 654 ms of the processing time, while 46 ms was spent in extension (C) and scoring (D) steps, and 128 ms was required for loading and writing data (steps A & F), and for identifying the highest scoring alignments (E) (Figure 2). For a data analyst to be able to keep up with NGS data production one would need at least a 1,000× reduction in processing time per query, i.e., to go from 828 ms to less than 828 microseconds (µs) per query, therefore it was necessary to significantly reduce computational time at each step of the process. Seed finding was investigated first because it was the lengthiest stage, and moreover, reducing the number of seeds sent to later stages of the pipeline would also reduce subsequent extension computations considerably, allowing for early elimination of insignificant alignments.
Figure 2.
Timing per BLAST phases and X-factor speed-up. The BLAST steps on the x-axis are defined as: read data (A), seed (B), extend (C), score extensions (D), filter low scoring alignments (E), output results (F),.
Optimization of the Seeds in mBLASTX
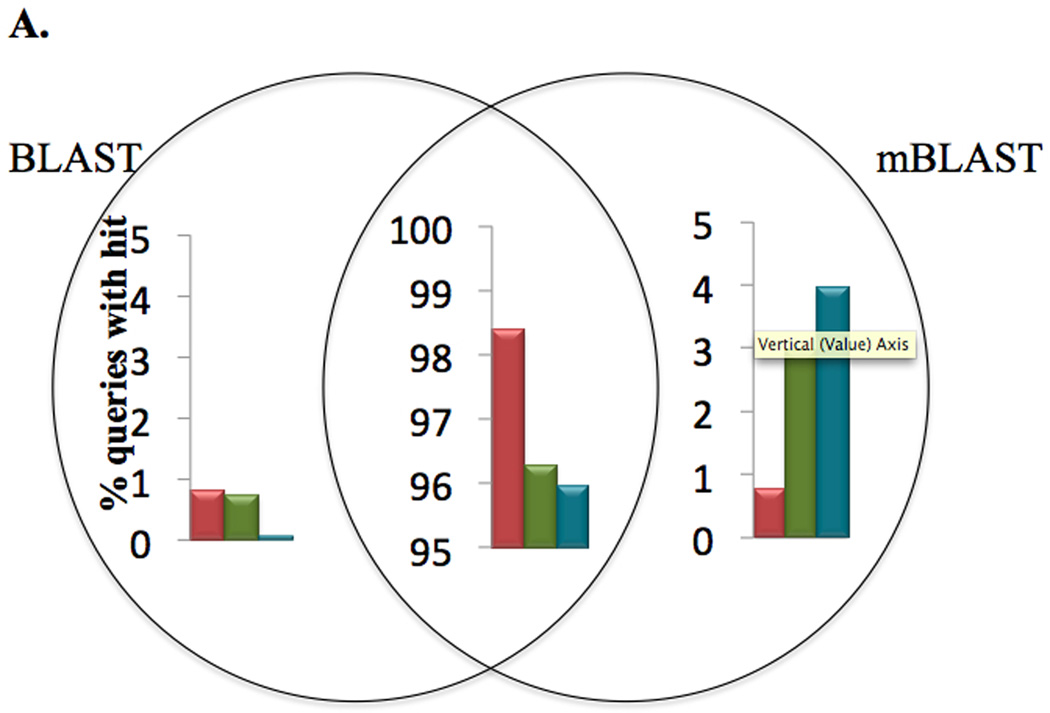
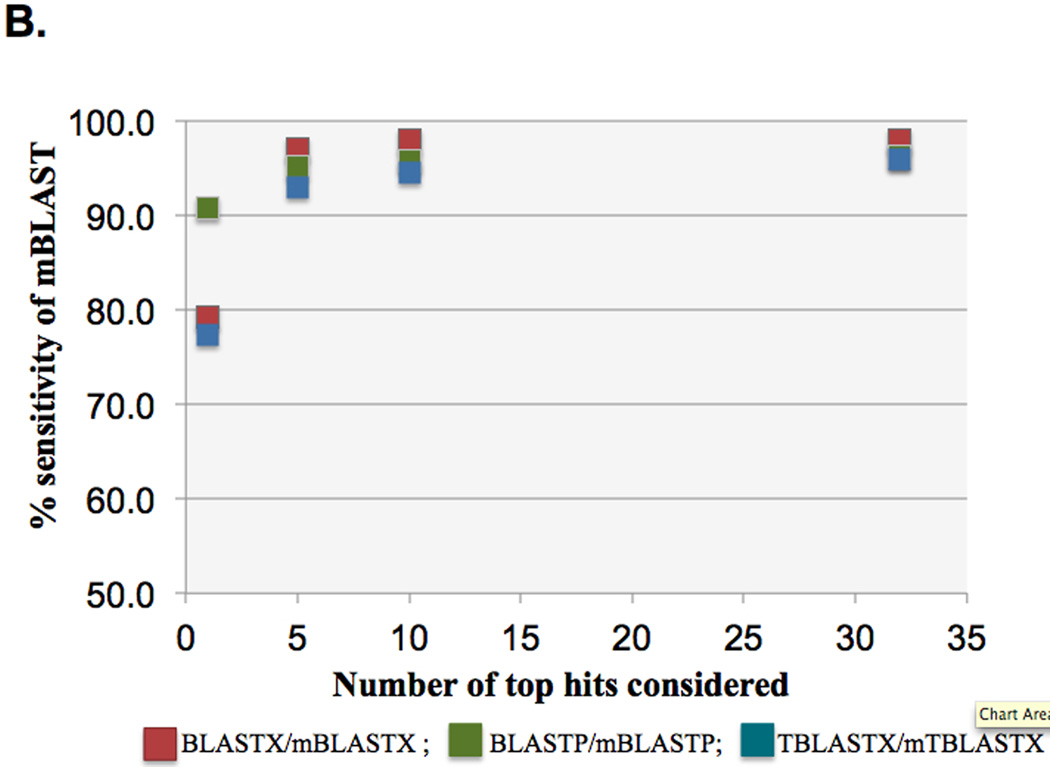
We reduced the number of seeds that are present in the seed finding stage by increasing the seed size parameter W. By increasing W we potentially missed some local alignments that BLASTX finds, however, that was offset by decreasing the size of the parameter T, which increases the number of neighbors that each seed has. iBLASTX was used to evaluate the interrelationship between the parameter set, (W, T), and the strength of the hits and missed hits. The sensitivity target was set as greater than 98%, i.e. 98% of the HSPs in H of BLASTX should be present in the output H of mBLASTX. False positives (i.e., alignments that were found by mBLASTX and not found by BLASTX) were less than 1% (Figure 3A), compared to BLASTX alignments used as the gold standard, and found to contribute to better downstream utilization of the HSP results. Increasing the number of top hits (N) of mBLASTX increased the overall sensitivity compared to the BLASTX algorithm (Figure 3B).
Figure 3.
Sensitivity of mBLAST compared to NCBI BLAST algorithms. (A) Distribution of queries for each of the three mBLAST programs against the respective BLAST program. Percentage of queries that are shared, or unique to either BLAST and mBLASTX are shown. (B) Increasing the top n hits of mBLAST algorithms increases the overall sensitivity against the BLAST algorithms.
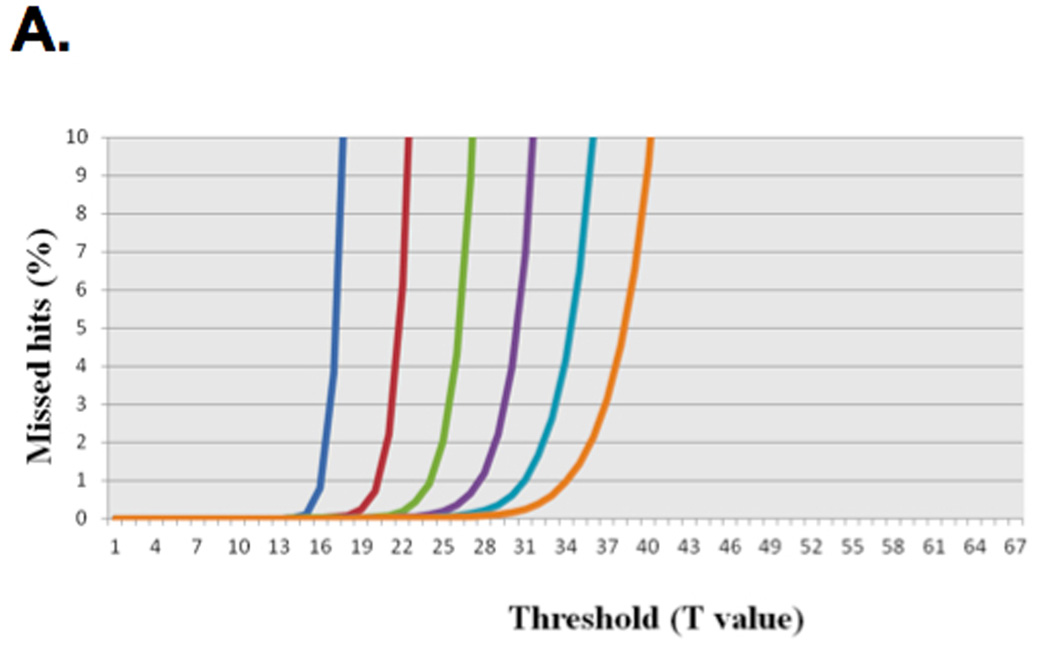
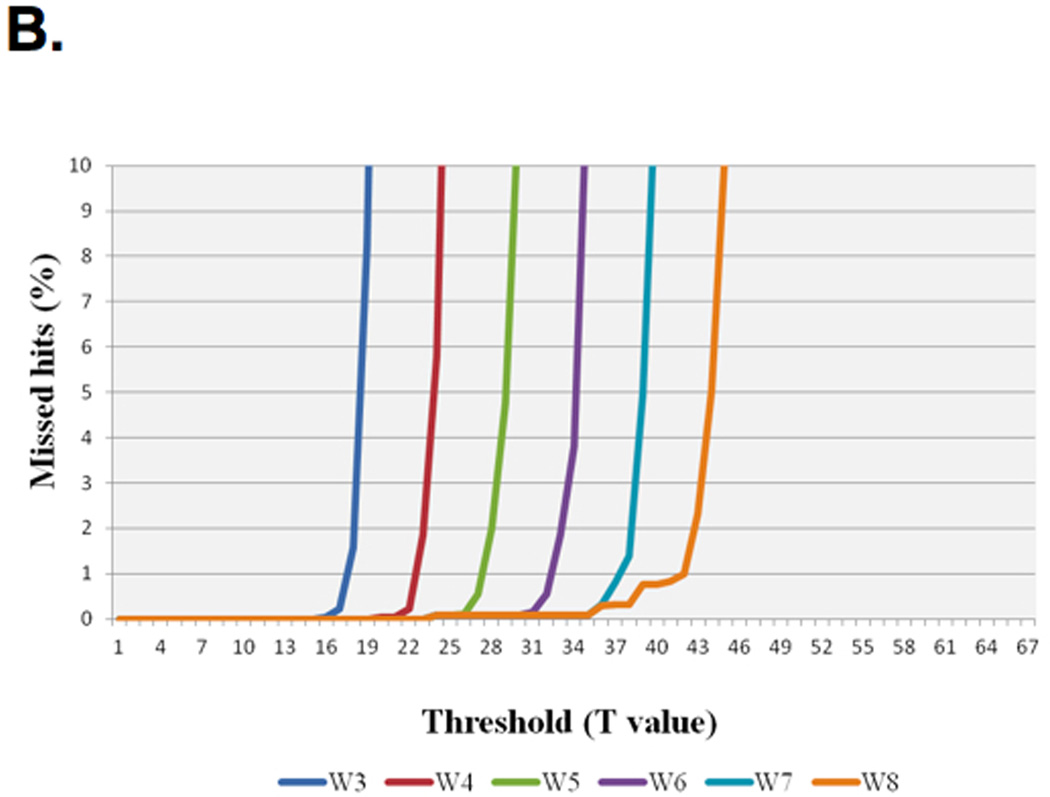
For example, a simplified version of this method for optimizing the parameter T while maintaining greater than 98% sensitivity follows: The queries that were used are Illumina reads of a whole genome shotgun (WGS) metagenomic sample with 100,000, 1,000,000 and 6,000,000 query sequences against a protein database. The reported data (Table 1) are derived from the set with 100,000 queries. Figure 4 (Single Seed (Hit) iBLASTX and various word sizes W with HSPs with at least 1e-05 E-value) shows a simplified version of iBLASTX where the effects of changing the W from 3 to 8 (W3, W8 respectively) are scanned, represented in the various curves with the impact of changing the threshold versus percentage of HSPs missed. This graph enables choosing the correct threshold per word size while retaining acceptably small loss of sensitivity. For example, W6 with T31 resulted in a loss of less than 1% of the HSPs (Figure 4). While using W6 with T29 and a less stringent match for the HSPs (cutoff of at least 23 positives out of 33 amino acids or more; data not shown) results in approximately the same percentage of missed HSPs, the first can be thought of as casting a smaller net for only the seeds of interest and results in significantly less work than W6 T29.
Table 1.
Sensitivity of mBLAST algorithms compared to BLASTa.
| Aligner | Queries with hits (BLAST) |
Queries with hits (mBLAST) |
Common queries (#) | Common queries (%) | Top blast within top n mBLAST matches (%)b |
|---|---|---|---|---|---|
| mBLASTX | 26,339 | 26,174 | 25,958 | 98.6 | 79.3 |
| 26,339 | 26,174 | 25,958 | 98.6 | 97.1 | |
| 26,339 | 26,174 | 25,958 | 98.6 | 97.9 | |
| 26,339 | 26,174 | 25,958 | 98.6 | 98 | |
| mTBLASTX | 94,920 | 99,844 | 94,849 | 99.9 | 77.3 |
| 94,920 | 99,844 | 94,849 | 99.9 | 92.9 | |
| 94,920 | 99,844 | 94,849 | 99.9 | 94.5 | |
| 94,920 | 99,844 | 94,849 | 99.9 | 96 | |
| mBLASTP | 35,713 | 35,739 | 35,451 | 99.3 | 90.8 |
| 35,713 | 35,739 | 35,451 | 99.3 | 95.2 | |
| 35,713 | 35,739 | 35,451 | 99.3 | 95.7 | |
| 35,713 | 35,739 | 35,451 | 99.3 | 96.3 |
For exact parameters used see Methods;
‘n’=1, 5, 10 or 32 mBLAST hits considered.
Figure 4.
Sensitivity of mBLASTX using different threshold (T) value. (A) Percentages of missed hits at different combinations of word (W) and threshold (T) values compared to BLASTX at E-value cut-off of 1e-05 are shown. (B) Percentages of missed hits at different combinations of word (W) and threshold (T) values compared to BLASTX at cut-off of cutoff of at least 23 positives out of 33 amino acids are shown.
In order to further reduce the workloads that do not result in an alignment, it is possible to add additional parameters to drop seeds that result in unlikely extensions. With these additional parameters, mBLASTX can be described as follows:
H=E(S(P1, P2,,,…, PM,, O1,, O2,…, ON)(Oj))
where Oj are the parameters and N is the number of new parameters. After completing the search for the parameters, iBLASTX does a similar sequential search of the thresholds for the new parameters Oj. This allows users of particular sets of queries and particular HSP acceptance criteria to find the set of parameters (P1, P2,,,…, PM,, O1,, O2,…, ON) to achieve the required sensitivity.
Several other optimizations were applied that did not impact the sensitivity of the search:
Repetitive building of accelerated data structures for the reference database. Frequently users need to run BLASTX for billions of queries against several different protein databases (e.g. NR, KEGG [25], UniRef [26], MetaCyc [27], Antibiotic resistance genes DB [28], transporter DB [29], CAZy [30], to name a few). Building of the accelerated data structure of the reference database was separated from the other steps, so that it would occur only once per database, using the mHashGen program (Figure 1). Adding these data structures significantly increased the size of the reference data, by a factor of 15. For example, the GenBank non-redundand protein (NR) database used as a standard contained about 3.4 billion amino acids, which required approximately 57 GB of disk space to store the accelerated data structure with additional filtering information. This data structure can easily be stored on disks, but is still too big to be processed simultaneously in servers with normal configurations. Therefore the subject database was split into 8 distinct parts of nearly the same size that could then be processed separately by servers with 32 GB (Gigabytes) of RAM memory. Building the accelerated data structure files for the NR database took around 2 hours. Since this process only happens once for the entire dataset of 500 billion queries, it only added 14 ns (nanoseconds) to the per query time. This time is within the measurement noise of the final per query time and was not included in estimating speed-up.
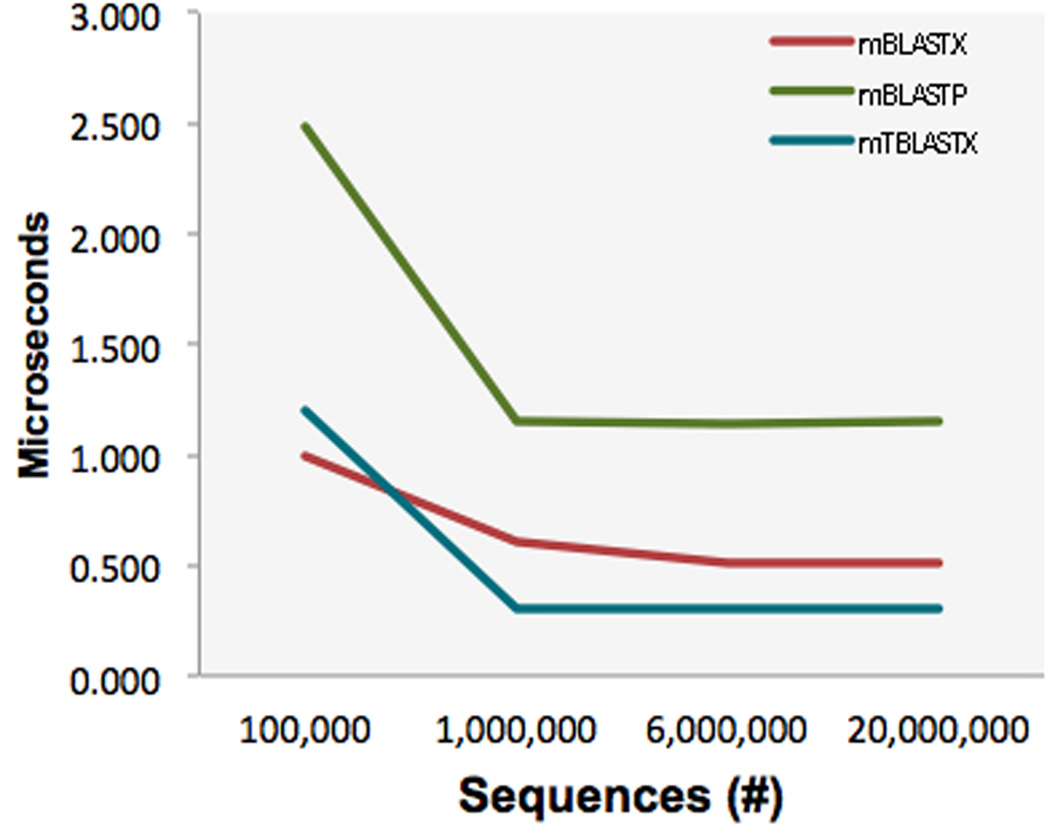
Creation of query batches of optimized size and streaming them in parallel through multiple CPU cores. We were able to process approximately 600 million amino acids in the same batch. By this means, redundant words in the batch need not be searched repeatedly, and thus the main gain in speed is not seen with a limited number of input sequences (Figure 5).
Avoidance of redundant extensions: Redundant extensions happen when multiple seeds map into the same extended region. This was eliminated by keeping track of all the extensions in an accelerated data structure and performing a lookup of this accelerated data structure prior to the execution of the extension step.
Trades-offs in favor of larger memory and disk spaces that are available on servers used for analysis: With larger RAM available on modern servers, accelerated data structures can be used to quickly access information. In addition, due to the highly ordered way that the data is being processed, it can be organized so that all queries are only streamed once.
Elimination of huge features lists supported in BLAST that impact performance: Many of the options in BLASTX resulted in additional checks within the key segments of execution that were eliminated in mBLASTX. Features that impacted speed but have a limited impact for the short-read queries we are focused on were thus either modified or dropped. These included our application of a simplified gapping strategy, dropping scoring refinement by adjusting the substitution matrix on a per query basis, and removing the low-complexity filtering programs SEG [31] or DUST [32] that are an integral part of BLAST. These had either an effect on a very small subset of queries or no impact on queries of 100 bp. Simplified gapping resulted in the biggest effect of these changes, a loss of around 0.1% of HSPs. Re-scoring usually resulted in no significant changes in bit scores for these short queries. For SEG/DUST low complexity filtering, this can still be applied in a pre-processing step, which is desirable for large datasets to both optimize compute time for query sets subject to multiple searches, and to enable more control over finding low complexity regions.
Avoidance of poor multi-threading: Pipelining and parallelizing work for this algorithm was achieved easily as no inter-dependencies exist between individual queries. A near-linear speedup was achieved as the number of cores was increased in the tested server configurations, up to 32 cores.
Figure 5.
The effect of varying the number of input sequences on the increase in speed of mBLAST. Higher number of input queries decreases the execute time per query until the speedup reaches a plateau at 1 million sequences.
Evaluating Performance of mBLASTX
The performance of mBLASTX was evaluated using 100bp Illumina reads against a database of proteins (see Methods). BLASTX with the typical parameters described above was treated as the golden standard. The 100bp shotgun metagenomic reads were screened to remove low complexity regions using the ‘DUST’ program [32]. Overall performance for an 8 core Intel Nehalem node with 32 GB of memory was approximately 1600 fold the performance of the exact same node running NCBI BLASTX on all 8 cores (Table 2, Figure 2). Performance benchmarks for mBLASTX were taken from one million to twenty million queries, where the average time per query was used for determining the acceleration factor (similar to NCBI BLASTX, see Methods). Most of the reduction in CPU time was derived from: a) database preprocessing, parallel query processing, dropping duplicate extensions and reduction in the number of seeds; these enabled a savings of ~699.74 ms; b) Reducing the feature list, pipelining I/O and parallelization. These optimizations are hard to quantify directly, but the remaining time saved by this class of optimization was approximately ~128.76 ms.
Table 2.
mBLAST algorithm performance on different computer architecturesa.
| mBLAST | Machine configuration | Queries | Time per query (ms) | x-factora | Memory | X-factor limit |
|---|---|---|---|---|---|---|
| mBLASTX | Small machine (Quad core Nehalem 12 GB) | 100,000 | 3.2 | 258 | 12 GB | Memory limited |
| 20,000,000 | 3.2 | 258 | 12 GB | Memory limited | ||
| Large machine (Dual socket-quad Nehalem core 48 GB memory) | 100,000 | 0.992 | 834 | 24 GB | Query limited | |
| 1,000,000 | 0.604 | 1370 | 32 GB | Query limited | ||
| 6,000,000 | 0.51 | 1623 | 48 GB | Query limit for 48 GB | ||
| 20,000,000 | 0.51 | 1623 | 48 GB | Memory limited | ||
| mTBLASTX | Small machine (Quad core Nehalem 12 GB) | 100,000 | 3.9 | 499 | 12 GB | Memory limited |
| 20,000,000 | 3.9 | 499 | 12 GB | Memory limited | ||
| Large machine (Dual socket-quad Nehalem core 48 GB memory) | 100,000 | 1.2 | 1623 | 24 GB | Query Limited | |
| 1,000,000 | 0.3 | 6490 | 32 GB | Memory limited | ||
| 6,000,000 | 0.3 | 6490 | 48 GB | Memory limited | ||
| 20,000,000 | 0.3 | 6490 | 48 GB | Memory limited | ||
| mBLASTP | Small machine (Quad core Nehalem 12 GB) | 100,000 | 9.4 | 94 | 12 GB | Memory limited |
| 20,000,000 | 9.3 | 95 | 12 GB | Memory limited | ||
| Large machine (Dual socket-quad Nehalem core 48 GB memory) | 100,000 | 2.5 | 357 | 24 GB | Query Limited | |
| 1,000,000 | 1.2 | 772 | 32 GB | Memory limited | ||
| 6,000,000 | 1.1 | 779 | 48 GB | Memory limited | ||
| 20,000,000 | 1.1 | 779 | 48 GB | Memory limited |
Large machine BLAST query procesing time was used to calculate x-factor: 828 msec for BLASTX, 888 msec for BLASTP and 1947 msec for TBLASTX.
Evaluating Sensitivities of mBLASTX
The sensitivity of mBLASTX was measured by comparing the highest scoring HSPs found for a set of 100,000 queries by NCBI BLASTX and mBLASTX on the KEGG database [18]. For this sensitivity measurement, the NCBI BLASTX was run with W3 T14 (recommended parameters for protein search based on [33]) and mBLASTX was run with W6 T26. A match is defined as the top HSP found by NCBI BLASTX also being found by mBLASTX with the same values for query and reference sequence offsets, length of the HSP and E-value. The criteria for considering overlapped hits between BLASTX and mBLASTX included: i) same query hitting the same subject – the top BLASTX hit can be any of ‘n’ top ranked mBLASTX hits where n =1, 3, 5, 10 or 32; ii) the subject sequence should be in the same frame in the alignment between BLASTX and mBLASTX; iii) the start and stop positions of the hit in the subject should be within +/− 10 residues for read level searches. For this set of queries and parameter setting, BLASTX found 26,339 top HSPs and mBLASTX found 26,174 matching HSPs – a sensitivity measurement of 98.6% (Table 1). For the above set of parameters, BLASTX runs at a pace of 828 ms/query while running 2 million queries, while mBLASTX runs at a pace of about 510 µs / query – a speedup of about 1,600× (Figure 2). HSPs missed by mBLASTX (Figure 3A) were a result of using larger words size with T26 (~0.46% of HSPs; 77% of missed HSPs) and missed gaps (~0.54% of HSPs; 23% of missed HSPs). The additional 216 HSP found by mBLASTX that were not top hits with BLASTX were a result of the lower average 3mer threshold of 13 vs. 14 used when performing protein searches (based on [33]).
This approach resulted in a dramatic performance gain in mBLASTX. The processing time per query dropped from 828 ms to 510 µs with a 98.6% sensitivity, saving 827.49 ms per query; 1,600 times faster and 0.6% above target sensitivity of 98% (Table 2; Figure 3A). Other advantages of mBLASTX include the ability to map millions of queries at a time (Figure 5), no database size limitations, no limit on the read/query length and an option to compress peptide strings in the output for a more manageable result file size.
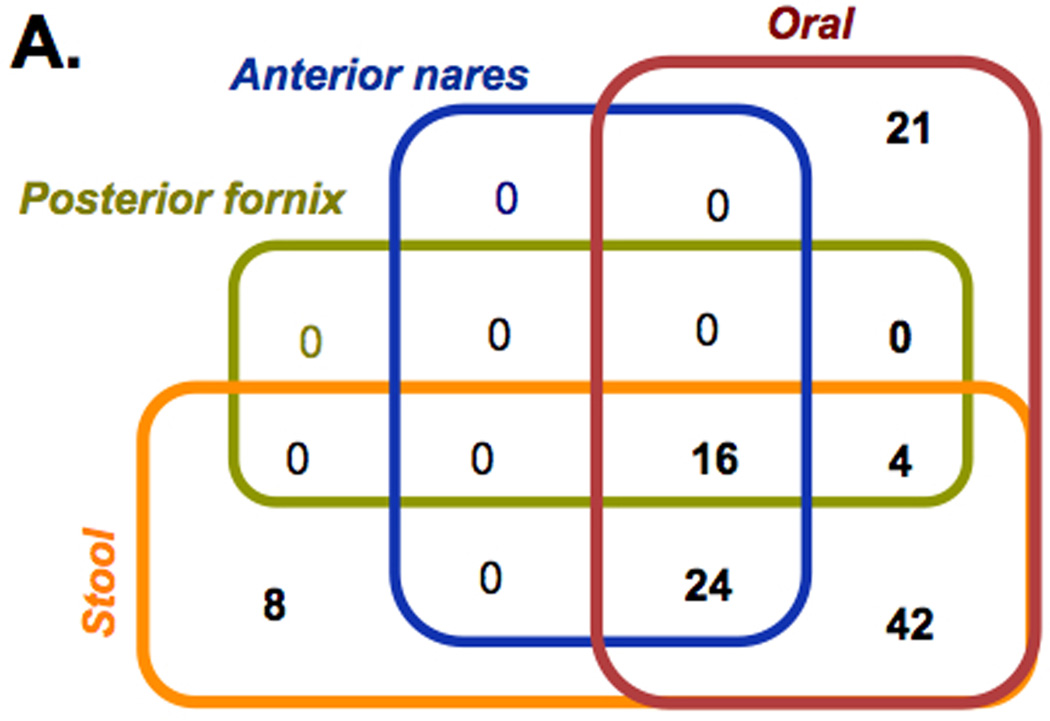
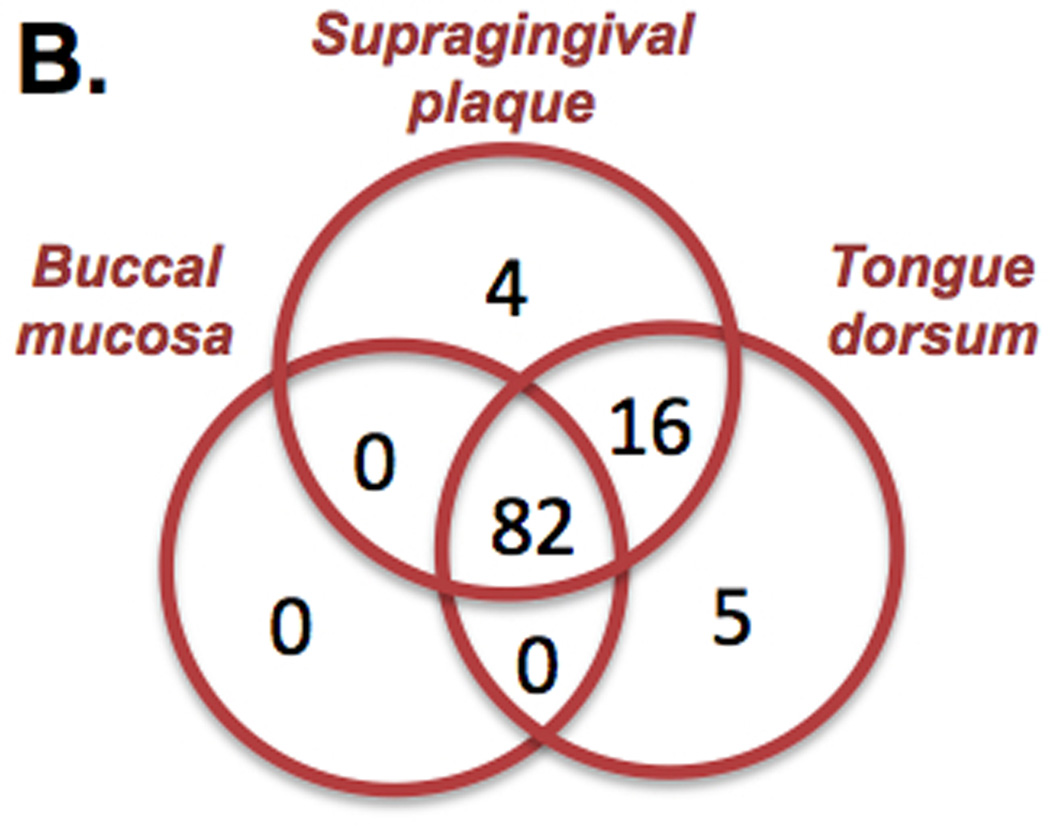
The performance and sensitivity obtained with mBLASTX enables performing metabolic reconstruction of metabolic capabilities of microbial communities at a read level in a time frame not possible before. The mBLASTX output generated when Illumina 100 base reads (microbiome samples from healthy humans) were searched against the KEGG database [18] provided a framework to compare functional diversity and organismal ecology in the human microbiome. For example, when microbiomes of 4 body regions are compared, a total of 115 metabolic modules are detected; of these 16 are ubiquitously present modules, and 42 are shared only among the digestive tract (i.e. oral cavity and stool; Figure 6A). Of the 107 metabolic modules within the oral cavity 82 were common to all Figure 6B, and the others were shared among two or unique to one oral cavity niche within the microbiome. When examining the pathway modules unique to a body site (for example the 4 modules unique to the supragingival plaque (M00012 Glyoxylate cycle, M00095 C5 isoprenoid biosynthesis, mevalonate pathway, M00117 Ubiquinone biosynthesis, prokaryotes, chorismate and M00326 RTX toxin transport system)), the results indicate that these modules are either absent in the buccal mucosa and the tongue dorsum, or alternative reactions are present because the coverage is lower than the required 100% (average 0.43% and 0.56% coverage of the modules for buccal mucosa and tongue dorsum, respectively). Metabolic capabilities of ~700 microbial communities (determined using mBLASTX) occupying 6 different body niches of healthy individuals and their associations with the environment are in details investigated in [34].
Figure 6.
Metabolic profiling of HMP samples. (A) Distribution of KEGG metabolic modules among 4 distinct body niches and (B) among 3 sites of the oral cavity. Only modules covered at 90% and present in 90% of the samples are considered. The overall analysis is based on 624 samples and the oral cavity analysis is based on 347 samples.
Evaluating performance of mTBLASTX
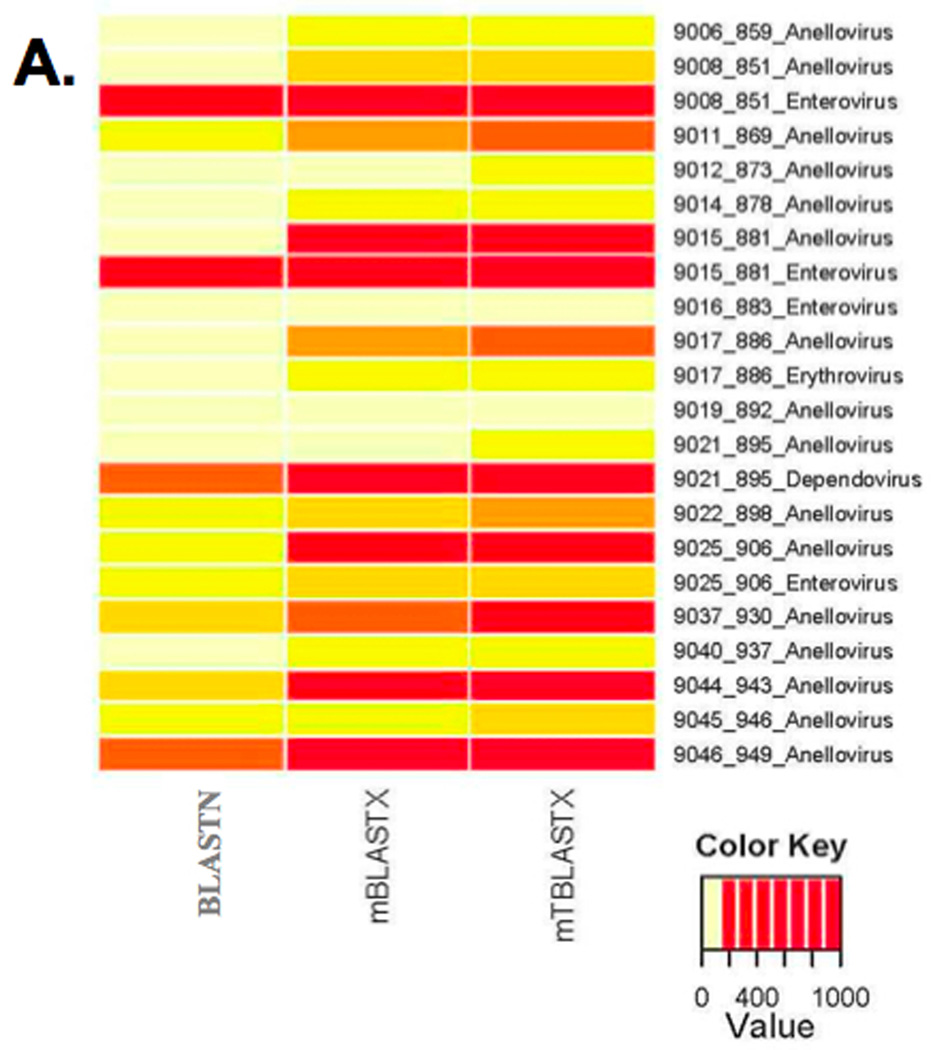
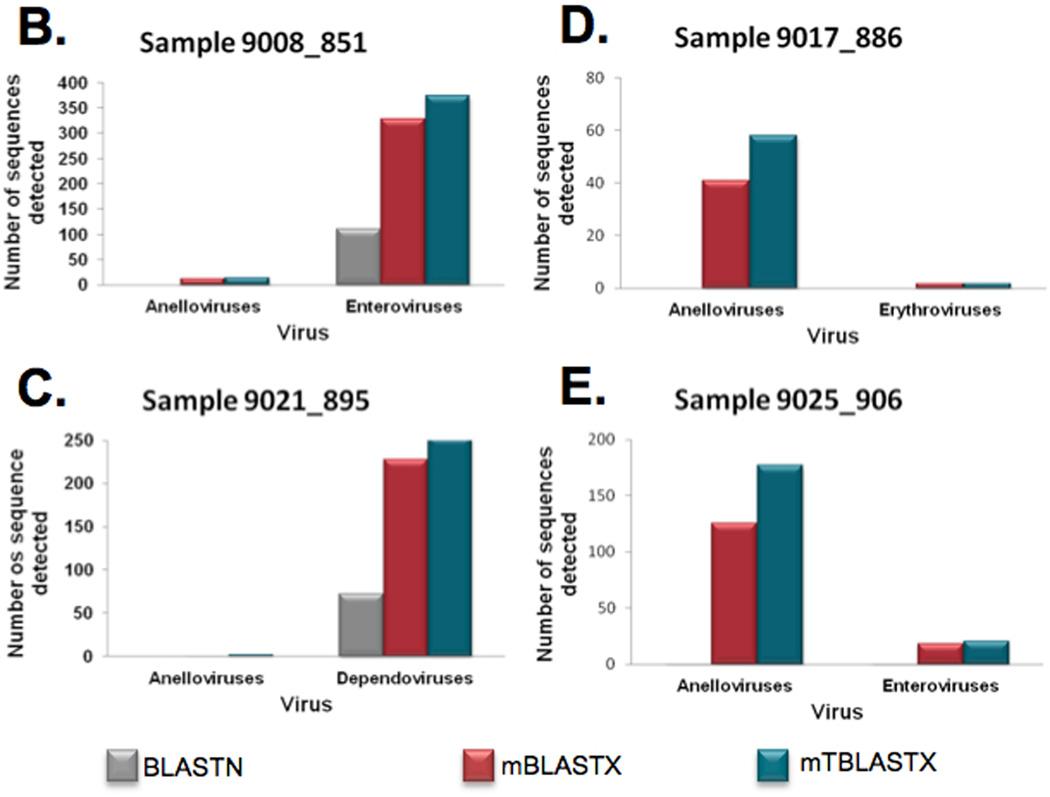
As BLASTX and TBLASTX are very similar, with the main difference being the need to translate the database before doing the search. We applied the same methodologies developed for mBLASTX (see above) to increase the performance of mTBLASTX, resulting in very similar sensitivity performance to mBLASTX (Table 1) and with a much higher speed up (over 6,000 fold, Table 2). The beta version of mTBLASTX has improved gap analysis compared to the original algorithm used in mBLASTX for longer queries. To demonstrate the importance of rapid translated alignments in metagenomic sequence analysis, we analyzed several ssDNA and ssRNA viruses in plasma samples obtained from febrile children (Figure 7)[22]. In metagenomic samples, virus sequences are generally rare. Therefore, it is important to detect every read of viral origin by aligning to a genome or proteome database in order to characterize the virome (Figure 7A). Nucleotide alignments identify highly conserved sequences (Figure 7B, enteroviruses, and 7C, dependoviruses), however, since viral nucleotide sequences evolve very rapidly, translated alignments allow for the identification of many more viral reads in some cases (7B, enteroviruses; 7C, dependoviruses; 7D and 7E anelloviruses). This enhances the viral signal in the sample, and additional reads can enhance or enable contig assembly, virus subtyping, and comparative genomics [35]. In other cases, translated alignments are critical for even detecting a virus in a sample (Figure7B and 7C, anelloviruses). While the biological significance of low numbers of viral sequence reads is not clear, these observations can be confirmed with PCR experiments or additional sequencing [35].
Figure 7.
Metagenomic shotgun reads from 20 blood plasma samples from febrile children were aligned to viral reference genomes at the nucleotide sequence level and compared to translated alignments generated using mBLASTX and mTBLASTX. (A) Translated alignments improve detection of ssDNA and ssRNA viruses in metagenomic samples. (B–E) Examples from 4 plasma samples from febrile children and the detected Anelloviruses (ssDNA genomes), enteroviruses (+ssRNA genomes), erythroviruses (ssDNA genomes), and dependoviruses (ssDNA genomes). The numbers of viral sequences detected by each alignment method are shown.
Evaluating performance of mBLASTP
The BLASTP algorithm was also optimized via the same strategy described above, giving rise to mBLASTP (see Methods for details) with ~800× performance increase over BLASTP (Table 2). Using the following criteria for considering hits found by both algorithms: a) Same query hitting the same subject - top blastp hit present in top "n" mBLASTP hits where n = 1, 5, 10 and 32; b) The subject in the alignments are in the same frame; c) The start and stop positions of the hit in the subject should be within +/−20% of the BLASTP alignment length, we achieved > 99% match sensitivity relative to BLASTP (Table 1).
The primary utility of mBLASTP in metagenomic projects is currently protein annotation from open reading frames (ORFs) in metagenomic assemblies. While assembly of metagenomic shotgun data is challenging, there are assemblers such as SOAP de novo that can be used for this purpose (e.g. [36]). mBLAST enables annotation of the millions of ORFs resulting from the metagenomic assemblies within days with a very high level of sensitivity.
Discussion
Current short read sequencng platforms produce enormous amounts of sequencing data, and these amounts have been increasing exponentially over the past few years. This has introduced new challenges in data analysis in terms of the computational resources and algorithms that are available. Alignment to known and characterized sequences is an important component of analysis and NCBI’s BLAST suite of algorithms, originally developed decades ago, is still considered the gold standard in alignment in terms of its sensitivity. In this study we have shown that there is still room for improvement of these legacy algorithms and have achieved a speed-up sufficient to deliver the performance necessary for current sequencing platforms while retaining a high level of sensitivity.
Application of mBLAST to Human Microbiome Data
The importance of being able to do BLAST alignments for huge metagenomic datasets in a timely manner cannot be overstated. The HMP produces two types of metagenomic shotgun data, sequences originating from reference genomes and from metagenomic communities. The advantages of the shotgun sequences originating from metagenomic communities compared to the community profiling using 16S rRNA gene are the ability to identify the presence of non-bacterial members (such as viruses and lower eukaryotes) and estimate the genetic potential and metabolic capabilities of the communities, among others. While ideally the metabolic profiling of the community should be done at a gene level, after assembly and gene calling, the metagenomic assembly is still very challenging [37]. However, read lengths of 100 nucleotides combined with the mBLAST programs make read level protein BLAST searches feasible.
Analysis of large amounts of sequences is a challenge that nearly every project using NGS faces routinely. For HMP, the analysis of 631 samples with approximately 5 GB of data (50 million nucleotide reads of length 100bp) per sample (Table 3), a total of 3.5 terabases of clean (human free) microbial data, using BLASTX was a significant computational challenge. The necessary BLASTX analysis involved several different protein databases to answer many different biological questions. If one used a cluster of 200 constantly running machines with dual socket quad-Nehalem cores and 48 GB memory (large machine, Table 3), it would have taken approximately 4.4 years (Table 3) to process this analysis or, alternatively, approximately $25 million dollars (in runtime on the current EC2 Amazon cluster using NCBI BLASTX based on web-advertised pricing (http://aws.amazon.com/ec2/pricing/)). Neither of these options is viable, but with the development of mBLAST, this analysis is now tractable. The CPU version of mBLASTX, with 1,600× performance and over 98% sensitivity, was used to align 3.5 terabases of microbial data against different functional protein databases. The use of mBLAST enabled the completion of the analysis of this data in about 4 weeks of processing time, mixed in with various other compute loads.
Table 3.
The Human Microbiome Dataset and time required for analysisa.
| Blast/mBLAST | Samples | Sequences | Aligned to KEGG+c and/or UNIREF100 (days) |
|||
|---|---|---|---|---|---|---|
| analysis | Body Region | Body site | (#) | (Millions) | BLAST | mBLAST |
| BLASTX and mBLASTX (metabolic profiling) | Nasal Cavity | Anterior_nares | 88 | 141 | 1,351.30 | 0.8 |
| Oral Cavity | Buccal_mucosa | 109 | 1,344 | 12,882.90 | 7.9 | |
| Supragingival_plaque | 116 | 6,651 | 63,741.40 | 39.3 | ||
| Tongue_dorsum | 125 | 10,630 | 101,875.50 | 62.7 | ||
| GI Tractb | Stool | 139 | 14,472 | 138,689.70 | 85.4 | |
| Vaginal Tract | Posterior_fornix | 54 | 250 | 2,396.50 | 1.5 | |
| TBLASTX and mTBALSTX (virus discovery) | Nasal Cavity | Anterior_nares | 88 | 94 | 2,122.60 | 0.3 |
| Oral Cavity | Buccal_mucosa | 109 | 527 | 11,875.00 | 1.8 | |
| Supragingival_plaque | 116 | 3,006 | 67,747.90 | 10.4 | ||
| Tongue_dorsum | 125 | 4,986 | 112,351.40 | 17.3 | ||
| GI Tractb | Stool | 139 | 5,615 | 126,535.30 | 19.5 | |
| Vaginal Tract | Posterior_fornix | 54 | 57 | 1,279.20 | 0.2 | |
| BLASTP and mBLASTP (ORF annotation) | All body site ORFs | 631 | 90 | 924.8 | 1.2 | |
The timing is based on performance using Large machine (dual socket-quad Nehalem core 48 GB memory);
GI Tract, Gastro Intestinal Tract;
KEGG+, is the combination of the KEGG database and 6 other functional databases
One of the primary aims in speeding up performance of TBLASTX in shotgun metagenomic projects is to identify novel viruses in a reasonable time frame. Virus detection pipelines includes two major steps [22], the first being the identification of known viruses using nucleotide level searches and the second one being the identification of distantly related homologies and novel viruses by TBLASTX. The second step is particularly useful for viruses with high sequence diversity, such as those with ssDNA and ssRNA genomes. For example, some anellovirus isolates have been shown to have up to 60% divergence at the amino acid level within ORF 1 [38]. Thus, a comprehensive analysis of the viral component of the microbiome requires the ability to carry out rapid and relatively sensitive translated alignments against viral reference genomes. In cases like this TBLASTX is preferred over BLASTX because it enables us to query a more comprehensive set of sequences, increasing the sensitivity and accuracy of the results. TBLASTX is more sensitive for virus detection and discovery because it translates a set of nucleotide references into six protein frames before alignment, allowing metagenomic sequences to be compared to all possible protein coding sequences and not just those that are easily predicted or deposited in public databases like NR. Accuracy is improved because the best alignment from a more comprehensive database is reported. For example, remote similarities to viral proteins may be detected when using BLASTX to align to NR, but the same sequences may have stronger alignments to another reference (such as the human genome) that can be detected using TBLASTX to query a nucleotide database like NT. Thus, a comprehensive analysis of the viral component of the microbiome requires the ability to carry out rapid and relatively sensitive translated alignments against viral reference genomes. Despite these very significant advantages, TBLASTX is rarely used in practice because it requires such an immense CPU time requirement (usually at least 6 fold that of BLASTX) so to complete such searches in a reasonable time frame (Table 3) accelerated algorithms such as mTBLASTX are essential.
Finally, BLASTP acceleration has compelling applications in the annotation of large metagenomic assemblies. For example, in the HMP [39] assemblies were generated using an optimized SOAPdenovo [40] protocol with parameters designed to achieve an assembly containing sufficiently large contigs for downstream analyses such as gene and function prediction. Annotation of the resulting 41 million contigs resulted in a total of 66,551,726 predicted peptide ORFs using MetageneMark [41]. Functional annotation of the ORF was done on primary amino acid sequence identity level using mBLASP against the UniRef100 [26] within a small (<1/500) fraction of the time needed if BLASTP was used (Table 3).
Summary
In metagenomics, the number of queries that require protein BLAST searches against different databases continues to increase as sequencing technologies evolve, and the databases continue to grow. Advances in computer speed are no longer sufficient to keep pace with this growth, thus new and/or improved software tools must be developed. The approach and the improvements implemented in the mBLAST algorithms enabled more than a thousand fold speed up with only marginal loss in sensitivity, regaining BLAST algorithms as a workable tool for metagenomic analysis.
For future development, we believe that further software optimization yielding gains similar to those presented here will prove more and more challenging. Hardware-based solutions such as a version of BLAST optimized for Graphics Processor Units (GPUs) are another possibility. Although beyond the scope of this study, we also made preliminary investigations into using GPUs to accelerate an advanced seed finding step for BLAST. Seed finding is the dominant part of the BLAST search process, constituting approximately 85% of the total time prior to the mBLAST optimizations. It was relatively straightforward to achieve a 10× speedup with the GPU (compared to CPU-only mBLASTX) using either NVIDIA or AMD GPUs for this step. However, with the increased speed over mBLAST, disk I/O became a bottleneck and only a net 1.4× was achieved in the complete execution. The GPU version of the algorithm was also evaluated on a GPU cluster housed at the University of Illinois (Lincoln, TERAGRID, [42]) resulting in the same 1.4× performance gain as on a stand-alone server with a local NVIDIA Tesla card (C1060, DELL)). With advanced SSD drives and additional optimizations targeting the I/O bottleneck, indicate that additional, significant speedup should be possible in a future implementation of mBLAST using GPUs (unpublished observations).
This study demonstrated that proven, legacy algorithms that have previously been highly optimized for different search scenarios can still be very substantially improved to meet the needs of newer sequencing technologies.
Supplementary Material
Supplementary File 2. Documentation on how to run MHashGen. MHashGen builds the accelerated data files for the subject database.
Supplementary File 3. Documentation on how to run mBLASTX.
Supplementary File 4. Documentation on how to run mBLASTP.
Supplementary File 1. Documentation on how to run MNeighborGen. MNeighborGen is used to generate neighborhood matrix.
Acknowledgements
Research at Washington University was supported by grants NIH-NHGRI U54HG003079 and U54HG004968, and at University of Illinois by US Department of Energy grant DE-SC0004847.
Data availability
The sequence data from this study have been submitted to the short Read Archive and are available under accession no. SRS015890. The assembly scaffolds are available under accession no. SRS013215. The samples for virus detection are available under accession no. SRR057960, SRR057863, SRR057962, SRR057864, SRR057938, SRR057831, SRR057939, SRR057832.
Abbreviations
- BLAST
Basic Local Alignment Search Tool
- mBLAST, WGS
whole genome shotgun
- HMP
Human Microbiome Project
- HSP
High Scoring Pairs
- NCBI
Nactional Center for Biotechnology Information
- NR
NCBI’s non-redundant database
- KEGG
Kyoto Encyclopedia of Genes and Genomes.
References
- 1.Stratton MR, Campbell PJ, Futreal PA. The cancer genome. Nature. 2009;458:719–724. doi: 10.1038/nature07943. [DOI] [PMC free article] [PubMed] [Google Scholar]
- 2.Altschul SF, Gish W, Miller W, Myers EW, Lipman DJ. Basic local alignment search tool. J Mol Biol. 1990;215:403–410. doi: 10.1016/S0022-2836(05)80360-2. [DOI] [PubMed] [Google Scholar]
- 3.Korf I, Yandell M, Bedell J. BLAST: O'Reilly Media. 2003:368. [Google Scholar]
- 4.Gish W. WU-BLAST. 1996–2022 www://blast.wustl.edu. [Google Scholar]
- 5.Jenuth JP The NCBI. Publicly available tools and resources on the Web. Methods Mol Biol. 2000;132:301–312. doi: 10.1385/1-59259-192-2:301. [DOI] [PubMed] [Google Scholar]
- 6.Altschul SF, Madden TL, Schaffer AA, Zhang J, Zhang Z, et al. Gapped BLAST and PSI-BLAST: a new generation of protein database search programs. Nucleic Acids Res. 1997;25:3389–3402. doi: 10.1093/nar/25.17.3389. [DOI] [PMC free article] [PubMed] [Google Scholar]
- 7.Kim HS, Han Dong-Soo. Hyper-BLAST: A parallelized BLAST on Cluster System. In: Hong-Soog Kim H-JKaD-SH., editor. Lecture Notes in Computer Science. Berlin Heidelberg: Springer-Verlag; 2003. pp. 213–222. [Google Scholar]
- 8.Matsunaga A, Tsugawa Maurício, José Fortes. CloudBLAST: Combining MapReduce and Virtualization on Distributed Resources for Bioinformatics Applications; 4th IEEE International Conference on e-Science; 2008. pp. 222–229. [Google Scholar]
- 9.Afgan E, Purushotham B. Dynamic BLAST – a Grid Enabled BLAST. International Journal of Computer Science and Network Security. 2009;9:149–157. [Google Scholar]
- 10.Krishnan A. Concurrency and Computation: Practice & Experience. Chichester, UK: John Wiley and Sons Ltd.; 2005. GridBLAST: a Globus-based high-throughput implementation of BLAST in a Grid computing framework; pp. 1607–1623. [Google Scholar]
- 11.Chistoserdova L. Recent progress and new challenges in metagenomics for biotechnology. Biotechnol Lett. 2010;32:1351–1359. doi: 10.1007/s10529-010-0306-9. [DOI] [PubMed] [Google Scholar]
- 12.Handelsman J. Metagenomics: application of genomics to uncultured microorganisms. Microbiol Mol Biol Rev. 2004;68:669–685. doi: 10.1128/MMBR.68.4.669-685.2004. [DOI] [PMC free article] [PubMed] [Google Scholar]
- 13.Warnecke F, Hugenholtz P. Building on basic metagenomics with complementary technologies. Genome Biol. 2007;8:231. doi: 10.1186/gb-2007-8-12-231. [DOI] [PMC free article] [PubMed] [Google Scholar]
- 14.Peterson J, Garges S, Giovanni M, McInnes P, Wang L, et al. The NIH Human Microbiome Project. Genome Res. 2009;19:2317–2323. doi: 10.1101/gr.096651.109. [DOI] [PMC free article] [PubMed] [Google Scholar]
- 15.Human Microbiome Project Consortium. A framework for human microbiome research. Nature. 2012;486:215–221. doi: 10.1038/nature11209. [DOI] [PMC free article] [PubMed] [Google Scholar]
- 16.Human Microbiome Project Consortium. Structure, function and diversity of the healthy human microbiome. Nature. 2012;486:207–214. doi: 10.1038/nature11234. [DOI] [PMC free article] [PubMed] [Google Scholar]
- 17.Kent WJ. BLAT--the BLAST-like alignment tool. Genome Res. 2002;12:656–664. doi: 10.1101/gr.229202. [DOI] [PMC free article] [PubMed] [Google Scholar]
- 18.Kanehisa M, Goto S, Furumichi M, Tanabe M, Hirakawa M. KEGG for representation and analysis of molecular networks involving diseases and drugs. Nucleic Acids Res. 2010;38:D355–D360. doi: 10.1093/nar/gkp896. [DOI] [PMC free article] [PubMed] [Google Scholar]
- 19.Abubucker S, Segata N, Goll J, Schubert AM, Izard J, et al. Metabolic reconstruction for metagenomic data and its application to the human microbiome. PLoS Comput Biol. 2012;8:e1002358. doi: 10.1371/journal.pcbi.1002358. [DOI] [PMC free article] [PubMed] [Google Scholar]
- 20.Wang D, Coscoy L, Zylberberg M, Avila PC, Boushey HA, et al. Microarray-based detection and genotyping of viral pathogens. Proc Natl Acad Sci U S A. 2002;99:15687–15692. doi: 10.1073/pnas.242579699. [DOI] [PMC free article] [PubMed] [Google Scholar]
- 21.Wang D, Urisman A, Liu YT, Springer M, Ksiazek TG, et al. Viral discovery and sequence recovery using DNA microarrays. PLoS Biol. 2003;1:E2. doi: 10.1371/journal.pbio.0000002. [DOI] [PMC free article] [PubMed] [Google Scholar]
- 22.Wylie KM, Mihindukulasuriya KA, Sodergren E, Weinstock GM, Storch GA. Sequence analysis of the human virome in febrile and afebrile children. PLoS one. 2012;7:e27735. doi: 10.1371/journal.pone.0027735. [DOI] [PMC free article] [PubMed] [Google Scholar]
- 23.Rice P, Longden I, Bleasby A. EMBOSS: the European Molecular Biology Open Software Suite. Trends Genet. 2000;16:276–277. doi: 10.1016/s0168-9525(00)02024-2. [DOI] [PubMed] [Google Scholar]
- 24.Henikoff S, Henikoff JG. Automated assembly of protein blocks for database searching. Nucleic Acids Res. 1991;19:6565–6572. doi: 10.1093/nar/19.23.6565. [DOI] [PMC free article] [PubMed] [Google Scholar]
- 25.Okuda S, Yamada T, Hamajima M, Itoh M, Katayama T, et al. KEGG Atlas mapping for global analysis of metabolic pathways. Nucleic Acids Res. 2008;36:W423–W426. doi: 10.1093/nar/gkn282. [DOI] [PMC free article] [PubMed] [Google Scholar]
- 26.Suzek BE, Huang H, McGarvey P, Mazumder R, Wu CH. UniRef: comprehensive and non-redundant UniProt reference clusters. Bioinformatics. 2007;23:1282–1288. doi: 10.1093/bioinformatics/btm098. [DOI] [PubMed] [Google Scholar]
- 27.Caspi R, Altman T, Dreher K, Fulcher CA, Subhraveti P, et al. The MetaCyc database of metabolic pathways and enzymes and the BioCyc collection of pathway/genome databases. Nucleic Acids Res. 2012;40:D742–D753. doi: 10.1093/nar/gkr1014. [DOI] [PMC free article] [PubMed] [Google Scholar]
- 28.Liu B, Pop M. ARDB--Antibiotic Resistance Genes Database. Nucleic Acids Res. 2009;37:D443–D447. doi: 10.1093/nar/gkn656. [DOI] [PMC free article] [PubMed] [Google Scholar]
- 29.Saier MH, Jr, Yen MR, Noto K, Tamang DG, Elkan C. The Transporter Classification Database: recent advances. Nucleic Acids Res. 2009;37:D274–D278. doi: 10.1093/nar/gkn862. [DOI] [PMC free article] [PubMed] [Google Scholar]
- 30.Cantarel BL, Coutinho PM, Rancurel C, Bernard T, Lombard V, et al. The Carbohydrate-Active EnZymes database (CAZy): an expert resource for Glycogenomics. Nucleic Acids Res. 2009;37:D233–D238. doi: 10.1093/nar/gkn663. [DOI] [PMC free article] [PubMed] [Google Scholar]
- 31.Wootton JC, Federhen S. Analysis of compositionally biased regions in sequence databases. Methods Enzymol. 1996;266:554–571. doi: 10.1016/s0076-6879(96)66035-2. [DOI] [PubMed] [Google Scholar]
- 32.Hancock JM, Armstrong JS. SIMPLE34: an improved and enhanced implementation for VAX and Sun computers of the SIMPLE algorithm for analysis of clustered repetitive motifs in nucleotide sequences. Comput Appl Biosci. 1994;10:67–70. doi: 10.1093/bioinformatics/10.1.67. [DOI] [PubMed] [Google Scholar]
- 33.Korf I, Yandell Mark, Bedell Joseph. BLAST: O'Reilly Media. 2003:368. [Google Scholar]
- 34.The Human Microbiome Consortium. A framework for human microbiome research. Nature. (in press) [Google Scholar]
- 35.Wylie KM, Mihindukulasuriya KA, Sodergren E, Weinstock GM, Storch GA. Sequence Analysis of the Human Virome in Febrile and Afebrile Children. PLoS one. doi: 10.1371/journal.pone.0027735. (in press) [DOI] [PMC free article] [PubMed] [Google Scholar]
- 36.Qin J, Li R, Raes J, Arumugam M, Burgdorf KS, et al. A human gut microbial gene catalogue established by metagenomic sequencing. Nature. 2010;464:59–65. doi: 10.1038/nature08821. [DOI] [PMC free article] [PubMed] [Google Scholar]
- 37.Pop M. Genome assembly reborn: recent computational challenges. Brief Bioinform. 2009;10:354–366. doi: 10.1093/bib/bbp026. [DOI] [PMC free article] [PubMed] [Google Scholar]
- 38.Ninomiya M, Takahashi M, Shimosegawa T, Okamoto H. Analysis of the entire genomes of fifteen torque teno midi virus variants classifiable into a third group of genus Anellovirus. Arch Virol. 2007;152:1961–1975. doi: 10.1007/s00705-007-1046-6. [DOI] [PubMed] [Google Scholar]
- 39.The Human Microbiome Consortium. Structure, Function and Diversity of the Human Microbiome in an Adult Reference Population. Nature. (in press) [Google Scholar]
- 40.Li R, Zhu H, Ruan J, Qian W, Fang X, et al. De novo assembly of human genomes with massively parallel short read sequencing. Genome Research. 2010;20:265–272. doi: 10.1101/gr.097261.109. [DOI] [PMC free article] [PubMed] [Google Scholar]
- 41.Zhu W, Lomsadze A, Borodovsky M. Ab initio gene identification in metagenomic sequences. Nucleic Acids Res. 2010;38:e132. doi: 10.1093/nar/gkq275. [DOI] [PMC free article] [PubMed] [Google Scholar]
- 42.Beckman PH. Building the TeraGrid. Philos Transact A Math Phys Eng Sci. 2005;363:1715–1728. doi: 10.1098/rsta.2005.1602. [DOI] [PubMed] [Google Scholar]
Associated Data
This section collects any data citations, data availability statements, or supplementary materials included in this article.
Supplementary Materials
Supplementary File 2. Documentation on how to run MHashGen. MHashGen builds the accelerated data files for the subject database.
Supplementary File 3. Documentation on how to run mBLASTX.
Supplementary File 4. Documentation on how to run mBLASTP.
Supplementary File 1. Documentation on how to run MNeighborGen. MNeighborGen is used to generate neighborhood matrix.


