

Abstract
The purpose of this study was to evaluate the affinity of docetaxel for 14 transporter proteins and assess the functional significance of 17 variants in five genes involved in drug elimination. Among the transfected models investigated, OATP1B3 (SLCO1B3) was identified as the most efficient influx transporter for docetaxel. None of the observed genotypes (SLCO1B3, ABCB1, and ABCC2) was related with docetaxel clearance in 92 white patients (P > 0.17). However, the simultaneous presence of the CYP3A4*1B and CYP3A5*1A alleles was associated with a 64% increase in docetaxel clearance (P = 0.0015), independent of both sex and CYP3A activity (as determined using the erythromycin breath test). This haplotype was also associated with increased midazolam clearance in another population (P = 0.0198). An analysis of the CYP3A locus among CEPH-HapMap samples revealed that CYP3A4*1B is present exclusively among a subset of CYP3A5 expressors. Therefore, future studies should first stratify the population on the basis of CYP3A5 genotype and then compare CYP3A activity between individuals with and without the CYP3A4*1B allele.
Docetaxel, a tubulin-interactive agent, is one of the most widely used chemotherapeutic agents and has been approved for the treatment of breast, lung, ovarian, prostate, gastric, and head and neck cancers. The pharmacokinetic profile of docetaxel is characterized by substantial interindividual variability, with an up to tenfold difference in drug clearance, even in patients with normal hepatic function.1 This degree of variability has important toxicological and therapeutic ramifications. Previously, it has been demonstrated that a 50% decrease in docetaxel clearance increases the odds of developing grade 4 neutropenia by 430%.2 Moreover, systemic exposure to docetaxel is a known predictor of time to tumor progression in patients with non-small-cell-lung cancer.3 In these patients, a smaller docetaxel area under the curve has been associated with a shorter time to progression and time to death.4
The erratic or unpredictable response of individuals to docetaxel remains a major challenge for modern chemotherapy. Recent population pharmacokinetic analyses have attempted to identify demographic and physiological factors that may influence the clearance of docetaxel.5 However, the magnitude of interindividual pharmacokinetic variability of this agent is still largely unexplained. A critical determinant of this variability is associated with the differential expressions of polymorphic drug-metabolizing enzymes and/or transporters at the sites of elimination. Previous in vitro studies have established that the elimination of docetaxel is dictated mainly by the hepatic enzyme CYP3A4 and, to a lesser extent, by CYP3A5.6 The importance of these enzymes has recently been confirmed in mice with a deletion of the entire CYP3A gene cluster. In these mice, the clearance of docetaxel was decreased sevenfold when compared with that in wild-type controls.7
In the past decade, important new insights have also been obtained on polymorphic transporters involved in docetaxel elimination. Specifically, there is compelling evidence suggesting that hepatocellular uptake of taxanes from sinusoidal blood is regulated, at least in part, by the solute carrier OATP1B3 (SLCO1B3; OATP8),8 whereas the ATP-binding cassette (ABC) transporters ABCB1 (P-glycoprotein)9 and ABCC2 (MRP2; cMOAT),10 are involved in the secretion of taxanes from the liver into the bile. In this study, we tested the hypothesis that an inherited variation in the genes involved in the docetaxel elimination pathway contributes to interindividual differences in the clearance of docetaxel in cancer patients.
Results
Interaction of docetaxel with transporters
Influx transport of docetaxel was assessed for the solute carrier superfamily members OATP1A2 (OATP-A), OATP1B1 (OATP-C, OATP2), OATP1B3, rOatp1b2 (oatp4), OAT1 (NKT), OAT2 (NLT), OAT3, OCT1, OCT2, OCT3, and SLC10A1 (NTCP) (Figure 1a). Of these transporters, only the hepatocellular-localized proteins OATP1B3 (2.62-fold vs. control), its rodent ortholog rOatp1b2 (2.23-fold), and OAT2 (2.27-fold) were capable of increasing the intracellular concentrations of docetaxel to a significant extent. Docetaxel was also shown to be transported by the ABC transporter ABCC2 (but not by ABCC4 (MRP4) or ABCG2 (BCRP)), causing a significant decrease in the intracellular concentration relative to control cells (Figure 1b).
Figure 1.

Accumulation of docetaxel by (a) Xenopus laevis oocytes (hatched bars) or mammalian cells (black bars) expressing solute carriers, and (b) mammalian cells expressing ATP-binding cassette transporters. The data represent the mean of 6–33 observations, and are expressed as a percentage of the control (white bars). For clarity, only a single control bar is shown for the solute carriers. Error bars represent the standard error. The asterisk (*) denotes significant difference from the control value (P < 0.05).
Patients
Complete pharmacologic data were available for 92 adult white patients with cancer (of whom 41 were women) with a median age of 63 years (range, 24–83 years) (Table 1). The most frequent primary tumor types were breast cancer (n = 25), prostate cancer (n = 24), and lung cancer (n = 11).
Table 1. Baseline patient characteristicsa.
| Characteristic | Value |
|---|---|
| Baseline screening | |
| Total evaluable | 92 |
| Age (years) | 63 (24–83) |
| Sex (male/female) | 51 (55)/41 (45) |
| Body surface area (m2) | 1.95 (1.40–2.72) |
| ECOG performance status | 1 (0–1) |
| Primary tumor site | |
| Breast | 25 (27) |
| Prostate | 24 (26) |
| Lung | 11 (12) |
| Head and neck | 7 (8) |
| Other | 25 (27) |
| Pretherapy chemistry and hematology | |
| Total bilirubin (× ULN) | 0.42 (0.17–1.25) |
| Aspartate aminotransferase (× ULN) | 0.78 (0.30–4.70) |
| Alanine aminotransferase (× ULN) | 0.60 (0.10–6.61) |
| Alkaline phosphatase (× ULN) | 0.82 (0.39–8.69) |
| α1-Acid glycoprotein (mg/dl) | 126 (60–257) |
| Erythromycin breath test C20 (%dose/min) | 0.047 (0.0015–0.124) |
ECOG, Eastern Cooperative Oncology Group; N/A, not available; ULN, upper limit of institutional normal.
Continuous data are given as median with range in parentheses, and categorical data as number of patients with percentage of the total population in parentheses.
Docetaxel pharmacokinetics
The overall mean clearance of docetaxel was 23.4 l/h, and the observed range in clearance was 7.6-fold between the fastest and the slowest clearances. Because clearance was not significantly dependent on the total dose (P = 0.12), pharmacokinetic information from all patients was pooled in subsequent analyses without further correction. The clearance of docetaxel was unrelated to performance status (0 vs. 1 vs. 2; P = 0.13), age (P = 0.86), α1-acid glycoprotein (P = 0.46), bilirubin (P = 0.72), or body surface area (P = 0.10). Weak but statistically significant relationships were found between clearance and the erythromycin breath test (ERMBT) parameter C20 (R2 = 0.072; P = 0.036) as well as sex (P = 0.0042), with women having, on average, a 35% lower clearance rate than men. During multiple regression analysis, both ERMBT (P = 0.0066) and sex (P = 0.0026) were retained as significant independent variables in the final model for docetaxel clearance (R2 = 0.13).
Results of genotyping
Seventeen single-nucleotide polymorphisms (SNPs) were analyzed in five genes of putative relevance to docetaxel elimination (Table 2), including SLCO1B3, CYP3A4, CYP3A5, ABCB1, and ABCC2. The relative frequencies of the variant alleles were comparable with previously reported estimates.11–14 The OAT2 gene (SLC22A7) was not considered in this analysis because nonsynonymous coding region SNPs have been reported at a low frequency (<1%) only in certain ethnic groups but not in subjects of European ancestry.15 The frequency distributions of all SNPs were in Hardy–Weinberg equilibrium (data not shown).
Table 2. Description and allele frequencies of the studied variants.
| Gene (allele)b | dbsnp iD | Region | Effectc | Allele frequencya | |
|---|---|---|---|---|---|
| p | q | ||||
| SLCO1B3 | |||||
| 334T>G (*2) | rs4149117 | Exon 3 | S112A | 0.147 | 0.853 |
| 439A>G (*3) | N/A | Exon 4 | T147A | 0.995 | 0.005 |
| 699G>A (*4) | rs7311358 | Exon 6 | M233I | 0.159 | 0.841 |
| 767G>C (*5) | N/A | Exon 7 | G256A | 0.811 | 0.189 |
| 1559A>C (*6) | N/A | Exon 11 | H520P | 1.00 | 0 |
| 1679T>C (*7) | rs12299012 | Exon 11 | V560A | 0.984 | 0.016 |
| CYP3A4 | |||||
| −392A>G (*1B) | rs2740574 | 5′-Flanking | — | 0.951 | 0.049 |
| CYP3A5 | |||||
| 6986A>G (*3C) | rs776746 | Intron 3 | Frameshift | 0.076 | 0.924 |
| ABCB1 | |||||
| 1236C>T (*8) | rs1128503 | Exon 12 | G412G | 0.539 | 0.461 |
| 2677G>T/A (*7) | rs2032582 | Exon 21 | A893S/T | 0.556 | 0.422/0.022 |
| 3435C>T (*6) | rs1045642 | Exon 26 | I1145I | 0.478 | 0.522 |
| ABCC2 | |||||
| −1019A>G | rs2804402 | 5′-Flanking | — | 0.614 | 0.386 |
| −24C>T | rs717620 | 5′-UTR | — | 0.815 | 0.185 |
| 1249G>A | rs2273697 | Exon 10 | V417I | 0.789 | 0.211 |
| IVS26 −34T>C | rs8187698 | Intron 26 | Exon 26 | 0.946 | 0.054 |
| 3972C>T | rs3740066 | Exon 28 | I1324I | 0.647 | 0.353 |
| 4544G>Ad | rs8187710 | Exon 32 | C1515Y | 0.967 | 0.033 |
UTR, untranslated region; dbSNP, single-nucleotide polymorphism database.
Hardy–Weinberg notation for allele frequencies; p, frequency for reference allele and q, frequency for variant allele.
Number represents position in nucleotide sequence with star nomenclature in parentheses where available.
Number represents amino acid codon;
In complete linkage disequilibrium with the polymorphisms 3844-73A>G, 4146d+11G>C, 4290G>T (V1430V), 4488C>T (H1469H), and 4508+12G>A.
Twelve haplotypes were observed in SLCO1B3, the most common of which (GAAGAT at positions 334, 439, 699, 767, 1559, and 1679; haplotype SLCO1B3*1) had a frequency of 64%. As predicted, significant linkage was observed between SLCO1B3 334T>G and the SNP at the 699 locus (D′ = 0.86; P > 0.001).16 Similarly, the CYP3A4 −392A>G (CYP3A4*1B) and CYP3A5 6986A>G (CYP3A5*3C) SNPs were found to be in linkage (D′ = 0.79; P < 0.001), as described previously.17,18 For these two SNPs, four haplotypes were observed, with frequencies of 84.3% (CYP3A4*1A/CYP3A5*3C; haplotype CYP3A4/5*1), 7.99% (CYP3A4*1B/CYP3A5*1A; haplotype CYP3A4/5*2), 6.00% (CYP3A4*1A/CYP3A5*1A; haplotype CYP3A4/5*3), and 1.76% (CYP3A4*1B/CYP3A5*3C; haplotype CYP3A4/5*4). A total of 8 and 14 haplotypes, respectively, were observed for ABCB1 (frequency of CGC at positions 1236, 2677, and 3435, 43%; haplotype ABCB1*1) and ABCC2 (frequency of ACGTCG at positions −1019, −24, 1249, IVS26 −34, 3972, and 4544, 35%; haplotype ABCC2*1). The extent of linkage between individual SNPs in these ABC transporter genes was similar to that reported previously11 (data not shown).
Genotype–phenotype relationships
The presence of the CYP3A4*1B and CYP3A5*1A alleles was associated with a 62% (P = 0.055) (Figure 2a) and 49% (P = 0.020) (Figure 2b) increase in docetaxel clearance, respectively. In the study population consisting of only white patients, the effect of these two minor CYP3A alleles was particularly evident when they were assessed simultaneously. The six individuals who were carrying haplotype CYP3A4/5*2 (that is, those having at least one CYP3A4*1B allele and at least one CYP3A5*1A allele) showed a 64% higher clearance of docetaxel than the others (P = 0.0015) (Figure 2c). This genotypic information was retained in the multiple regression model as a statistically significant independent predictor of clearance after concurrent incorporation of ERMBT and sex (P = 0.0044; R2 = 0.21). Interestingly, in a separate population of white patients studied previously, haplotype CYP3A4/5*2 was also associated with a 46% increase in the clearance of another CYP3A substrate drug, midazolam (P = 0.0198) (Figure 3a),17 but not with parameters obtained from the ERMBT (Figure 3b).19
Figure 2.
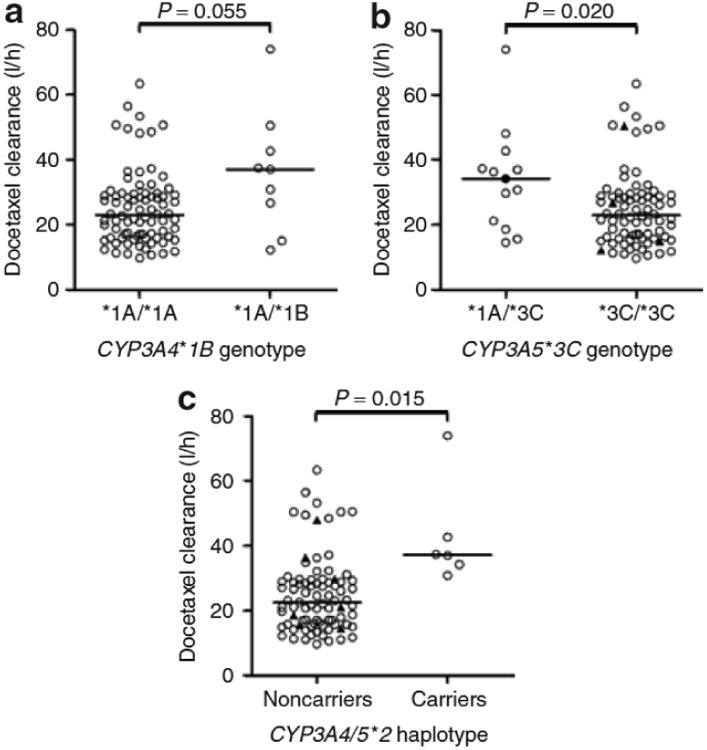
Docetaxel clearance as a function of (a) CYP3A4*1B genotype, (b) CYP3A5*3C genotype, and (c) combined presence of the CYP3A4*1B and CYP3A5*1A alleles (haplotype CYP3A4/5*2). Each symbol represents an individual patient, and horizontal lines indicate median values. In b, the black circle represents the only individual with two copies of the CYP3A5*1A allele, and the black triangles in the CYP3A5 non-expressors represent carriers of the CYP3A4*1B allele. In c, all individuals in the group of CYP3A4/5*2 carriers had the CYP3A4*1A*1B/CYP3A5*1A*3C diplotype, and the black triangles in the group of noncarriers represent CYP3A5 expressors.
Figure 3.

Association of the CYP3A4/5*2 haplotype with (a) midazolam clearance and (b) erythromycin breath test concentration at 20 min (ERMBT C20). Each symbol represents an individual patient, and horizontal lines indicate median values. The black triangles in the group of noncarriers represent CYP3A5 expressors.
None of the investigated SNPs in transporter genes was found to be significantly associated with the clearance of docetaxel (Table 3). Likewise, none of the common haplotypes in SLCO1B3, ABCB1, or ABCC2 was a predictor of clearance (Figure 4). Similar results were obtained when the study population was stratified by sex and also when the analysis was restricted to patients with the CYP3A5*3C/*3C genotype (i.e., CYP3A5 nonexpressors20) (data not shown).
Table 3. Clearance of docetaxel as a function of the observed genotypes.
| Gene (allele) | Reference genotype | Heterozygote genotype | Variant genotype | P-valueb | |||
|---|---|---|---|---|---|---|---|
| Valuea | N | Valuea | N | Valuea | N | ||
| SLCO1B3 | |||||||
| 334T>G | 32.1 | 1 | 27.0 (15.8–36.3) | 25 | 23.2 (20.7–27.5) | 65 | 0.58 |
| 439A>G | 23.3 (20.8–27.4) | 90 | 29.7 | 1 | N/A | 0 | 0.41 |
| 699G>A | 40.1 | 2 | 27.0 (15.8–34.2) | 25 | 22.2 (19.8–26.8) | 63 | 0.22 |
| 767G>C | 22.7 (18.6–28.3) | 60 | 26.8 (21.1–31.0) | 25 | 16.0 | 4 | 0.17 |
| 1559A>C | 23.4 (20.8–27.5) | 91 | N/A | 0 | N/A | 0 | N/A |
| 1679T>C | 23.2 (20.8–27.4) | 89 | 28.5 | 1 | 63.4 | 1 | 0.21 |
| CYP3A4 | |||||||
| −392A>G | 22.9 (20.7–27.0) | 82 | 37.0 (15.0–50.4) | 9 | N/A | 0 | 0.05 |
| CYP3A5 | |||||||
| 6986A>G | 34.2 | 1 | 33.6 (18.6–42.6) | 12 | 22.9 (19.8–26.8) | 78 | 0.06 |
| ABCB1 | |||||||
| 1236C>T | 21.7 (15.3–29.6) | 24 | 24.7 (18.8–28.5) | 48 | 22.6 (16.4–31.0) | 17 | 0.91 |
| 2677G>T/Ac | 23.2 (18.1–29.7) | 25 | 25.2 (20.8–28.5) | 50 | 20.7 (15.0–48.5) | 15 | 0.88 |
| 3435C>T | 21.1 (14.5–29.6) | 19 | 26.4 (18.8–28.9) | 48 | 24.7 (18.6–28.4) | 23 | 0.38 |
| ABCC2 | |||||||
| −1019A>G | 27.1 (18.8–29.7) | 34 | 21.8 (18.6–28.5) | 43 | 21.0 (14.5–27.0) | 14 | 0.34 |
| −24C>T | 24.7 (21.1–28.5) | 61 | 21.7 (16.9–28.1) | 26 | 20.3 | 4 | 0.69 |
| 1249G>A | 23.6 (18.6–27.4) | 54 | 23.2 (17.3–29.2) | 33 | 35.8 | 2 | 0.62 |
| IVS26 –34T>C | 23.3 (20.8–27.4) | 82 | 24.8 (9.70–34.2) | 8 | 28.3 | 1 | 0.90 |
| 3972C>T | 24.0 (15.8–28.4) | 38 | 21.8 (18.1–27.5) | 41 | 27.6 (21.5–42.6) | 12 | 0.42 |
| 4544G>A | 23.4 (20.8–27.5) | 83 | 20.5 (9.70–73.9) | 6 | N/A | 0 | 0.61 |
N, number of patients; N/A, not available.
Data represent median clearance of docetaxel in units of l/h with range in the parentheses.
P values were obtained from a two-tailed Mann–Whitney U-test (two-group comparisons) or a Kruskal–Wallis test (multiple-group comparisons).
In the heterozygote group, 49 patients had the GT genotype and 1 had the GA genotype; in the variant group, 12 patients had the TT genotype and 3 had the TA genotype.
Figure 4.
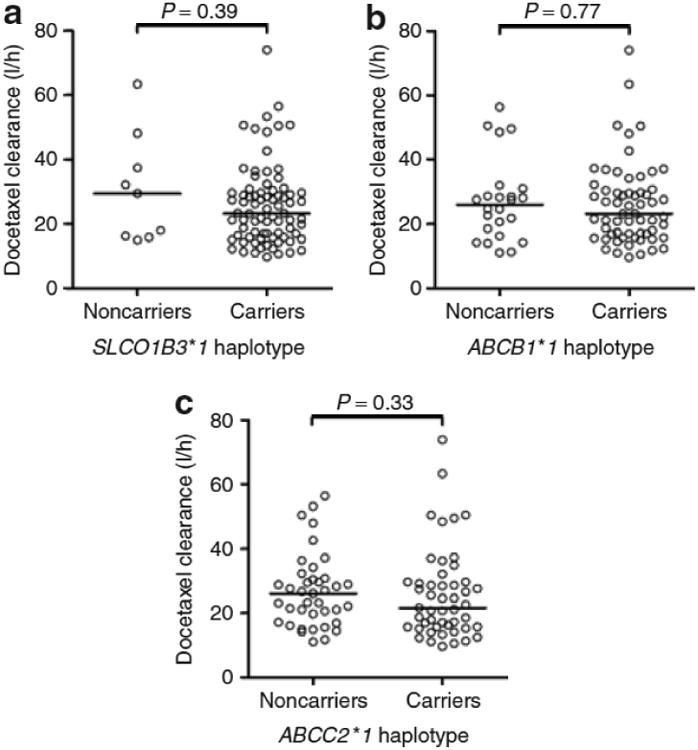
Docetaxel clearance as a function of the most common variant haplotypes in (a) SLCO1B3 (haplotype GAAGAT at positions 334, 439, 699, 767, 1559, and 1679; SLCO1B3*1), (b) ABCB1 (haplotype CGC at positions 1236, 2677, and 3435; ABCB1*1), and (c) ABCC2 (haplotype ACGTCG at positions −1019, −24, 1249, IVS26 −34, 3972, and 4544; ABCC2*1). Each symbol represents an individual patient, and horizontal lines indicate median values.
Visual genotyping of the CYP3A locus
We next used the Centre d'Etude du Polymorphisme Humain (CEPH) HapMap samples (http://www.cephb.fr/cephdb/) comprising Utah residents of northern and western European ancestry (http://www.hapmap.org/downloads/encode1.html.en) to carry out a visual evaluation of the CYP3A5*1A and CYP3A4*1B genotypes relative to other SNPs across the CYP3A locus. Although there are many programs that will designate haplotypes, an alternative approach is to visually stratify by genotypes that are known to be informative (e.g., CYP3A5 expressor or non-expressor) and use this information to drive haplotype selection. This visual genotyping of the CYP3A locus was carried out for the CEPH HapMap samples, and it was immediately apparent that, among white individuals, carriers of the CYP3A4*1B allele were found only as a subset of CYP3A5 expressors (Figure 5). Although we observed the presence of the CYP3A4*1B genotype in four (1.76%) of the CYP3A5 non-expressor patients, it was still rare compared to the CYP3A4/5*2 haplotype (7.99%).
Figure 5.

Visual genotypes of the CYP3A locus in CEPH-HapMap samples stratified on the basis of informative CYP3A genotypes. Each sample (identified on the x-axis) is arranged by CYP3A locus SNPs (on the y-axis). Genotypes are color-coded as follows: gray, homozygous wild type; orange, heterozygous; red, homozygous variant. Groups labeled 1 and 2 represent CYP3A5 expressors carrying CYP3A5*1A (rs776746) stratified by the presence or absence of the CYP3A4*1B (rs2740574) allele, respectively. Among CYP3A5 non-expressors, groups labeled 3, 4, 5, and 6 were further segregated by CYP3A7 SNPs, the SNP 3′ of CYP3A4 (rs1233983), and the CYP3A4 intron 7 SNP (rs2246709), respectively.
Discussion
In this study, we assessed the pharmacogenetics of known elimination pathways for docetaxel in a cohort of adult cancer patients in an attempt to identify inherited variability as a factor contributing to the extensive interindividual pharmacokinetic variability associated with this drug. The results of this analysis suggest that the clearance of docetaxel is not significantly dependent on a series of known reduced-function alleles in the SLCO1B3, ABCB1, and ABCC2 genes. In contrast, the simultaneous presence of two known functional alleles in the CYP3A4 and CYP3A5 genes was associated with enhanced elimination of docetaxel.
The OATP1B3 transporter, encoded by the SLCO1B3 gene, belongs to the class of organic anion transporting polypeptides and is particularly highly expressed at the basolateral (sinusoidal) plasma membrane of hepatocytes.21 Little is known about the functional role of SLCO1B3 variants, although two frequent [334T>G (*2) and 699G>A (*4)] and one rare [1559A>C (*7)] nonsynonymous SNPs have been reported to result in dramatically altered transport of prototypical substrates and/or cellular localization in vitro.22,23 In this analysis, none of the studied SLCO1B3 variants was significantly associated with the pharmacokinetics of docetaxel. However, it is possible that individuals carrying the reduced-function alleles in SLCO1B3 can nevertheless efficiently accumulate docetaxel into hepatocytes through compensatory mechanisms such as the organic anion transporter OAT2. This possibility is supported by our observation that docetaxel is a substrate for this transporter, as is the related drug paclitaxel.24 In contrast to our data, obtained in Xenopus laevis oocytes, Yamaguchi et al. did not observe substantial transport of docetaxel by OATP1B3 in an overexpressed HEK293 cell model.25 This discrepancy likely results from differential expression of other transporters relevant to docetaxel transport in the two model systems.
In this study, an association was noted between the CYP3A4*1B and CYP3A5*3C variants and the clearance of docetaxel, particularly when these SNPs were assessed in combination. Specifically, the simultaneous presence of these two alleles was associated with a 64% increase in clearance. Unfortunately, in most other studies involving patients undergoing treatment with docetaxel such haplotype analyses were not performed.26–28 However, the current genotype–phenotype relationship is remarkably similar to data reported in a previous study involving a white population of cancer patients. In that study, four patients who were simultaneously carrying the CYP3A4*1B and CYP3A5*1A alleles showed a 75% increase in docetaxel clearance as compared to the 43 other patients.29 Previous investigations have shown that the CYP3A4*1B allele is most frequently associated with an increase in function.30 In addition, it has been reported that there is no significant difference in CYP3A4 content between human livers belonging to the CYP3A5*3C/*3C genotype and those that contain at least one CYP3A5*1A allele.31 However, the content of CYP3A4 and CYP3A5 combined was more than twofold higher in livers belonging to genotypes with at least one CYP3A5*1A allele.31 Theoretically, the predicted effect of the combined presence of the CYP3A4*1B and CYP3A5*1A alleles would be a more rapid hepatic metabolism of CYP3A substrates, which is consistent with the observed increase in clearance of both docetaxel and midazolam in carriers of the CYP3A4/5*2 haplotype. The lack of a similar association for erythromycin is possibly attributable to confounding genetic factors associated with variable expression and function of hepatocellular-localized solute carriers.32
Interestingly, an analysis of the CYP3A locus among the CEPH-HapMap samples revealed that the CYP3A4*1B allele is exclusively present among a subset of CYP3A5 expressors. Therefore the visual genotyping results, coupled with our in vivo observations, suggest that individuals with the CYP3A4/5*2 haplotype may have a higher level of CYP3A4. It is possible that the CYP3A4*1B SNP—either alone or in combination with other CYP3A4 promoter SNPs in linkage disequilibrium (including rs1851426, rs2140129, rs2140130, rs2177179, rs2687091, and rs2740566)—could affect CYP3A4 expression. A number of studies have reported that the CYP3A4*1B allele engineered into reporter plasmids is associated with increased transcriptional activity.33,34 However, the association of CYP3A4*1B with altered clearance of CYP3A substrates in vivo has been less reproducible.17,19,35,36 Our results suggest one crucial reason for this discrepancy, namely, that previous studies examining the effect of CYP3A4*1B genotypes on traits in white subjects have not carried out an initial segregation on the basis of CYP3A5 genotypes. Future studies involving white patients should first stratify the subjects on the basis of CYP3A5 genotype and then compare CYP3A activity between expressors and non-expressors of CYP3A5 with and without the CYP3A4*1B allele. Importantly, the current results cannot be extrapolated directly to other populations because the haplotype structure of the CYP3A locus is significantly different in populations of other ethnicities. For example, Asians completely lack the CYP3A4*1B allele; among African Americans the CYP3A4*1B allele is found on multiple haplotypes in both expressors and non-expressors of CYP3A5; and in Tanzanians it has been associated with lower CYP3A4 activity.37
The extent to which CYP3A4 metabolizes docetaxel is also likely to be determined, at least in part, by the intracellular residence time within hepatocytes. This process, in turn, is partly dependent on the efflux transporters ABCB1 and ABCC2, which are localized on the biliary surface of hepatocytes and are involved in secretion of docetaxel into the bile. In recent years, various genetic variants in ABCB1 and ABCC2 have been described that may affect transporter expression or function.12 In a previous study, Bosch et al. reported that the clearance of docetaxel was reduced by 25% in patients with the ABCB1 1236TT genotype.26 These authors went on to recommend that the dose of docetaxel should accordingly be reduced by 25% in such patients. In our study, none of the variant ABCB1 genotypes (including the 1236C>T SNP) or haplotypes was associated with docetaxel clearance, a finding that is in line with results reported by other investigators.27–29 Likewise, no associations were noted between the pharmacokinetics of docetaxel and ABCC2 genotype or haplotype variants. It should be noted that the absence of any association between gene variants and docetaxel clearance is consistent with preclinical observations. In mice, even the complete absence of either of these two transporters did not have any substantial influence on the systemic exposure to taxanes after intravenous administration.9,38 This finding supports the notion that metabolism is the predominant elimination mechanism for docetaxel and that (unlike for anticancer drugs such as irinotecan11 or methotrexate)39 the involvement of the ABC transporters in this process is relatively unimportant regardless of ABCB1 or ABCC2 genotype status.
In contrast to the negative data obtained with studies evaluating ABC transporter genotypes in relation to substrate pharmacokinetics, some recent studies have suggested that common allelic variants in the ABCB1 gene may influence the susceptibility to toxicity and treatment outcome independent of an effect on clearance.12 This paradox might be explained by the possibility that the high, genotype-dependent expression of ABCB1 in various target tissues such as bone marrow could directly control local intracellular drug levels, and that this might contribute to the altered pharmacodynamic effects of docetaxel without affecting measures of systemic exposure, as has been observed in some29,40 but not all studies.41
An interesting observation in our study was that, besides phenotypic CYP3A activity as determined using the ERMBT, sex was a significant independent variable affecting docetaxel clearance, with women having a 35% lower clearance than men. Sex-dependent clearance has also been reported recently for paclitaxel,42 adding to a growing body of evidence that the pharmacokinetics and toxicity of various anticancer drugs exhibit significant sex-related dimorphism.43 The current observation is also consistent with a previous study indicating that female patients treated with docetaxel are at increased risk for severe neutropenia.44
Collectively, this study indicates that the simultaneous presence of the CYP3A4*1B and CYP3A5*1A alleles is associated with a dramatically altered clearance of docetaxel in a white population. Incorporation of this genotype-related information should be explored further as a potential tool for identifying individuals who might be at increased risk for treatment failure following chemotherapy with docetaxel because of undertreatment.
Methods
In vitro transport studies
Generally labeled [3H]docetaxel was obtained from Moravek Biochemicals (Brea, CA). In all in vitro experiments, radiolabeled docetaxel was mixed with unlabeled drug (Sigma-Aldrich, St. Louis, MO) to the desired concentration. Xenopus laevis oocytes injected with OATP1A2, OATP1B1, OATP1B3, rOatp1b2 (Oatp4), OAT1, OAT3, OCT1, or SLC10A1 (NTCP) cRNA, along with water-injected controls, were obtained from BD Biosciences (Woburn, MA). Uptake experiments were performed as described previously.8
HEK293 cells stably transfected with OCT2 or OCT3 were obtained from Dr Heinz Bönisch (Bonn, Germany), and cells expressing OAT2 were provided by Dr Yuichi Sugiyama (Tokyo, Japan). All HEK293 transfectants, along with pcDNA vector–transfected controls, were cultured in Dulbecco's modifed Eagle's medium (Invitrogen, Carlsbad, CA) supplemented with 10% fetal bovine serum, penicillin (100 U/ml), streptomycin (100 μg/ml), and G418 sulfate (400–800 μg/ml) at 37 °C under 5% CO2 and 95% humidity. Prior to the transport experiments, HEK293 cells were seeded in six-well plates at a density of 5 × 10⁶ cells per well in 2 ml medium. When cells reached 95% confluence, sodium butyrate (5 μmol/l) was added to the medium for 24 h to induce expression of the respective transporter genes. Next, the transport experiment was initiated by adding serum-free medium containing [3H]docetaxel (total concentration, 0.2–5 μmol/l) to OCT- or OAT-expressing cells. At a predetermined time interval, the experiment was terminated by adding ice-cold phosphate-bufered saline after the removal of the incubation buffer. After being washed with ice-cold phosphate-buffered saline, the cells were mixed with 900 μl sodium hydroxide (1 N) for 20 min. An aliquot of 25 μl lysate was used for protein estimation using a bicinchoninic acid protein-assay kit (Pierce Biotechnology, Rockford, IL), and 600 μl were used for analysis of total radioactivity using an LS 6500 scintillation counter (Beckman Coulter, Fullerton, CA).
MDCKII parent cells, along with their ABCC2-transfected counterparts, and Saos-2 cells containing pcDNA empty vector, ABCG2, or ABCC4 were provided by Dr John Schuetz (Memphis, TN). These cells were maintained in DMEM containing 10% fetal bovine serum, penicillin (100 U/ml), streptomycin (100 μg/ml), and G418 sulfate (500 μg/ml; Saos-2 cells only) and were seeded in six-well plates at a density of 5 × 10⁵ per well. At 70% confluence, the cells were washed with phosphate-buffered saline, and the medium was replaced with fresh, serum-free medium containing [3H]docetaxel (total concentration, 5 μmol/l) for 4 h. At the end of drug incubation, the medium was removed and the cells were washed two times with ice-cold phosphate-buffered saline. The cells were then handled as described earlier for HEK293 cells.
Patients
Detailed eligibility criteria for selection of patients have been defined previously.5,45–47 Each patient had a pathologically confirmed diagnosis of a solid tumor for which docetaxel, given alone or in combination, was a reasonable therapeutic option. Additional common eligibility criteria included: age >18 years; adequate bone marrow function (absolute neutrophil count > 1.5 × 10⁹/l; platelet count > 100 × 109/l); adequate renal function [serum creatinine ≤ 2.0 × the upper limit of normal]; and adequate hepatic function (serum bilirubin ≤ 1.5 × upper limit of normal). The use of phenytoin, carbamazepine, rifampin, phenobarbital, St. John's wort, ketoconazole, or other compounds known to affect the pharmacokinetics of docetaxel was not allowed. The study protocols were approved by the local ethical review boards, and all patients provided written informed consent before they were enrolled in the study. Toxicity and efficacy data were not considered as pharmacodynamic end points in the study because different doses of docetaxel and schedules were used in the studied population.
Sample collection and analysis
Within 1 week before docetaxel administration, baseline CYP3A activity was assessed using the ERMBT as described previously.19 During the first course of treatment with docetaxel, blood samples were collected in tubes containing lithium heparin as anticoagulant and immediately centrifuged (at least 2,000g at 4 °C for 10 min) to separate plasma, which was then stored at or below −20 °C until analysis. These blood samples were obtained at the following time points: immediately before the infusion; 30 min after the start of the infusion; immediately before the end of the infusion; and 10 and 30 min, 1, 3, 7, 24, and 48 h, and on days 8, 15, and 22 after the end of the infusion. Docetaxel concentrations in plasma were determined using high-performance liquid chromatography with tandem mass-spectrometric detection in accordance with a validated procedure.48 Te lower limit of quantification using 1,000 μl plasma samples was 0.5 nmol/l (∼0.4 ng/ml).
Noncompartmental analysis
Individual plasma concentrations of docetaxel were analyzed by noncompartmental methods using WinNonlin version 5.0 (Pharsight, Mountain View, CA). The primary pharmacokinetic parameter, clearance, was calculated as dose divided by the area under the plasma concentration-time curve, extrapolated to infinity.
Genotyping procedures
Genomic DNA was extracted from 1 ml of whole blood using the UltraSens Virus kit (Qiagen, Valencia, CA), and the REPLI-g mini/midi kit (Qiagen) was used for amplifying genomic DNA in case of limited sample availability. SNPs in SLCO1B3 were identified from the literature23 and SNPs of interest in the CYP3A4, CYP3A5, ABCB1, and ABCC2 genes were selected on the basis of the predicted frequency of occurrence and/or the anticipated phenotypic change.11,12,30 Variations in CYP3A4 (CYP3A4*1B) and CYP3A5 (CYP3A5*3C) were initially analyzed using restriction fragment length polymorphism–based techniques, as described previously.13,14 Direct nucleotide sequencing was used on samples for which no reliable genotype was obtained from the restriction fragment length polymorphism assay. Primers for all genetic variants were designed using Primer version 5.0 (Table 4), and PCRs were performed using the HotStart Taq Master Mix (Qiagen, Valencia, CA). The efficiency and quality of PCR for all genes were confirmed by running the PCR products on a 1.5%-agarose gel. After cleanup using ExoSAP-IT (USB, Cleveland, OH), the PCR products were subjected to direct sequencing. Sequence analysis was performed with Sequencher Version 4.5 (Gene Codes, Ann Arbor, MI). The genotype was termed “variant” if it differed from the Refseq consensus sequence for the SNP position (http://www.ncbi.nlm.nih.gov/RefSeq/). Genotype-frequency analyses of Hardy–Weinberg equilibrium, linkage disequilibrium (D′), and haplotypes were carried out using the Polymorphism and Haplotype Analysis Suite version 0.9.49
Table 4. PcR primer sequences.
| Polymorphism | Forward 5′-3′ | Reverse 5′-3′ |
|---|---|---|
| SLCO1B3 334T>G | CATGGTCTTTG AGGGAAGGT |
AGGAAATATACTC CATTTCTCTATGC |
| SLCO1B3 439A>G | CAGCGGTTCAA ATAAAGGAGA |
TGTGTTGTTTA AGAATCGACTGC |
| SLCO1B3 699G>A | AAAAGCATGTTA AATGAAAACCA |
GGAAGAATGG TGTCCTGCAC |
| SLCO1B3 767G>C | ACATTTGGTTTA CTTTCTTCATCTAT |
AATCCTCTT CCCCTTTTTAT |
| SLCO1B3 1559A> | GGGAGCTATTT TGCCTTCAC |
TGTCAATCAGT GTGTGCCTTA |
| SLCO1B3 1679T>C | GGGAGCTATT TTGCCTTCAC |
TGTCAATCAGT GTGTGCCTTA |
| CYP3A4 −392A>G | TGGGATGAATT TCAAGTATTTTG |
CAGATAAGGG AAAGAGAGGC |
| CYP3A5 6986A>G | CCTGCCTTCAA TTTTTCACTG |
GCAATGTAGGA AGGAGGGCT |
| ABCB1 1236C>T | TGAACAGTCAG TTCCTATATCCTG |
TGTGCAATGT GACTGCTGAT |
| ABCB1 2677G>T/A | GCAGGCTATAG GTTCCAGGCT |
TGAGGAATGG TTATAAACACAT |
| ABCB1 3435C>T | TCACAGTAACT TGGCAGTTTCAG |
ACTATAGGCC AGAGAGGCTG |
| ABCC2 −1019A>G | TCCTTTGACTC CTTTCCTTCTTT |
GCCTCAGCTT CCTGAGTAGC |
|
*GGATTTTGACA ATTGCAT TCC |
*ACTACAGGC ACATGCCAACA |
|
| ABCC2 −24C>T | TGTCCTTAGGAAA ATGAAAGACTG |
TTGCACATCTA ACATTTCTGGTT |
|
*ATTTGTTGGCC AGCTCTGTT |
*TCTTGTTGG TGACCACCCTA |
|
| ABCC2 1249G>A | GGGCAAAGAA GTGTGTGGAT |
CAGCAGAGCA AGATGGAAGA |
|
*GGAGCACAT CCTTCCATTGT |
*TTGCCCAAAC TCCCATTAAG |
|
| ABCC2 IVS26 −34T>C | CATGATTCCG TCCTCTGCTT |
ACCTCATTTTC CACTTTTGTGT |
|
*TTCCGTCCTC TGCTTTCTGT |
*CAACAGCCAC AATGTTGGTC |
|
| ABCC2 3972C>T | GGAACTTTCCA AAAGTGCAAG |
GTGTGATCC CTGGCTGCTAT |
|
*TAGCTGGGAC ACTGCTACCC |
*CTTTCCCTC CATCCAAATGA |
|
| ABCC2 4544G>A | GGCACCCTT TGTAAACCAAT |
TGCACCTATTT GCATCACCA |
|
*GATGTGTGTA GCTGTGGCTCA |
*CAGAAATGAA AGGCAAAGGAA |
Nested.
Statistical considerations
Pharmacokinetic data are presented as a median value along with the range of values, unless stated otherwise. The association of variant genotypes or haplotypes with the clearance of docetaxel was analyzed using a two-tailed Mann–Whitney U-test (two-group comparisons) or a Kruskal–Wallis test (multiple-group comparisons). For the purpose of relating continuous variables with clearance, a correlation test was performed. Relationships between clearance and two or more independent variables were assessed using multiple regression analysis. P < 0.05 was considered statistically significant. All calculations were performed using the software package NCSS v2005 (J. Hintze, Kaysville, UT).
Acknowledgments
We thank Roxann Ingersoll (Baltimore, MD) for assistance with the sequence analysis. This study was supported in part by Aventis Pharmaceuticals grant-in-aid no. 19075 (to S.D.B.), the American Lebanese Syrian Associated Charities, and National Institutes of Health grant U01 GM61393 (to E.G.S.).
Footnotes
Conflict of Interest: M.A.C. is a consultant to and on the speakers' bureau of Sanofi-Aventis. The other authors declared no conflict of interest.
References
- 1.Baker SD, Sparreboom A, Verweij J. Clinical pharmacokinetics of docetaxel: recent developments. Clin Pharmacokinet. 2006;45:235–252. doi: 10.2165/00003088-200645030-00002. [DOI] [PubMed] [Google Scholar]
- 2.Bruno R, et al. Population pharmacokinetics/pharmacodynamics of docetaxel in phase II studies in patients with cancer. J Clin Oncol. 1998;16:187–196. doi: 10.1200/JCO.1998.16.1.187. [DOI] [PubMed] [Google Scholar]
- 3.Bruno R, et al. Alpha-1-acid glycoprotein as an independent predictor for treatment effects and a prognostic factor of survival in patients with non-small cell lung cancer treated with docetaxel. Clin Cancer Res. 2003;9:1077–1082. [PubMed] [Google Scholar]
- 4.Veyrat-Follet C, Bruno R, Olivares R, Rhodes GR, Chaikin P. Clinical trial simulation of docetaxel in patients with cancer as a tool for dosage optimization. Clin Pharmacol Ther. 2000;68:677–687. doi: 10.1067/mcp.2000.111948. [DOI] [PubMed] [Google Scholar]
- 5.Hooker AC, et al. Population pharmacokinetic model for docetaxel in patients with varying degrees of liver function: incorporating cytochrome P450 3A activity measurements. Clin Pharmacol Ther. doi: 10.1038/sj.clpt.6100476. [DOI] [PMC free article] [PubMed] [Google Scholar]
- 6.Shou M, Martinet M, Korzekwa KR, Krausz KW, Gonzalez FJ, Gelboin HV. Role of human cytochrome P450 3A4 and 3A5 in the metabolism of taxotere and its derivatives: enzyme specificity, interindividual distribution and metabolic contribution in human liver. Pharmacogenetics. 1998;8:391–401. doi: 10.1097/00008571-199810000-00004. [DOI] [PubMed] [Google Scholar]
- 7.van Herwaarden AE, et al. Knockout of cytochrome P450 3A yields new mouse models for understanding xenobiotic metabolism. J Clin Invest. 2007;117:3583–3592. doi: 10.1172/JCI33435. [DOI] [PMC free article] [PubMed] [Google Scholar]
- 8.Smith NF, Acharya MR, Desai N, Figg WD, Sparreboom A. Identification of OATP1B3 as a high-afinity hepatocellular transporter of paclitaxel. Cancer Biol Ther. 2005;4:815–818. doi: 10.4161/cbt.4.8.1867. [DOI] [PubMed] [Google Scholar]
- 9.Bardelmeijer HA, et al. Low systemic exposure of oral docetaxel in mice resulting from extensive first-pass metabolism is boosted by ritonavir. Cancer Res. 2002;62:6158–6164. [PubMed] [Google Scholar]
- 10.Huisman MT, Chhatta AA, van Tellingen O, Beijnen JH, Schinkel AH. MRP2 (ABCC2) transports taxanes and confers paclitaxel resistance and both processes are stimulated by probenecid. Int J Cancer. 2005;116:824–829. doi: 10.1002/ijc.21013. [DOI] [PubMed] [Google Scholar]
- 11.de Jong FA, et al. Irinotecan-induced diarrhea: functional significance of the polymorphic ABCC2 transporter protein. Clin Pharmacol Ther. 2007;81:42–49. doi: 10.1038/sj.clpt.6100019. [DOI] [PubMed] [Google Scholar]
- 12.Sparreboom A, Danesi R, Ando Y, Chan J, Figg WD. Pharmacogenomicsof ABC transporters and its role in cancer chemotherapy. Drug Resist Updat. 2003;6:71–84. doi: 10.1016/s1368-7646(03)00005-0. [DOI] [PubMed] [Google Scholar]
- 13.van Schaik RH, de Wildt SN, van Iperen NM, Uitterlinden AG, van den Anker JN, Lindemans J. CYP3A4-V polymorphism detection by PCR-restriction fragment length polymorphism analysis and its allelic frequency among 199 Dutch Caucasians. Clin Chem. 2000;46:1834–1836. [PubMed] [Google Scholar]
- 14.van Schaik RH, van den Heiden IP, van den Anker JN, Lindemans J. CYP3A5 variant allele frequencies in Dutch Caucasians. Clin Chem. 2002;48:1668–1671. [PubMed] [Google Scholar]
- 15.Xu G, Bhatnagar V, Wen G, Hamilton BA, Eraly SA, Nigam SK. Analysesof coding region polymorphisms in apical and basolateral human organic anion transporter (OAT) genes [OAT1 (NKT), OAT2, OAT3, OAT4, URAT (RST)] Kidney Int. 2005;68:1491–1499. doi: 10.1111/j.1523-1755.2005.00612.x. [DOI] [PubMed] [Google Scholar]
- 16.Smith NF, et al. Variants in the SLCO1B3 gene: interethnic distribution and association with paclitaxel pharmacokinetics. Clin Pharmacol Ther. 2007;81:76–82. doi: 10.1038/sj.clpt.6100011. [DOI] [PubMed] [Google Scholar]
- 17.Lepper ER, et al. Effect of common CYP3A4 and CYP3A5 variants on the pharmacokinetics of the cytochrome P450 3A phenotyping probe midazolam in cancer patients. Clin Cancer Res. 2005;11:7398–7404. doi: 10.1158/1078-0432.CCR-05-0520. [DOI] [PubMed] [Google Scholar]
- 18.Wojnowski L, et al. Re: modification of clinical presentation of prostate tumors by a novel genetic variant in CYP3A4. J Natl Cancer Inst. 2002;94:630–631. doi: 10.1093/jnci/94.8.630. [DOI] [PubMed] [Google Scholar]
- 19.Baker SD, et al. Factors affecting cytochrome P-450 3A activity in cancer patients. Clin Cancer Res. 2004;10:8341–8350. doi: 10.1158/1078-0432.CCR-04-1371. [DOI] [PubMed] [Google Scholar]
- 20.Wang J, et al. Impact of ABCB1 (MDR1) haplotypes on tacrolimus dosing in adult lung transplant patients who are CYP3A5 *3/*3 non-expressors. Transpl Immunol. 2006;15:235–240. doi: 10.1016/j.trim.2005.08.001. [DOI] [PubMed] [Google Scholar]
- 21.Smith NF, Figg WD, Sparreboom A. Role of the liver-specific transporters OATP1B1 and OATP1B3 in governing drug elimination. Expert Opin Drug Metab Toxicol. 2005;1:429–445. doi: 10.1517/17425255.1.3.429. [DOI] [PubMed] [Google Scholar]
- 22.Letschert K, Keppler D, König J. Mutations in the SLCO1B3 gene affecting the substrate specificity of the hepatocellular uptake transporter OATP1B3 (OATP8) Pharmacogenetics. 2004;14:441–452. doi: 10.1097/01.fpc.0000114744.08559.92. [DOI] [PubMed] [Google Scholar]
- 23.Schwarz UI, Dixit SG, Leake BF, Kim RB. Identification and functional characterization of OATP1B3 allelic variants using transfected HeLa cells. Drug Metab Rev. 2006;38237 [Google Scholar]
- 24.Kobayashi Y, Ohshiro N, Sakai R, Ohbayashi M, Kohyama N, Yamamoto T. Transport mechanism and substrate specificity of human organic anion transporter 2 (hOat2 [SLC22A7]) J Pharm Pharmacol. 2005;57:573–578. doi: 10.1211/0022357055966. [DOI] [PubMed] [Google Scholar]
- 25.Yamaguchi H, et al. Rapid screening of antineoplastic candidates for the human organic anion transporter OATP1B3 substrates using fluorescent probes. Cancer Lett. 2008;260:163–169. doi: 10.1016/j.canlet.2007.10.040. [DOI] [PubMed] [Google Scholar]
- 26.Bosch TM, et al. Pharmacogenetic screening of CYP3A and ABCB1 in relation to population pharmacokinetics of docetaxel. Clin Cancer Res. 2006;12:5786–5793. doi: 10.1158/1078-0432.CCR-05-2649. [DOI] [PubMed] [Google Scholar]
- 27.Goh BC, et al. Explaining interindividual variability of docetaxel pharmacokinetics and pharmacodynamics in Asians through phenotyping and genotyping strategies. J Clin Oncol. 2002;20:3683–3690. doi: 10.1200/JCO.2002.01.025. [DOI] [PubMed] [Google Scholar]
- 28.Lewis LD, et al. A comparison of the pharmacokinetics and pharmacodynamics of docetaxel between African-American and Caucasian cancer patients: CALGB 9871. Clin Cancer Res. 2007;13:3302–3311. doi: 10.1158/1078-0432.CCR-06-2345. [DOI] [PubMed] [Google Scholar]
- 29.Tran A, et al. Pharmacokinetics and toxicity of docetaxel: role of CYP3A, MDR1, and GST polymorphisms. Clin Pharmacol Ther. 2006;79:570–580. doi: 10.1016/j.clpt.2006.02.003. [DOI] [PubMed] [Google Scholar]
- 30.Daly AK. Significanceof the minor cytochrome P450 3A isoforms. Clin Pharmacokinet. 2006;45:13–31. doi: 10.2165/00003088-200645010-00002. [DOI] [PubMed] [Google Scholar]
- 31.Lin YS, et al. Co-regulation of CYP3A4 and CYP3A5 and contribution to hepatic and intestinal midazolam metabolism. Mol Pharmacol. 2002;62:162–172. doi: 10.1124/mol.62.1.162. [DOI] [PubMed] [Google Scholar]
- 32.Franke RM, Baker SD, Mathijssen RH, Schuetz EG, Sparreboom A. Influence of solute carriers on the pharmacokinetics of CYP3A4 probes. Clin Pharmacol Ther. doi: 10.1038/clpt.2008.94. [DOI] [PubMed] [Google Scholar]
- 33.Amirimani B, Ning B, Deitz AC, Weber BL, Kadlubar FF, Rebbeck TR. Increasedtranscriptional activity of the CYP3A4*1B promoter variant. Environ Mol Mutagen. 2003;42:299–305. doi: 10.1002/em.10199. [DOI] [PubMed] [Google Scholar]
- 34.Hamzeiy H, Bombail V, Plant N, Gibson G, Goldfarb P. Transcriptional regulation of cytochrome P4503A4 gene expression: effects of inherited mutations in the 5′-flanking region. Xenobiotica. 2003;33:1085–1095. doi: 10.1080/00498250310001609165. [DOI] [PubMed] [Google Scholar]
- 35.Ando Y, et al. Re: modification of clinical presentation of prostate tumors by a novel genetic variant in CYP3A4. J Natl Cancer Inst. 1999;91:1587–1590. doi: 10.1093/jnci/91.18.1587. [DOI] [PubMed] [Google Scholar]
- 36.Spurdle AB, et al. The CYP3A4*1B polymorphism has no functional significance and is not associated with risk of breast or ovarian cancer. Pharmacogenetics. 2002;12:355–366. doi: 10.1097/00008571-200207000-00003. [DOI] [PubMed] [Google Scholar]
- 37.Rodríguez-Antona C, Sayi JG, Gustafsson LL, Bertilsson L, Ingelman-Sundberg M. Phenotype-genotype variability in the human CYP3A locus as assessed by the probe drug quinine and analyses of variant CYP3A4 alleles. Biochem Biophys Res Commun. 2005;338:299–305. doi: 10.1016/j.bbrc.2005.09.020. [DOI] [PubMed] [Google Scholar]
- 38.Lagas JS, et al. Multidrug resistance protein 2 is an important determinant of paclitaxel pharmacokinetics. Clin Cancer Res. 2006;12:6125–6132. doi: 10.1158/1078-0432.CCR-06-1352. [DOI] [PubMed] [Google Scholar]
- 39.Rau T, Erney B, Göres R, Eschenhagen T, Beck J, Langer T. High-dose methotrexate in pediatric acute lymphoblastic leukemia: impact of ABCC2 polymorphisms on plasma concentrations. Clin Pharmacol Ther. 2006;80:468–476. doi: 10.1016/j.clpt.2006.08.012. [DOI] [PubMed] [Google Scholar]
- 40.Sissung T, et al. ABCB1 genetic variation influences the toxicity and clinical outcome of patients treated with docetaxel. Clin Cancer Res. doi: 10.1158/1078-0432.CCR-07-4230. [DOI] [PMC free article] [PubMed] [Google Scholar]
- 41.Marsh S, Paul J, King CR, Gifford G, McLeod HL, Brown R. Pharmacogenetic assessment of toxicity and outcome after platinum plus taxane chemotherapy in ovarian cancer: the Scottish Randomised Trial in Ovarian Cancer. J Clin Oncol. 2007;25:4528–4535. doi: 10.1200/JCO.2006.10.4752. [DOI] [PubMed] [Google Scholar]
- 42.Joerger M, Huitema AD, van den Bongard DH, Schellens JH, Beijnen JH. Quantitativeeffect of gender, age, liver function, and body size on the population pharmacokinetics of paclitaxel in patients with solid tumors. Clin Cancer Res. 2006;12:2150–2157. doi: 10.1158/1078-0432.CCR-05-2069. [DOI] [PubMed] [Google Scholar]
- 43.Wang J, Huang Y. Pharmacogenomics of sex difference in chemotherapeutic toxicity. Curr Drug Discov Technol. 2007;4:59–68. doi: 10.2174/157016307781115485. [DOI] [PubMed] [Google Scholar]
- 44.Kloft C, Wallin J, Henningsson A, Chatelut E, Karlsson MO. Populationpharmacokinetic-pharmacodynamic model for neutropenia with patient subgroup identification: comparison across anticancer drugs. Clin Cancer Res. 2006;12:5481–5490. doi: 10.1158/1078-0432.CCR-06-0815. [DOI] [PubMed] [Google Scholar]
- 45.Messersmith WA, et al. Phase I trial of bortezomib in combination with docetaxel in patients with advanced solid tumors. Clin Cancer Res. 2006;12:1270–1275. doi: 10.1158/1078-0432.CCR-05-1942. [DOI] [PubMed] [Google Scholar]
- 46.Sinibaldi VJ, et al. Phase II evaluation of docetaxel plus exisulind in patients with androgen independent prostate carcinoma. Am J Clin Oncol. 2006;29:395–398. doi: 10.1097/01.coc.0000225411.95479.b4. [DOI] [PubMed] [Google Scholar]
- 47.ten Tije AJ, et al. Prospective evaluation of the pharmacokinetics and toxicity profile of docetaxel in the elderly. J Clin Oncol. 2005;23:1070–1077. doi: 10.1200/JCO.2005.03.082. [DOI] [PubMed] [Google Scholar]
- 48.Baker SD, Zhao M, He P, Carducci MA, Verweij J, Sparreboom A. Simultaneous analysis of docetaxel and the formulation vehicle polysorbate 80 in human plasma by liquid chromatography/tandem mass spectrometry. Anal Biochem. 2004;324:276–284. doi: 10.1016/j.ab.2003.09.038. [DOI] [PubMed] [Google Scholar]
- 49.Schaid DJ, McDonnell SK, Wang L, Cunningham JM, Thibodeau SN. Cautionon pedigree haplotype inference with software that assumes linkage equilibrium. Am J Hum Genet. 2002;71:992–995. doi: 10.1086/342666. [DOI] [PMC free article] [PubMed] [Google Scholar]