Abstract
Objective: The purpose of this study was to explore the diagnostic performance of apparent diffusion coefficient (ADC) values for breast lesions by different measuring methods and find out the optimum measuring method. Methods: ADCW-mean and ADCW-min were obtained by whole-measurement method, while ADCmean and ADCmin were extracted by spot-measurement method. Four ADCs were analyzed by One-way ANOVA and Independent T-test. The diagnostic performances of these four ADCs were calculated by receiver operating characteristics (ROC) curves and the area under the curves (AUC) were compared through Z-test. Results: For the whole-measurement method, there were significant differences between malignant and benign lesions (ADCW-mean=1.014±0.197 for malignant, ADCW-mean=1.650±0.348 for benign, F=37.511, P<0.001; ADCW-min=0.627±0.144 for malignant, ADCW-min=1.245±0.290 for benign, F=41.446, P<0.001), as well as the spot-measurement method (ADCmean=1.010±0.234 for malignant, ADCmean=1.648±0.392 for benign, F=34.580, P<0.001; ADCmin=0.817±0.203 for malignant, ADCmin=1.411±0.357 for benign, F=40.039, P<0.001). The optimal diagnostic threshold of ADCW-mean, ADCW-min, ADCmean, and ADCmin values were 1.223×10⁻³ mm2/s, 0.897×10⁻³ mm2/s, 1.315×10⁻³ mm2/s, and 1.111×10⁻³ mm2/s, respectively. ROC curves indicated that the AUC for ADCW-min (0.969) was statistically significant higher than the AUC for ADCW-mean (0.940; Z=2.473, p=0.013), ADCmean (0.919; Z=3.691, P=0.000), and ADCmin (0.928; Z=3.634, P=0.000). The AUC for ADCW-mean was also significantly higher than the AUC for ADCmean (Z=2.863, P=0.004). Conclusion: The results provided evidence that the most reliable and accurate value in demonstrating the limitation of diffusion may be ADCW-min, and it has the highest diagnostic value in distinguishing breast lesions from malignant to benign.
Keywords: Diagnostic performance, apparent diffusion coefficient, breast lesions
Introduction
Worldwide, breast cancer is the most common disease among women. The incidence of breast cancer, which is a heterogeneous breast lesion with highly variable biological behavior, is higher than most of the other women’s malignant diseases. Its treatment and prognosis are much more different from those of breast benign lesion. Therefore, correct diagnosis of breast lesion is of great value in developing the therapy. With the highly development of magnetic resonance (MR) technology, MR imaging has been a promising modality in the differentiate breast lesions and evaluate local extent of lesions.
MR diffusion-weighted imaging (DWI) has been widely applied to the diagnosis of breast lesions. DWI is an essential imaging modality for diagnosis and management of breast lesions and is currently the only noninvasive technique used for detecting Brownian motion of bulk water molecules in vivo. It quantifies the limitation of Brownian motion on these molecules through apparent diffusion coefficient (ADC) values. The ADC values have relatively high sensitivity and specificity in cancer detection [1,2]. However, the method of measurement on the ADC values is not constant. There is no uniform standard towards the choice of regions of interests (ROIs) when measuring the ADCs. Most of the literatures discuss about the factors affecting ADC values. To our knowledge, studies rarely measure the ADCs in different ROIs and evaluate its values in the diagnosis of breast lesions. The aim of this study is to investigate the diagnostic value of different measuring methods on ADC values and try to obtain the best method in the differentiation of breast lesions.
Materials and methods
Patients
This study was approved by the Institution Review Board of Guangxi Medical University and an informed consent was obtained from each patient. Two hundred patients (with 248 lesions) were consecutively recruited from March 2011 to March 2013 at the Affiliated Cancer Hospital of Guangxi Medical University (Nanning, People’s Republic of China). Two hundred patients (mean age, 46.81 years; range, 17~80 years) with breast lesions were underwent preoperative breast MRI with DWI. Among these patients, only one was male, and the others were female. All of them had met the following criteria: (a) Without any biopsy or interventional therapy or medical treatment performed on breast lesions before the MR imaging scan; (b) The breast lesions were confirmed by histopathological examination of specimens obtained by excision biopsy, core biopsy, or fine-needle aspiration.
MRI imaging protocol
MR imaging was performed with a 1.5 Tesla (T) clinical MR imaging system (Magnetom Avanto, Siemens Healthcare, Erlangen, Germany) equipped with a dedicated eight-channel phased array breast coil in the prone position. A transverse T2-weighted TIRM pulse sequence was performed with 5600/59/180 (repetition time/echo time/inversion time) ms, a 4 mm section thickness, a 0.8 mm intersection gap, a field of view of 34×34 cm, a matrix of 314×320. A transverse T1-weighted FLASH pulse sequence was performed with 8.6/4.7 (repetition time/echo time[TR/TE]), a 1mm section thickness, a 0.2 mm intersection gap, a field of view of 32×32 cm, a matrix of 323×448. DWI MR images were acquired in the axial planes by using an echo-planar imaging sequence, parallel imaging with sensitivity encoding (acceleration factor of two), fat suppression (in a spectral selective attenuated inversion-recovery sequence), volume shimming, b values of 0 and 800 s/mm2, TR/TE/TI=5800/86/180 ms, a 6 mm section thickness, a 0.2 mm intersection gap, a field of view of 32×32 cm, and a matrix of 323×448. The ADC maps were created automatically by the system from the trace-weighted images with b values of 0 and 800. ADC values were calculated according to the following formula: ADC=-(1/b) ln (S2/S1), where the S2 and S1 are the signal intensities at b value of 800 and 0, respectively.
ROI measurement
ADC values were measured according to two distinct regions of interests (ROI) measurement methods: (1) whole-measurement, (2) spot-measurement. For the whole-measurement method, ROIs were freehanded along the border of tumor on ADC figures in order to cover the entire lesion areas, while the obviously necrotic, liquescent, hemorrhagic, cystic, or calcified areas were excluded (based on T1WI, T2WI, and dynamic contrast-enhanced MRI figures) [3-5]. Mean ADC (ADCW-mean) and minimum ADC (ADCW-min) values of ROIs were figured out. For the spot-measurement method, ROIs were randomly drawn to extract three circles with 5-10 mm in diameter in different positions of lesions, while the areas with obvious necrosis, liquefactions, hemorrhage, cystic, or calcification were excluded (based on T1WI, T2WI, and dynamic contrast-enhanced MRI figures) [6-10]. Mean ADC (ADCmean) and minimum ADC (ADCmin) values were also calculated (Figures 1, 2 and 3). These measurements were completed by two experienced radiologists (Dong Xie, with 20 years of experience in reading breast MRI; Guanqiao Jin, with 15 years of experience in reading breast MRI) who were blinded to the pathological diagnosis and clinical examinations.
Figure 1.
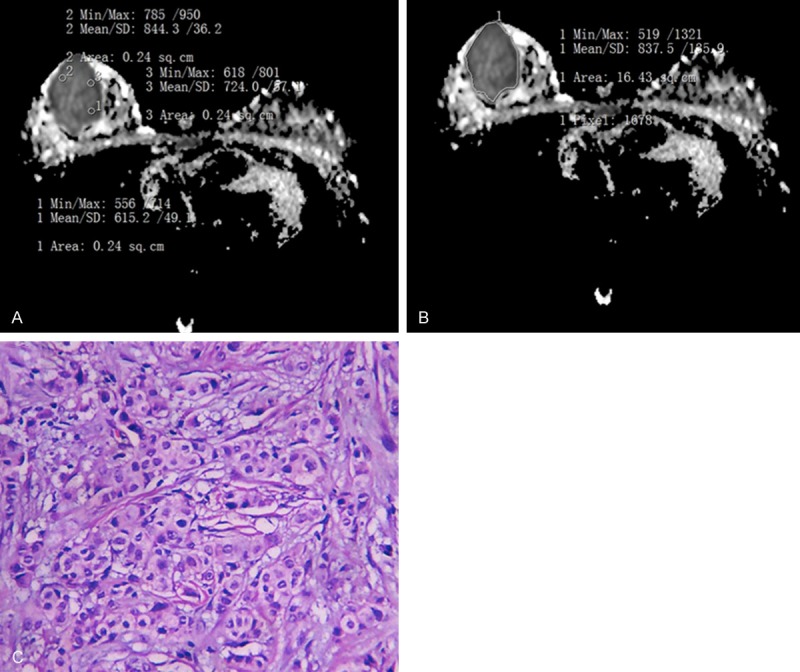
Pathological of invasive ductal carcinoma in right breast. A. Was for the Whole-measurement method (ADCW-mean =0.838×10⁻³ mm2/s; ADCW-min =0.519×10⁻³ mm2/s). B. Was for the spot-measurement method (ADCmean =0.728×10⁻³ mm2/s; ADCmin =0.653×10⁻³ mm2/s). C. Was Photomicrograph (hematoxylin-eosin staining, original magnification 100×) method.
Figure 2.
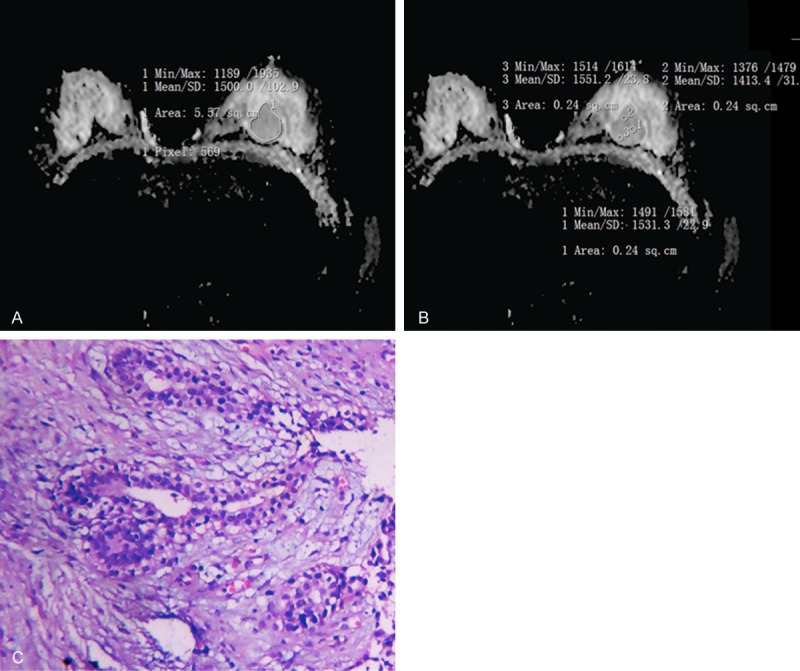
Pathological of fibroadenoma in left breast. A. Was for the Whole-measurement method (ADCW-mean =1.5×10⁻³ mm2/s; ADCW-min =1.189×10⁻³ mm2/s). B. Was for the spot-measurement method (ADCmean =1.498×10⁻³ mm2/s; ADCmin = 1.46×10⁻³ mm2/). C. Was Photomicrograph (hematoxylin-eosin staining, original magnification 100×) method.
Figure 3.
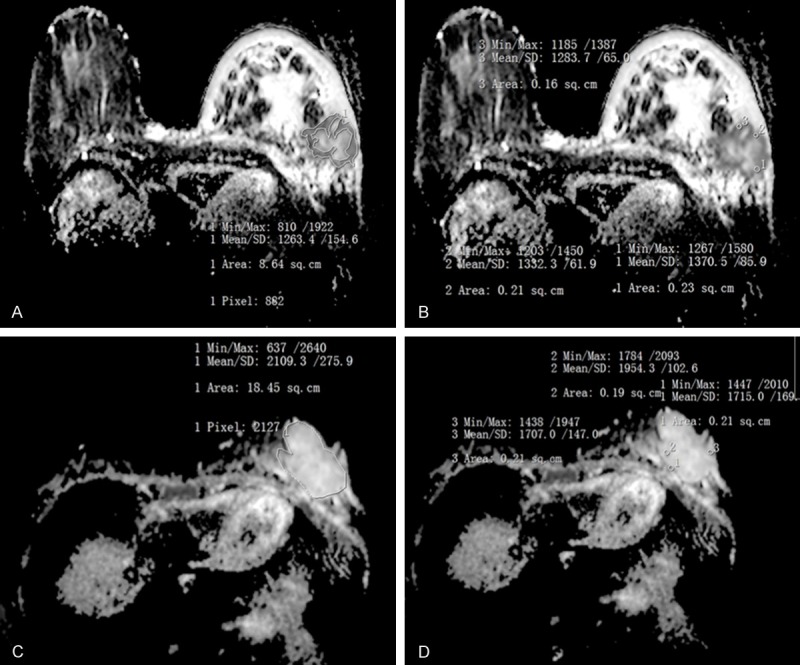
A. and C. were for the whole-measurement method; B. and D. were for the spot-measurement method. A, B. 68-year-old woman with invasive ductal carcinoma in left breast. ADCW-min =0.81×10⁻³ mm2/s, ADCW-mean =1.263×10⁻³ mm2/s, ADCmin =1.218×10⁻³ mm2/s, ADCmean =1.329×10⁻³ mm2/s; Based on the optimal threshold of this study, ADCW-min values were considered to be malignant lesions, while ADCmean, ADCmin, and ADCW-mean values were diagnosed to be benign lesions; C, D. 33-year-old woman with mucinous carcinoma in left breast, ADCW-min =0.637×10⁻³ mm2/s, ADCW-mean =2.109×10⁻³ mm2/s, ADCmin =1.556×10⁻³ mm2/s, ADCmean =1.792×10⁻³ mm2/s. Based on the optimal threshold of this study, ADCW-min was diagnosed as malignant lesion, but ADCmean, ADCmin, and ADCW-mean were diagnosed to be benign lesions.
Statistical analysis
Results were expressed as mean ± standard deviation (x̅±SD). Four ADCs for distinguishing breast lesion from benign to malignant were analyzed by One-way ANOVA and Independent T-test with SPSS 16.0 software. The diagnostic performances of four ADC values (ADCW-mean, ADCW-min, ADCmean, and ADCmin) were calculated by receiver operating characteristics (ROC) curves and the area under the curves (AUC) were compared through Z-test using MedCalc V13.0.2.0 software. When Youden index reached the highest point, sensitivity (SE), specificity (SP), positive predictive value (PPV), and negative predictive value (NPV) were calculated. A p-value of less than 0.05 was judged as statistically significant.
Results
Eighty-five benign breast lesions were confirmed by pathology: 49.41% (42/85) were diagnosed as cyclomastopathy, 25.88% (22/85) were fibroadenoma, 5.88% (5/85) were benign phyllodes tumor, 4.71% (4/85) were cyclomastopathy accompanied with infection, 3.53% (3/85) were granulomatous mastitis, 2.35% (2/85) were fibroadenoma accompanied with infection, 2.35% (2/85) were breast tuberculosis, 2.35% (2/85) were chronic suppurative mastitis, 2.35% (2/85) were intraduct papilloma, and 1.18% (1/85) were gynecomastia. Among one hundred and sixty-three lesions of malignant breast lesions, 87.12% (142/163) were invasive ductal carcinoma, 7.36% (12/163) were ductal carcinoma in situ, 1.84% (3/163) were invasive lobular carcinoma, 1.23% (2/163) were mucinous carcinoma, 1.23% (2/163) were tubular carcinoma; 0.61% (1/163) were malignant phyllodes tumor with rhabdomyosarcoma, and 0.61% (1/163) were papillary carcinoma (Table 1).
Table 1.
Histopathological diagnoses of breast lesions
| Histological findings | Number of lesions (%) |
|---|---|
| Benign lesions | 85 |
| cyclomastopathy | 42 (49.4) |
| fibroadenoma | 22 (25.9) |
| benign phyllodes tumor | 5 (5.9) |
| cyclomastopathy accompanied with infection | 4 (4.7) |
| granulomatous mastitis | 3 (3.5) |
| fibroadenoma accompanied with infection | 2 (2.3) |
| breast tuberculosis | 2 (2.3) |
| intraduct papilloma | 2 (2.3) |
| chronic suppurative mastitis | 2 (2.3) |
| gynecomastia | 1 (1.2) |
| Malignant lesions | 163 |
| invasive ductal carcinoma | 142 (87.1) |
| ductal carcinoma in situ | 12 (7.3) |
| invasive lobular carcinoma | 3 (1.8) |
| mucinous carcinoma | 2 (1.2) |
| tubular carcinoma | 2 (1.2) |
| malignant phyllodes tumor with rhabdomyosarcoma | 1 (0.6) |
| papillary carcinoma | 1 (0.6) |
For the whole-measurement method, there were significant differences between malignant and benign lesions (ADCW-mean=1.014±0.197 for malignant, ADCW-mean=1.650±0.348 for benign, F=37.511, P<0.001; ADCW-min=0.627±0.144 for malignant, ADCW-min=1.245±0.290 for benign, F=41.446, P<0.001), as well as the spot-measurement method (ADCmean=1.010±0.234 for malignant, ADCmean=1.648±0.392 for benign, F=34.580, P<0.001; ADCmin=0.817±0.203 for malignant, ADCmin=1.411±0.357 for benign, F=40.039, P<0.001) (Table 2; Figure 4).
Table 2.
Four ADCs in the diagnosis of breast lesions by Independent T-test
| Breast lesions | ADCW-mean | ADCW-min | ADCmean | ADCmin |
|---|---|---|---|---|
| Malignant | 1.014±0.197 | 0.627±0.144 | 1.010±0.234 | 0.817±0.203 |
| Benign | 1.650±0.348 | 1.245±0.290 | 1.648±0.392 | 1.411±0.357 |
| F | 37.511 | 41.466 | 34.580 | 40.039 |
| p value | P<0.001 | P<0.001 | P<0.001 | P<0.001 |
ADC, apparent diffusion coefficient.
Figure 4.
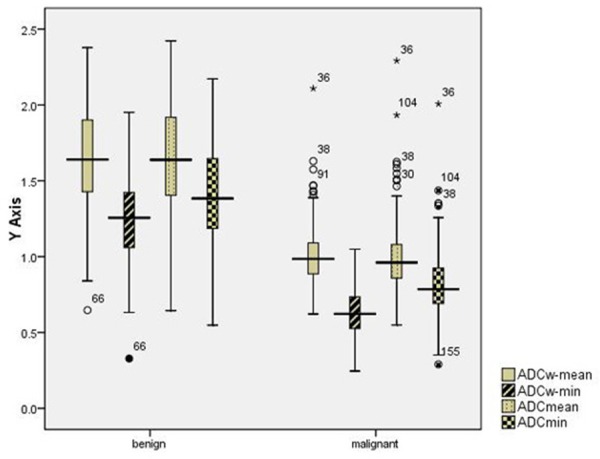
Box plots graphs of parameters obtained in different ADCs measurement methods demonstrate a significant difference (P<0.05) between benign and malignant lesions. ○= outlier, *= extreme value.
When their Youden index reached the highest points, the optimal diagnostic threshold of ADCW-mean, ADCW-min, ADCmean, and ADCmin values were 1.223×10⁻³ mm2/s, 0.897×10⁻³ mm2/s, 1.315×10⁻³ mm2/s, and 1.111×10⁻³ mm2/s, respectively. The corresponding SE, SP, PPV, and NPV values were 89.4%, 89.0%, 94.2%, and 81.7% for ADCW-mean, 91.8%, 97.5%, 98.7%, and 86.5% for ADCW-min, 84.7%, 91.4%, 95.2%, and 75.7% for ADCmean, and 82.4%, 95.1%, 97.1%, and 73.6% for ADCmin. ROC curves indicated that the AUC for ADCW-min (0.969) was statistically significant higher than the AUC for ADCW-mean (0.940; Z=2.473, P=0.013), ADCmean (0.919; Z=3.691, P=0.000), and ADCmin (0.928; Z=3.634, P=0.000). The AUC for ADCW-mean was also significantly higher than the AUC for ADCmean (Z=2.863, P=0.004) (Table 3; Figure 5).
Table 3.
Receiver operating characteristics (ROC) analysis and area under the curve (AUC) for each ADC parameter
| ADC Parameter | Cutoff level (×10-3 mm2/s)a | SE | SP | PPV | NPV | AUC | p valueb |
|---|---|---|---|---|---|---|---|
| ADCW-mean | 1.223 | 89.4% (146/163) | 89.0% (76/85) | 94.2% (146/155) | 81.7% (76/93) | 0.940 | 0.013 |
| ADCW-min | 0.897 | 91.8% (150/163) | 97.5% (83/85) | 98.7% (150/152) | 86.5% (83/96) | 0.969 | |
| ADCmean | 1.315 | 84.7% (138/163) | 91.4% (78/85) | 95.2% (138/145) | 75.7% (78/103) | 0.919 | 0.000 |
| ADCmin | 1.111 | 82.4% (134/163) | 95.1% (81/85) | 97.1% (134/138) | 73.6% (81/110) | 0.928 | 0.000 |
The best-performance cutoff was selected for optimal threshold when Youden index reached the highest point on the ROC curves.
Statistically significant difference was compared with the AUC of the ADCW-min parameter.
The AUC for the ADCW-mean was statistically-significantly higher than the AUC for the ADCmean (Z=2.863, P=0.004). That was no significantly between the AUC for the ADCmin and the AUC for the ADCW-mean (Z=1.247, P=0.213), the AUC for the ADCmin and the AUC for the ADCmean (Z=1.069, P=0.285).
Figure 5.
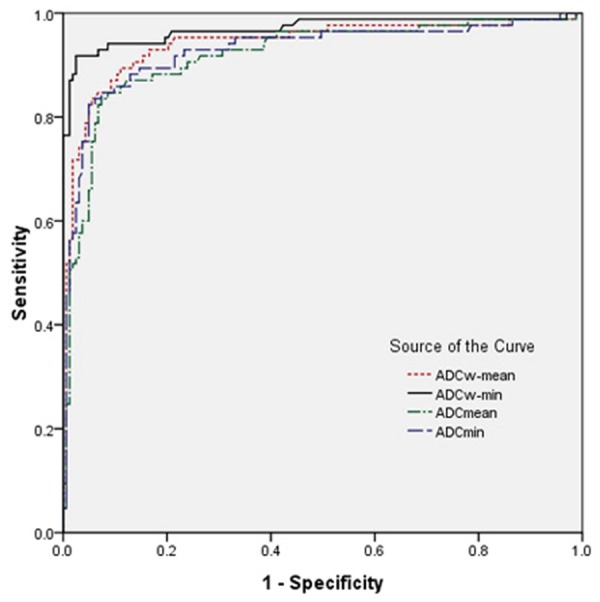
ROC of parameters obtained in different ADCs measurement methods for distinguishing breast Lesions from benign to malignant.
Discussion
Nowadays, DWI is the only image technology for detecting Brownian motion of bulk water molecules in vivo, which is used to quantify water diffusion by ADC values. It has been widely applied to the diagnosis of benign and malignant lesions [11-13]. However, the measurement methods of ADCs were different [14-19]. Recently, many studies were published to assess the diagnostic performances of DWI in benign and malignant breast lesions [1,2,14-24]. Some studies had found that ADCs had relatively high sensitivity and specificity in distinguishing malignant and benign lesions [1,2]. Others had indicated that the pathologic basis of DWI were cell density, nucleus cytoplasm ratio, extracellular volume, and membrane integrality [1-2,14-24]. However, the measurement methods of ADC values were inconstant. Moreover, different sizes of ROIs would result in different sensitivity and specificity of ADCs. Therefore, we performed this study to assess two measurement (whole-measurement and spot-measurement) methods of ADC values and the diagnostic performance of ADCs (ADCW-mean, ADCW-min, ADCmean, and ADCmin).
The results of our study showed that the optimal diagnostic threshold ADCW-mean, ADCW-min, ADCmean, and ADCmin values were 1.223×10⁻³ mm2/s, 0.897×10⁻³ mm2/s, 1.315×10⁻³mm2/s, and 1.111×10⁻³ mm2/s, respectively. The corresponding AUC values were 0.919, 0.928, 0.940, and 0.969, respectively. The diagnostic performance of ADCs (ADCW-mean and ADCW-min) in the whole-measurement method was significantly higher than that of ADCs (ADCW-mean and ADCW-min) in the spot-measurement method, especially ADCW-min value. However, several factors should be mentioned: (1) ADCs obtained from the spot-measurement method can be affected by different observer. (2) The size and number of ROIs obtained from the spot measurement were highly dependent on methods of ROI analysis [9,11]. Therefore, ADCs obtained from the whole-measurement method are more reproducible than those obtained from the spot measurement.
It is known that different growth mode and growth speed of breast tumor cells can result in different extracellular volumes and nucleus cytoplasm ratios [1,2,9,14-19]. It was hard to selected intratumor highest cellular zone which was influenced by window level and width. Therefore, we can not assess the diagnostic strength of ADCmin and ADCmean because it was liable to be subjective. However, the whole-measurement method could avoid some subjective factors during the measurement process, and provide the objective, reliable, and well repeatable ADCW-mean and ADCW-min values of breast lesions by Siemens workstation. Due to the factor that malignant breast lesions show pathologic heterogeneity frequently, the presence of anaplasia, such as fibrosis and tiny liquefactive necrosis, may affect ADC values, especially maximum ADC. In addition, mucinous carcinoma often includes intratumoral mucin pool with a lower cell density [9,25], and the highest cellular zone were usually the rim of tumor [9,25]. Due to all these factors, ADCW-min can reflect well the pathological features of tumor. Thus, we considered that ADCW-min value as an optimal DWI single parameter in distinguishing breast lesions from benign to malignant.
Several limitations should be mentioned in this study. First of all, microcalcification which should be excluded was hardly found out by naked eyes in the whole-measurement method. However, ADC values of microcalcification are relatively lower than those diagnosed as malignant lesions, which was consistent with the conclusions that most of the microcalcification took place in malignant breast lesions [26-28]. Secondly, there was lack of statistical significance between ADCmin and ADCW-mean (Z=1.247, P=0.213), ADCmean (Z=1.069, P=0.285). The reasons might be as follows: (1) no grouping was made based on lesions size, (2) four ADC values were similar when lesion’s diameter was small than 10 mm, and (3) the real extent of lesion was hard to evaluate due to diffuse cancer cells infiltrating the fat tissue [3]. Therefore, an accurate measurement method of ADCs with small error is needed to be exploited. Thirdly, this study was mainly investigated whether different measurement methods of ROIs had influence on ADCs. While, we did not explore whether different b values or equipments provided by different manufacturers, which may have some influence on the results [29,30]. Therefore, further studies are needed to analyze the influence of different b values or equipments on ADCs.
Conclusions
ADCs obtained by the whole-measurement method are more accurate in reflecting the limitation of Brownian motion on water molecules than that of the spot-measurement method. All in all, our results provided evidence that the most reliable and accurate value in demonstrating the limitation of diffusion may be ADCW-min, and it has the highest diagnostic value in distinguishing breast lesions from malignant to benign.
Acknowledgements
This study was supported by the Guangxi Science and Technology Department research programs (No. 14124004-1-11).
Disclosure of conflict of interest
None.
References
- 1.Guo Y, Cai YQ, Cai ZL, Gao YG, An NY, Ma L, Mahankali S, Gao JH. Differentiation of clinically benign and malignant breast lesions using diffusion-weighted imaging. J Magn Reson Imaging. 2002;16:172–178. doi: 10.1002/jmri.10140. [DOI] [PubMed] [Google Scholar]
- 2.Kuroki Y, Nasu K, Kuwki S, Murakami K, Hayashi T, Sekiguchi R, Nawano S. Diffusion-weighted imaging of breast cancer with the sensitivity encoding technique: analysis of the apparent diffusion coefficient value. Magn Reson Med Sci. 2004;3:79–85. doi: 10.2463/mrms.3.79. [DOI] [PubMed] [Google Scholar]
- 3.Hahn SY, Ko EY, Han BK, Shin JH, Ko ES. Role of diffusion-weighted imaging as an adjunct to contrast-enhanced breast MRI in evaluating residual breast cancer following neoadjuvant chemotherapy. Eur J Radiol. 2014;83:283–8. doi: 10.1016/j.ejrad.2013.10.023. [DOI] [PubMed] [Google Scholar]
- 4.Kamitani T, Matsuo Y, Yabuuchi H, Fujita N, Nagao M, Jinnouchi M, Yonezawa M, Yamasaki Y, Tokunaga E, Kubo M, Yamamoto H, Yoshiura T, Honda H. Correlations between apparent diffusion coefficient values and prognostic factors of breast cancer. Magn Reson Med Sci. 2013;12:193–9. doi: 10.2463/mrms.2012-0095. [DOI] [PubMed] [Google Scholar]
- 5.Iima M, Le Bihan D, Okumura R. Apparent diffusion coefficient as an MR imaging biomarker of low-risk ductal carcinoma in situ: a pilot study. Radiology. 2011;260:364–72. doi: 10.1148/radiol.11101892. [DOI] [PubMed] [Google Scholar]
- 6.Choi SY, Chang YW, Park HJ, Kim HJ, Hong SS, Seo DY. Correlation of the apparent diffusion coefficiency values on diffusion-weighted imaging with prognostic factors for breast cancer. Br J Radiol. 2012;85:e474–9. doi: 10.1259/bjr/79381464. [DOI] [PMC free article] [PubMed] [Google Scholar]
- 7.Tan SL, Rahmat K, Rozalli FI, Mohd-Shah MN, Aziz YF, Yip CH, Vijayananthan A, Ng KH. Differentiation between benign and malignant breast lesions using quantitative diffusion-weighted sequence on 3 T MRI. Clin Radiol. 2014;69:63–71. doi: 10.1016/j.crad.2013.08.007. [DOI] [PubMed] [Google Scholar]
- 8.Kim SH, Cha ES, Kim HS, Kang BJ, Choi JJ, Jung JH, Park YG, Suh YJ. Diffusion-weighted imaging of breast cancer: correlation of the apparent diffusion coefficient value with prognostic factors. J Magn Reson Imaging. 2009;30:615–20. doi: 10.1002/jmri.21884. [DOI] [PubMed] [Google Scholar]
- 9.Hirano M, Satake H, Ishigaki S, Ikeda M, Kawai H, Naganawa S. Diffusion-weighted imaging of breast masses: comparison of diagnostic performance using various apparent diffusion coefficient parameters. AJR Am J Roentgenol. 2012;198:717–22. doi: 10.2214/AJR.11.7093. [DOI] [PubMed] [Google Scholar]
- 10.Luo N, Su D, Jin G. Apparent diffusion coefficient ratio between axillary lymph node with primary tumor to detect nodal metastasis in breast cancer patients. J Magn Reson Imaging. 2013;38:824–8. doi: 10.1002/jmri.24031. [DOI] [PubMed] [Google Scholar]
- 11.Lambregts DM, Beets GL, Maas M, Curvo-Semedo L, Kessels AG, Thywissen T, Beets-Tan RG. Tumour ADC measurements in rectal cancer: effect of ROI methods on ADC values and interobserver variability. Eur Radiol. 2011;21:2567–74. doi: 10.1007/s00330-011-2220-5. [DOI] [PMC free article] [PubMed] [Google Scholar]
- 12.Vandecaveye V, De Keyzer F, Vander Poorten V, Dirix P, Verbeken E, Nuyts S, Hermans R. Head and neck squamous cell carcinoma: value of diffusion-weighted MR imaging for nodal staging. Radiology. 2009;251:134–46. doi: 10.1148/radiol.2511080128. [DOI] [PubMed] [Google Scholar]
- 13.Donati OF, Chong D, Nanz D, Boss A, Froehlich JM, Andres E, Seifert B, Thoeny HC. Diffusion-weighted MR imaging of Upper abdominal organs field strength and intervendor variability of apparent diffusion coefficients. Radiology. 2014;270:454–63. doi: 10.1148/radiol.13130819. [DOI] [PubMed] [Google Scholar]
- 14.Woodhams R, Matsunaga K, Iwabuchi K, Kan S, Hata H, Kuranami M, Watanabe M, Hayakawa K. Diffusion-weighted imaging of malignant breast tumors: the usefulness of apparent diffusion coefficient (ADC) value and ADC map for the detection of malignant breast tumors and evaluation of cancer extension. J Comput Assist Tomogr. 2005;29:644–9. doi: 10.1097/01.rct.0000171913.74086.1b. [DOI] [PubMed] [Google Scholar]
- 15.Rubesova E, Grell AS, Maertelaer VD, Metens T, Chao SL, Lemort M. Quantitative diffusion imaging in breast cancer: a clinical prospective study. J Magn Reson Imaging. 2006;24:319–24. doi: 10.1002/jmri.20643. [DOI] [PubMed] [Google Scholar]
- 16.Ei Khouli RH, Jacobs MA, Mezban SD, Huang P, Kamel IR, Macura KJ, Bluemke DA. Diffusion-weighted imaging improves the diagnostic accuracy of conventional 3.0-T breast MR imaging. Radiology. 2010;256:64–73. doi: 10.1148/radiol.10091367. [DOI] [PMC free article] [PubMed] [Google Scholar]
- 17.Peters NH, Vincken KL, van den Bosch MA, Luijten PR, Mali WP, Bartels LW. Quantitative diffusion weighted imaging for differentiation of benign and malignant breast lesions: the influence of the choice of b-values. J Magn Reson Imaging. 2010;31:1100–5. doi: 10.1002/jmri.22152. [DOI] [PubMed] [Google Scholar]
- 18.Satake H, Nishio A, Ikeda M, Ishigaki S, Shimamoto K, Hirano M, Naganawa S. Predictive value for malignancy of suspicious breast masses of BI-RADS categories 4 and 5 using ultrasound elastography and MR diffusion-weighted imaging. AJR Am J Roentgenol. 2011;196:202–9. doi: 10.2214/AJR.09.4108. [DOI] [PubMed] [Google Scholar]
- 19.Kul S, Cansu A, Alhan E, Dinc H, Gunes G, Reis A. Contribution of diffusion-weighted imaging to dynamic contrast-enhanced MRI in the characterization of breast tumors. AJR Am J Roentgenol. 2011;196:210–7. doi: 10.2214/AJR.10.4258. [DOI] [PubMed] [Google Scholar]
- 20.Park MJ, Cha ES, Kang BJ, Ihn YK, Baik JH. The role of diffusion-weighted imaging and the apparent diffusion coefficient (ADC) values for breast tumors. Korean J Radiol. 2007;8:390–6. doi: 10.3348/kjr.2007.8.5.390. [DOI] [PMC free article] [PubMed] [Google Scholar]
- 21.Yabuuchi H, Matsuo Y, Okafuji T, Kamitani T, Soeda H, Setoguchi T, Sakai S, Hatakenaka M, Kubo M, Sadanaga N, Yamamoto H, Honda H. Enhanced mass on contrast-enhanced breast MR imaging: Lesion characterization using combination of dynamic contrast-enhanced and diffusion-weighted MR images. J Magn Reson Imaging. 2008;28:1157–65. doi: 10.1002/jmri.21570. [DOI] [PubMed] [Google Scholar]
- 22.Woodhams R, Matsunaga K, Kan S, Hata H, Ozaki M, Iwabuchi K, Kuranami M, Watanabe M, Hayakawa K. ADC mapping of benign and malignant breast tumors. Magn Reson Med Sci. 2005;4:35–42. doi: 10.2463/mrms.4.35. [DOI] [PubMed] [Google Scholar]
- 23.Yoshikawa MI, Ohsumi S, Sugata S, Kataoka M, Takashima S, Mochizuki T, Ikura H, Imai Y. Relation between cancer cellularity and apparent diffusion coefficient values using diffusion-weighted magnetic resonance imaging in breast cancer. Radiat Med. 2008;26:222–6. doi: 10.1007/s11604-007-0218-3. [DOI] [PubMed] [Google Scholar]
- 24.Partridge SC, Mullins CD, Kurland BF, Allain MD, DeMartini WB, Eby PR, Lehman CD. Apparent diffusion coefficient values for discriminating benign and malignant breast MRI lesions: effects of lesion type and size. AJR Am J Roentgenol. 2010;194:1664–73. doi: 10.2214/AJR.09.3534. [DOI] [PubMed] [Google Scholar]
- 25.Woodhams R, Kakita S, Hata H, Iwabuchi K, Umeoka S, Mountford CE, Hatabu H. Diffusion-weighted imaging of mucinous carcinoma of the breast: evaluation of apparent diffusion coefficient and signal intensity in correlation with histologic findings. AJR Am J Roentgenol. 2009;193:260–6. doi: 10.2214/AJR.08.1670. [DOI] [PubMed] [Google Scholar]
- 26.de Lafontan B, Daures JP, Salicru B, Eynius F, Mihura J, Rouanet P, Lamarque JL, Naja A, Pujol H. Isolated clustered microcalcifications: diagnostic value of mammography--series of 400 cases with surgical verification. Radiology. 1994;190:479–83. doi: 10.1148/radiology.190.2.8284403. [DOI] [PubMed] [Google Scholar]
- 27.Cole LE, Vargo-Gogola T, Roeder RK. Bisphosphonate-functionalized gold nanoparticles for contrast-enhanced X-ray detection of breast microcalcifications. Biomaterials. 2014;35:2312–21. doi: 10.1016/j.biomaterials.2013.11.077. [DOI] [PMC free article] [PubMed] [Google Scholar]
- 28.Makeev A, Glick SJ. Investigation of statistical iterative reconstruction for dedicated breast CT. Med Phys. 2013;40:081904. doi: 10.1118/1.4811328. [DOI] [PMC free article] [PubMed] [Google Scholar]
- 29.Donati OF, Chong D, Nanz D, Boss A, Froehlich JM, Andres E, Seifert B, Thoeny HC. Diffusion-weighted MR imaging of upper abdominal organs: field strength and intervendor variability of apparent diffusion coefficients. Radiology. 2014;270:454–63. doi: 10.1148/radiol.13130819. [DOI] [PubMed] [Google Scholar]
- 30.Pereira FP, Martins G, Figueiredo E, Domingues MN, Domingues RC, da Fonseca LM, Gasparetto EL. Assessment of breast lesions with diffusion-weighted MRI: comparing the use of different b values. AJR Am J Roentgenol. 2009;193:1030–5. doi: 10.2214/AJR.09.2522. [DOI] [PubMed] [Google Scholar]


