Abstract
Objectives: This study aimed to systematically analyze changes in mitochondrial-related protein expression in bladder cancer cells and tumor-associated fibroblasts and to investigate the characteristics of bladder cancer cell energy metabolism. Methods: In this study, we utilized the following techniques to achieve the objectives: (1) a co-culture system of bladder tumor cells and fibroblasts was built using a microfluidic chip as a three-dimensional culture system; (2) the concentration of lactic acid in the medium from the different groups was determined using an automatic micro-plate reader; (3) a qualitative analysis of mitochondria-related protein expression was performed by immunofluorescent staining; and (4) a quantitative analysis of mitochondrial-associated protein expression was conducted via Western blot. SPSS software was utilized to analyze the data. Results: (1) Determination of lactic acid concentration: The lactic acid concentration was determined to be highest in the experimental group, followed by the T24 cell control group and then the fibroblast control group. (2) Qualitative results: In the control group, the mitochondrial-related protein fluorescence intensity was higher in the fibroblasts compared with the cancer cells, and the fluorescence intensity of the fibroblasts was reduced compared with the experimental group. The mitochondrial-related protein fluorescence intensity of the cancer cells was higher in the experimental group compared with the control group, and the opposite results were obtained with the fibroblasts. (3) Quantitative results: The expression of mitochondria-related proteins was higher in fibroblasts compared with cancer cells in the control group, and the opposite results were obtained in the experimental group (P<0.05). The expression of mitochondria-related proteins was increased in cancer cells in the experimental group compared with the control group; the opposite results were observed for the fibroblasts (P<0.05). Conclusions: The energy metabolism of bladder tumor cells does not parallel the “Warburg effect” because even under sufficient oxygen conditions, cancer cells still undergo glycolysis. Bladder cancer cells also have an efficient oxidative phosphorylation process wherein cancer cells promote glycolysis in adjacent interstitial cells, thereby causing increased formation of nutritional precursors. These high-energy metabolites are transferred to adjacent tumor cells in a specified direction and enter the Krebs Cycle. Ultimately, oxidative phosphorylation increases, and sufficient ATP is produced.
Keywords: Energy metabolism, warburg effect, three-dimensional cell culture, tumorigenesis, microfluidic chip
Introduction
Scientific research has confirmed that the energy required by cells is mainly derived from glucose catabolism. The primary methods of glucose metabolism in cells include oxidative phosphorylation and anaerobic glycolysis. The main difference between these methods is that cells within normal tissues produce ATP via oxidative phosphorylation under sufficient oxygen conditions; in contrast, glycolysis occurs under hypoxic conditions [1]. Tumor cells exhibit several significant characteristics: unlimited replication ability, resistance to apoptosis, insensitivity to growth-inhibitory signals, self-sufficiency in growth signals, high potential for invasion and metastasis, and strong and persistent angiogenesis [2,3]. In the 1920s, Otto Warburg’s team pioneered research on tumor cell energy metabolism. The famous and influential “Warburg effect” was proposed: tumor cells tend to be powered by glycolysis even under conditions of sufficient oxygen supply instead of producing ATP through the more efficient method of oxidative phosphorylation, as occurs in normal cells [4]. Tumor cell energy metabolism became the focus of cancer research when this hypothesis was published. Scientists also attempted to interpret and use this idea as a starting point for understanding the mechanism of tumor development as well as cancer prevention and treatment from the perspective of tumor cell energy metabolism. However, the “interstitial control” hypothesis of tumor-associated cells gradually attracted scientists’ attention given the increasing depth of the research. The hypothesis states that in addition to the tumor cells themselves, the microenvironment, which influences tumor growth and survival, has a significant impact on energy metabolism [5,6]. The “Warburg effect” theory has not fully resolved the variety of problems noted with in-depth studies.
Fibroblasts are stromal cells that are important for the tissue growth microenvironment. Fibroblasts are the primary cells that produce cathepsins, which are basement membrane and extracellular matrix components. Thus, fibroblasts play the role of “matrix mother cells” [7]. Although the role of fibroblasts in tumor development is still not completely clear, many recent studies have demonstrated that fibroblasts are involved in tumor angiogenesis and that they may provide cancer-promoting paracrine signals for the conversion of epithelial cells; fibroblasts also play a significant role in promoting tumor progression and metastasis [8]. Activated fibroblasts that exhibit this special phenotype are referred to as tumor-associated fibroblasts.
In this study, tumor-associated fibroblasts were used as the starting point to build a three-dimensional microfluidic-based microenvironment as a model of tumor growth. This system was used to analyze the expression of mitochondria-related proteins involved in energy metabolism in bladder tumor cells and tumor-associated fibroblasts via qualitative and quantitative methods. Then, we explored the energy metabolism characteristics of bladder tumor cells and tumor-associated fibroblasts.
Materials and methods
Materials
Cells
This study evaluated human bladder tumor cells (T24 cells), tumor-associated fibroblasts, and human skin fibroblasts (CAFs).
Reagents and antibodies
The reagents and antibodies used in this study were purchased from various companies. DMEM and RPMI-1640 cell culture media as well as fetal bovine serum (FBS) and PBS were purchased from HyClone (Logan City, Utah, USA). The anti-mitochondria antibody (MAB1273) was purchased from Merck (Darmstadt, DE). MitoTracker Red (M7512) was purchased from Gibco (California, USA). The anti-TOMM20 (ab78547), anti-mitofilin (ab93323), anti-cyclophilin (ab3562), anti-cytochrome C (ab133504), anti-NADH dehydrogenase subunit 6 (ab81212), anti-MTCO1 (ab14705), anti-ATP synthase (ab96655) and anti-pyruvate dehydrogenase E1-alpha subunit (ab110334) antibodies were purchased from Abcam (Cambridge, GB). FITC (BA1105), DAPI (nuclear dye, AR1177), and a BCA Protein Assay Kit (AR0146) were purchased from BOSTER (Wuhan, CN). An L-Lactate Assay Kit (K-DLATE) was purchased from SEEBIO (Shanghai, CN). The β-actin rabbit mAb (#8457) and β-actin mouse mAb (#3700) were purchased from Cell Signaling Technology (Beverly, MA, USA). A Simon (12-180 kDa) Master Kit was purchased from ProteinSimple (San Jose, CA, USA). The Simon Master Kit included a biotinylated molecular weight ladder, streptavidin-HRP, fluorescent standards, luminol-S, hydrogen peroxide, sample buffer, DTT, stacking matrix, separation matrix, running buffer, wash buffer, matrix removal buffer, ProteinSimple antibody diluent, goat anti-rabbit secondary antibody, goat anti-mouse secondary antibody and capillaries.
Major analytical instruments
An automatic microplate reader (BioTek, Winooski, VT, USA), a fluorescence microscope (Nikon, JP), and Simon™ (ProteinSimple, USA) were used in this study.
Methods
Microfluidic chip production
Designing and producing a microfluidic chip with a multi-channel connection and a multi-unit integrated high-throughput system
The chip consisted of the following components: cell culture pools, microchannels connected to the pools and peripheral perfusion channels. In detail, each chip had four cell culture pools: two pools were inoculated with human skin fibroblasts (CAFs), and the other pools were inoculated with human bladder tumor cells (T24). Each culture pool had two channels connected to the outside. One pool was the in-channel for cell seeding, and one was the out-channel. The four culture pools were connected by two cross microchannels impregnated with matrigel that separated the cells in each pool; however, lactic acid and other small molecules produced by the cells could be exchanged via the matrigel. A perfusion channel was located around the entire periphery of the chip. Cell culture medium was injected through the perfusion channel, whereas cells were seeded into the pools [9] (Figure 1).
Figure 1.
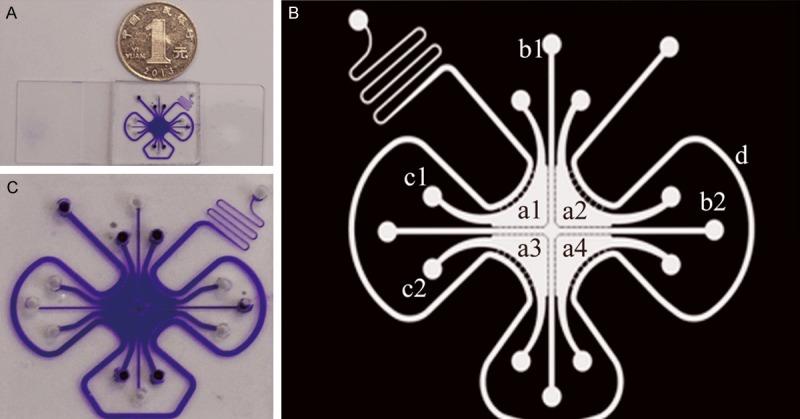
A microfluidic chip on a glass slide. A depicts the real product. B is an enlarged photo. C is the mode pattern. In the mode pattern, a1, a2, a3 and a4 indicate the four cell culture pools. b1 and b2 are the microchannels connecting the pools. c1 and c2 are two channels connecting the culture pools to the outside, and d is the peripheral perfusion channel.
Matrigel preparation and perfusion
To ensure that the prepolymer matrix solution was sufficient to melt glue, we maintained the solution in a 4°C refrigerator overnight. The microfluidic chip and pipette were pre-cooled during this time. Then, we mixed serum-free culture medium and pre-cooled melted matrigel at a ratio of 1:1 (v/v) and pipetted 10 μL of the formulated liquid prepolymer matrigel solution into the microfluidic chips via the cross microchannel. Then, the microfluidic chip was placed in a sterile petri dish in a 37°C incubator for at least 8 hours [10].
Grouping and building the cell lines
The experimental group included T24 cells and CAFs co-cultured in the microfluidic chips.
The control groups comprised individual cultures of T24 cells or CAFs in the microfluidic chips.
T24 cells were cultured in RPMI-1640 medium with 10% FBS, and CAFs were cultured in DMEM with 10% FBS. We selected T24 cells and CAFs that were growing well with ideal cell morphology to prepare a high-density cell suspension (105 cells/mL) and precooled the suspension on ice. Then, RPMI-1640 and DMEM media with 10% FBS were mixed with the cell suspension at a ratio of 3:1 (v/v). Each cell culture pool was injected with 5 μL of the previously prepared mixture. We seeded T24 cells and CAFs in the pools using a diagonal-cross method in the experimental groups, whereas a single cell type was seeded in all the pools in the control groups. When we injected the RPMI-1640 or DMEM media into the perfusion channel, the microfluidic chip laboratories were complete. Then, we placed the chips in a 37°C incubator with 5% CO2 for 48 hours.
Determination of the lactic acid content of the culture broth
After culturing the microfluidic chips for 2 days, we removed the medium (U) in each pool using a micropipette and centrifuged the medium for 5 min at 1000 rev/min. Then, we added 3 μL of lactate concentration calibrator (S) to 240 μL of reagent 1 (Tris buffer and lactate oxidase) and mixed the resulting solution. After a 5 min incubation at 37°C, we read the first photometric value (A1). Then, we added 60 μL of reagent 2 (peroxidase, 4-aminoantipyrine, and TBHBA). After a 5 min incubation at 37°C, we read the second photometric value (A2). The change in photometric value for each tube was calculated as follows: ΔA=A2-A1. The following equation was used to calculate the lactic acid content: C=ΔAU×CS/ΔAS (CS represents the concentration of the calibration solution).
Qualitative analysis of mitochondria-associated proteins in the experimental and control groups using immunofluorescence
First, we added 5 μL of 200 nmol/L MitoTracker Red to each cell pool and incubated the pools for 45 min in a 37°C incubator. Then, fixation and permeabilization were performed according to the immunofluorescence protocol. The primary antibody was an anti-mitochondria antibody (MAB1273), and the secondary antibody was conjugated to FITC (BA1105). After washing the pools with PBS, we added 5 μL of DAPI (nuclear dye) to each pool for 30 min and then completely washed each pool. All of the above steps were performed in the dark.
We observed the fluorescence intensity via immunofluorescence microscopy. M7512 is excited by green light; MAB1273, by blue light; and DAPI, by ultraviolet light.
Quantitative protein analysis: detecting differences in mitochondria-associated protein expression in each group by Western blot
All the samples and reagents were prepared according to the ProteinSimple manual. The samples were diluted to adjust the protein concentration to 1.5 μg/μL (not less than 1 μg/μL) with sample buffer and were further diluted 1:3 with 4X master mix (containing 8 μL of 1 M DTT, 20 μL of 10X sample buffer and one tube of fluorescent standards). Then, 5 μL of each final sample was boiled for 5 min, placed on ice for 5 min, and applied to the proper wells after a short centrifugation. The 1 M DTT stock solution and a 1:1 stock mixture of luminol-S and peroxide (150 μL) were prepared fresh daily and maintained on ice until use. Fluorescent standards and a biotinylated molecular weight ladder were used according to the manufacturer’s instructions. All the primary antibodies were diluted with antibody diluents provided by ProteinSimple.
The Simon™ instrument was prepared by adding matrix removal buffer (2 ml) to Trough 1, wash buffer (2 ml) to Trough 2, and running buffer (0.8 ml) to Trough 3. A clip of 12 capillaries and the 384-well plate containing samples, antibodies, and matrices were then placed inside the instrument. The Simple Western was performed using the following settings. The capillaries were filled with separation matrix for 100 s, with stacking matrix for 16 s and with protein samples for 12 s. The samples were then separated by applying a voltage of 250 V for 40 min. Once the separation was complete, the samples were immobilized on the capillary wall using the default immobilization conditions and then washed with matrix removal buffer for 140 s to remove the separation matrix inside the capillaries. The capillaries were then washed with wash buffer for 150 s before being blocked with antibody diluent for 15 min to prevent non-specific binding by the primary antibody. Next, the capillaries were incubated with primary antibody for 3 h, washed, and incubated with HRP-conjugated secondary antibodies for 1 h. After unbound secondary antibody was removed, the capillaries were incubated with the luminol-S/peroxide substrate, and the chemiluminescent signal was collected using the charge-coupled device (CCD) camera of Simon™ with seven different exposure times (10, 30, 60, 120, 240, 480, and 960 s). The data analysis was performed using the Compass Software on Simon™.
Results
Determination of lactic acid concentration (Figure 2)
Figure 2.
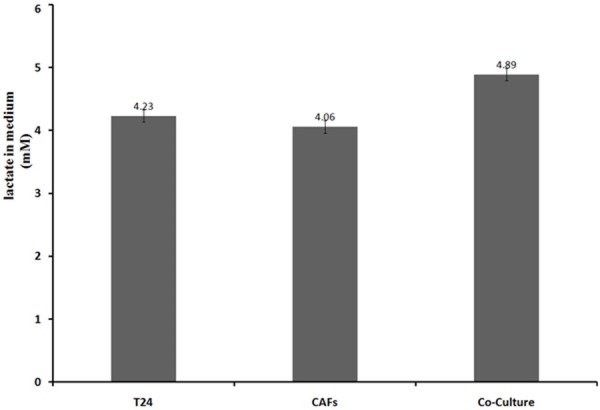
Lactic acid concentrations differed among the groups. Each group had roughly the same number of cells (P<0.05).
When cultured separately, CAFs generated less lactic acid than T24 cells. The lactic acid concentration was higher in the co-cultured medium compared with the medium from the two individual cell cultures.
Qualitative analysis
The mitochondria-related protein fluorescence intensity of the fibroblasts was increased in the control group compared with that of the cancer cells, and the fluorescence intensity of the fibroblasts was reduced in the experimental group. The mitochondria-related protein fluorescence intensity of the cancer cells was increased in the experimental group compared with the control group, and the opposite result was observed for the fibroblasts (Figure 3).
Figure 3.
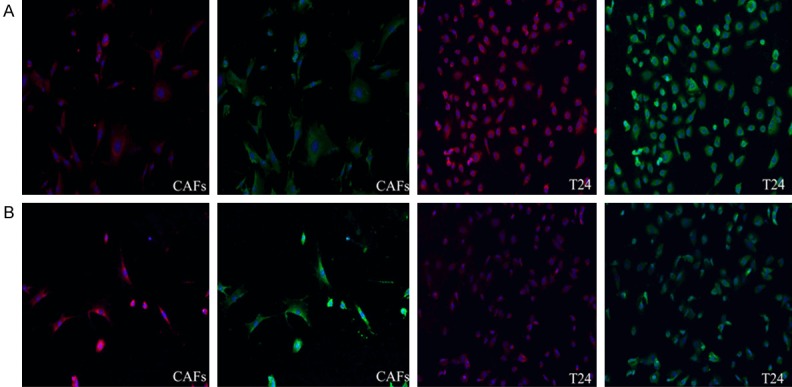
Immunofluorescence results for the different groups (100X magnification). The green images were obtained with an anti-mitochondria antibody, and the red images were obtained with MitoTracker Red. Line A represents the experimental groups, and line B represents the control groups.
Quantitative analysis
We divided the mitochondria-related proteins into 2 groups. One group contained mitochondrial structural proteins, such as mitochondrial outer membrane proteins (channel protein isoforms), mitochondrial proteins (Core 1), crest gap proteins (Cyclophilin D) and membrane gap proteins (Cytochrome C). All of the proteins in this first group exhibit fixed expression in different parts of the mitochondria. Their expression is persistent and stable, and these proteins are regarded as representative proteins for studying mitochondrial structure [11,12]. The other group contained mitochondrial function proteins, such as anti-oxidative phosphorylation complex I (NADH dehydrogenase), anti-oxidative phosphorylation complex IV (cytochrome C oxidase), anti-oxidative phosphorylation complex V (ATP synthase) and pyruvate dehydrogenase. These mitochondrial proteins are referred to as functional proteins because they are closely involved in ATP generation [13,14], acetyl CoA formation from pyruvate that enters the citric acid cycle and respiratory chain electron transfer.
Using the Simon™ instrument for Western blotting, we obtained the necessary protein bands and bar graph to analyze the differences in mitochondria-associated protein expression in each group (Figures 4 and 5).
Figure 4.
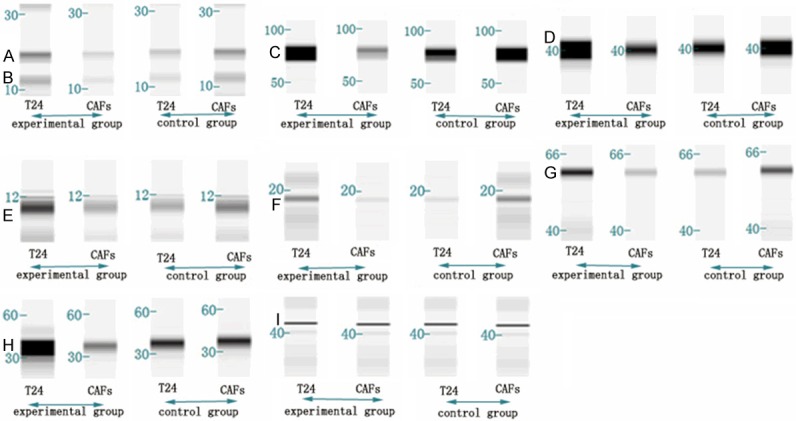
Western blot results for the different groups. Band A: mitochondrial outer membrane protein. Band B: anti-oxidative phosphorylation complex V (ATP synthase). Band C: mitochondrial protein (Core 1). Band D: crest gap protein (cyclophilin D). Band E: membrane gap protein (cytochrome C). Band F: anti-oxidative phosphorylation complex I (NADH dehydrogenase). Band G: anti-oxidative phosphorylation complex IV (cytochrome C oxidase). Band H: pyruvate dehydrogenase. Band I: β-actin.
Figure 5.
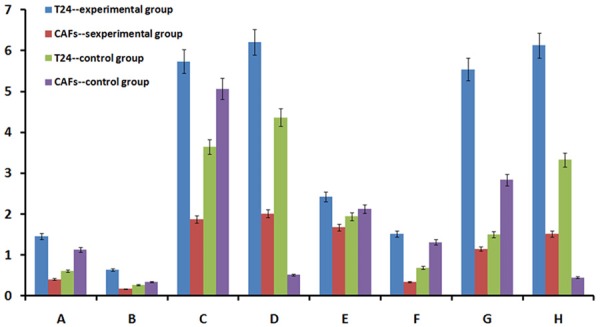
Bar graph of the Western blot results. Group A: mitochondrial outer membrane protein. Group B: anti-oxidative phosphorylation complex V (ATP synthase). Group C: mitochondrial protein (Core 1). Group D: crest gap protein (Cyclophilin D). Group E: membrane gap protein (cytochrome C). Group F: anti-oxidative phosphorylation complex I (NADH dehydrogenase). Group G: anti-oxidative phosphorylation complex IV (cytochrome C oxidase). Group H: pyruvate dehydrogenase.
The following results were obtained from the quantitative data described above. The expression of mitochondria-related proteins was higher in fibroblasts compared with cancer cells in the control group; the exact opposite results were observed in the experimental group (P<0.05). Mitochondria-related protein expression was increased in cancer cells in the experimental group compared with the control group, and the opposite results were obtained for the fibroblasts (P<0.05).
Discussion and conclusion
Under conditions of adequate oxygen supply, normal cells undergo efficient oxidative phosphorylation. Glucose-derived pyruvate can be transported into the mitochondria, where it undergoes oxidative decarboxylation to produce acetyl coenzyme A via pyruvate dehydrogenase. Acetyl coenzyme A enters the tricarboxylic acid cycle (TCA), which includes numerous steps, including oxidation steps, that ultimately generate water, carbon dioxide, and significant amounts of ATP. In conditions of hypoxia or a reduced oxygen supply, cellular energy metabolism is chiefly dependent on the glycolytic pathway, which is predominantly performed in the cytoplasm [15]. Therefore, the study of the expression and functional state of mitochondria-related proteins indirectly assesses the characteristics of cellular energy metabolism.
Most tumor metabolism studies have analyzed breast cancer cells, liver cancer cells, or gastrointestinal cancer cells. However, a limited number of studies have focused on bladder tumors, a type of urinary system tumor with a gradually increasing incidence. Furthermore, previous experiments that studied tumor cells were largely confined to individual cultures of a single cell type, and these studies ignored the important role of the microenvironment. In fact, tumor cells are located in a microenvironment where they interact with various substances and coexist with diverse cell types. We must consider the role of the microenvironment, especially the impact of tumor-associated cells, if we want to analyze tumor cell energy metabolism. In a few studies based on co-culture conditions, the cultured cells were allowed to contact each other, and then the tumor cells were screened out to obtain the data. However, a key point is whether the screening process itself negatively impacts the tumor cells. Our experiments focused on the interaction between tumor-associated fibroblasts and bladder cancer cells with regards to energy metabolism. The microfluidic platform, which provides a non-contact co-culture condition, is a good solution for this problem. This system removes obstacles regarding co-culturing fibroblasts and bladder cancer cells and recapitulating the interactions between various substances produced by cells; furthermore, this system can be used to conveniently and efficiently observe alterations in cytoactivity and proliferation of the two cell types. It can even be used to easily analyze changes in small molecules, such as lactic acid, and mitochondria-related proteins under co-culture conditions. Thus, the observed molecular events can be associated with bladder tumor energy metabolism.
The lactic acid concentration results indicated that the co-cultured group produced more lactate. Thus, bladder tumor cells or fibroblasts potentially conduct glycolysis more efficiently under co-culture conditions, resulting in an increased concentration of lactic acid.
In the immunofluorescence experiments, cell staining of the four groups confirmed that cytoactivity may not be influenced by the microfluidic chip and that cells exhibited appropriate growth in individual cultures and in co-cultures. MitoTracker Red exclusively stains live cells. The contrast in cell fluorescence intensity between the different groups can preliminarily reveal disparities in mitochondrial protein expression and activity. In our experiment, overall mitochondrial activity and protein expression were weak under single cell type culture conditions. However, overall mitochondrial activity and protein expression were enhanced in co-culture conditions. The opposite phenomenon was observed for the CAFs.
We divided the mitochondria-related proteins into groups. The structural proteins are expressed in the inner mitochondria. The global expression of mitochondrial proteins was lower in bladder tumor cells compared with fibroblasts under individual culture conditions. The expression of mitochondrial proteins in bladder cancer may increase under co-cultured conditions to levels greater than those observed in individual cultures of bladder tumor cells. The other group contained functional proteins, which are indicative of the functional state of the mitochondria, and the data for this group of proteins exhibited the same tendency. However, the expression of the two groups of proteins in fibroblasts revealed an opposite trend. Mitochondrial structure and function are two features that are closely related to oxidative phosphorylation. Thus, we derived a preliminary conclusion. In the individual culture condition, bladder tumor cells exhibited reduced oxidative phosphorylation. Oxidative phosphorylation only supplies some of the energy required for tumor growth. Fibroblasts predominantly undergo oxidative phosphorylation. In the optimal growth stimulation conditions of a co-culture, oxidative phosphorylation levels increased in bladder tumor cells and decreased in tumor-associated fibroblasts. The functional mode and ratio were altered at this time.
In recent years, tumor energy metabolism research has experienced new developments. Dalmonte ME assessed mitochondrial anti-oxidant complex phosphorylation levels in studies of human liver cancer cell energy metabolism and determined that the activity was lower in tumor cells compared with normal cells [16]. The research team led by Professor Carmeliet confirmed that glycolysis is an important process by which endothelial cells obtain energy in co-culture conditions and serves as the main energy source during the construction of new blood vessels. This previous study also indicated that the energy source for and basic growth of endothelial cells can be inhibited by blocking glycolysis to inhibit revascularization in various pathological conditions [17]. Multiple studies on tumor-associated cells have played a significant role in the development of tumor cell energy metabolism theories. Lin Z and Martinez-Outschoorn UE reported a major discovery regarding metabolism in tumor cells and tumor-associated fibroblasts. These researchers reported that the production of reactive oxygen species and the glucose uptake rate are higher in tumor-associated cells in co-culture conditions compared with individual culture conditions. Oxidative phosphorylation is lower in tumor-associated fibroblasts in co-cultures compared with individual cultures. Therefore, they concluded that the presence of tumor cells increases glycolysis in tumor-associated fibroblasts. Further experiments revealed that pyruvate levels in tumor cells increased under co-culture conditions [18].
Research from numerous scientists and our experimental results suggest the importance of the bladder tumor interstitial pattern in energy metabolism. Bladder tumor cell energy metabolism does not parallel the “Warburg effect”. Bladder cancer cells exhibit an efficient oxidative phosphorylation process wherein these cells promote glycolysis in adjacent interstitial cells, increasing the formation of nutritional precursors. These high-energy metabolites are directionally transferred to adjacent tumor cells and enter the Krebs Cycle. Ultimately, oxidative phosphorylation increases, and sufficient ATP is produced. Thus, tumor-stromal metabolic coupling is evident (Figure 6).
Figure 6.
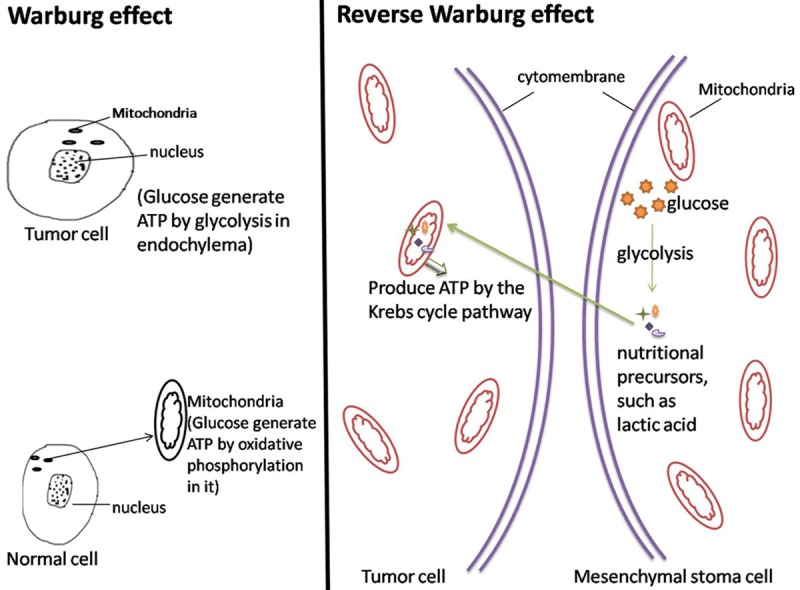
Controls for the Warburg effect and reverse Warburg effect. Cells were cultured under adequate oxygen conditions.
Scientists have confirmed that fibroblasts can be transformed into CAFs with dysfunctional mitochondria by cancer cells [19]. After this transformation, CAFs rely on enhanced glycolysis, thus increasing lactate generation to produce energy for the cancer cells [20]. In addition, numerous transporters are involved in the transmembrane transport of metabolites to avoid acidosis and maintain the metabolic state. As rate-limiting enzymes of this process, MCT4 and MCT1 have captured the attention of researchers. MCT4 transports lactate out of the cell, and MCT1 regulates lactate entry into tumor cells [21]. The accumulation of lactate within tumors is associated with a poor clinical outcome [21,22] and MCT1 and MCT4 comprise the prominent path for lactate metabolism via bidirectional interactions between bladder cancer cells and CAFs [23]. Thus, we hypothesized that MCT1 and MCT4 are involved in bladder cancer proliferation and metastasis. Regarding another aspect of this field, paracrine and energy metabolism are related to the interactions between bladder cancer cells and CAFs. In the tumor microenvironment, the production of ROS (reactive oxygen species) by bladder cancer cells induces HIF-1α (hypoxia-inducible factor 1α) in adjacent CAFs via the inhibition of PDH (pyruvate dehydrogenase) [24]. As a negative regulator of NO production, caveolin-1 is degraded by HIF-1α via autophagy. The subsequent excessive NO production inhibits cytochrome c oxidase. ROS also promote mitochondrial dysfunction in CAFs [20]. Thus, these cells also rely on enhanced glycolysis. Furthermore, secreted cellular factors, such as PDGF (platelet-derived growth factor) and TGF-β (transforming growth factor β), are involved in the interaction between bladder cancer cells and CAFs. A paracrine signaling network involving PDGF and PDGF receptor-α was identified by Charlotte Anderberg et al. [25] in malignant melanoma. Another paper [26] suggested that the migration speed of cancer cells co-cultured with CAFs was influenced by TGF-β. Marco Pupo et al. [27] demonstrated that GPER (G protein-coupled estrogen receptor) mediates the effects of the Notch signaling pathway in the cellular interactions between cancer cells and CAFs. Numerous scientists have studied energy metabolism in tumors. Based on our study, we pose the following questions: How is the increased generation and transport of nutritional precursors by CAFs coupled to tumor cells? How do MCT4 and MCT1 function in these processes? What signaling pathways are involved in bladder tumor cell energy metabolism? Our team will focus on these questions and collect data to address these unanswered issues. Bladder tumor stromal cells are not exclusively fibroblasts. The roles of endothelial cells, other cells and various known and unknown cytokines in the tumor stroma remain uncharacterized. It will take considerable time to discuss these questions.
Among urinary system diseases, bladder tumors have become a serious threat to human health. Long treatment periods, tumor relapse, and difficulty in obtaining a cure are problems that have plagued scientists and patients from various countries. Currently, numerous treatments for bladder cancer are based on energy metabolism [28,29]. However, various treatment modalities, ranging from conservative surgery to radical surgery and targeted therapy, are not effective for this disease. Thus, research on bladder tumor energy metabolism is key to understanding the mechanisms involved in the development of bladder cancer and to identifying prevention and treatment strategies [30]. Our understanding of bladder tumor energy metabolism is just beginning to develop. With the efforts of generations of scientists and further research in this area, we believe that we will eventually understand bladder cancer energy metabolism and elucidate its pathogenesis. This information will guide our explorations of novel therapies.
Acknowledgements
This work was supported by grants from the National Natural Science Foundation of China (Nos. 30901481, 81372752, 81472411) and the Wu Jie Ping Medical Foundation (No. 320.6750.13261).
Disclosure of conflict of interest
None.
References
- 1.Ferreira LM. Cancer metabolism: the Warburg effect today. Exp Mol Pathol. 2010;89:372–380. doi: 10.1016/j.yexmp.2010.08.006. [DOI] [PubMed] [Google Scholar]
- 2.Anahan D, Weinberg RA. The hallmarks of cancer. Cell. 2000;100:57–7. doi: 10.1016/s0092-8674(00)81683-9. [DOI] [PubMed] [Google Scholar]
- 3.Vander Heiden MG, Cantley LC, Thompson CB. Understanding the Warburg effect: the metabolic requirements of cell proliferation. Science. 2009;324:1029–1033. doi: 10.1126/science.1160809. [DOI] [PMC free article] [PubMed] [Google Scholar]
- 4.DeBerardinis RJ. Is cancer a disease of abnormal cellular metabolism? New angles on an old idea. Genet Med. 2008;10:767–77. doi: 10.1097/GIM.0b013e31818b0d9b. [DOI] [PMC free article] [PubMed] [Google Scholar]
- 5.Weinhouse S, Warburg O, Burk D. On respiratory impairment in cancer cells. Science. 1956;124:267–272. doi: 10.1126/science.124.3215.267. [DOI] [PubMed] [Google Scholar]
- 6.Eng CH, Yu K, Lucas J, White E, Abraham RT. Ammonia derived from glutaminolysis is a diffusible regulator of autophagy. Sci Signal. 2010;3:ra31. doi: 10.1126/scisignal.2000911. [DOI] [PubMed] [Google Scholar]
- 7.Bensaad K, Tsuruta A, Selak MA. TIGAR, a p53-inducible regulator of glycolysis and apoptosis. Cell. 2006;126:107–120. doi: 10.1016/j.cell.2006.05.036. [DOI] [PubMed] [Google Scholar]
- 8.Elenbaas B, Weinberg RA. Heterotypic signaling between epithelial tumor cells and fibroblasts in carcinoma formation. Exp Cell Res. 2001;264:169–184. doi: 10.1006/excr.2000.5133. [DOI] [PubMed] [Google Scholar]
- 9.Tang J, Cui J, Chen R. A three-dimensional cell biology model of human hepatocellular carcinoma in vitro. Tumour Biol. 2011;32:469–479. doi: 10.1007/s13277-010-0140-7. [DOI] [PubMed] [Google Scholar]
- 10.Shiraki N, Yamazoe T, Qin Z. Efficient differentiation of embryonic stem cells into hepatic cells in vitro using a feeder-free basement membrane substratum. PLoS One. 2011;6:e24228. doi: 10.1371/journal.pone.0024228. [DOI] [PMC free article] [PubMed] [Google Scholar]
- 11.Pennisi E. Modern symbionts inside cells mimic organelle evolution. Science. 2014;346:532–533. doi: 10.1126/science.346.6209.532. [DOI] [PubMed] [Google Scholar]
- 12.Radke S, Chander H, Schäfer P. Mitochondrial protein quality control by the proteasome involves ubiquitination and the protease Omi. J Biol Chem. 2008;283:12681–12685. doi: 10.1074/jbc.C800036200. [DOI] [PMC free article] [PubMed] [Google Scholar]
- 13.Seo TW, Lee JS, Yoo SJ. Cellular Inhibitor of Apoptosis Protein 1 ubiquitinates endonuclease G but does not affect endonuclease G-mediated cell death. Biochem Biophys Res Commun. 2014;451:644–649. doi: 10.1016/j.bbrc.2014.08.047. [DOI] [PubMed] [Google Scholar]
- 14.Nath S, Villadsen J. Oxidative Phosphorylation Revisited. Biotechnol Bioeng. 2015;112:429–437. doi: 10.1002/bit.25492. [DOI] [PubMed] [Google Scholar]
- 15.Schulz TJ, Thierbach R, Voigt A. Induction of oxidative metabolism by mitochondrial frataxin inhibits cancer growth Otto Warburg Revisited. J Biol Chem. 2006;281:977–981. doi: 10.1074/jbc.M511064200. [DOI] [PubMed] [Google Scholar]
- 16.Dalmonte ME, Forte E, Genova ML. Control of Respiration by cytochrome c oxidase in intact cells role of the membrane potential. J Biol Chem. 2009;284:32331–32335. doi: 10.1074/jbc.M109.050146. [DOI] [PMC free article] [PubMed] [Google Scholar]
- 17.De Bock K, Georgiadou M, Schoors S. Role of PFKFB3-driven glycolysis in vessel sprouting [J] Cell. 2013;154:651–663. doi: 10.1016/j.cell.2013.06.037. [DOI] [PubMed] [Google Scholar]
- 18.Martinez-Outschoorn UE, Lin Z, Trimmer C. Cancer cells metabolically “fertilize” the tumor microenvironment with hydrogen peroxide, driving the Warburg effect: implications for PET imaging of human tumors. Cell Cycle. 2011;10:2504–2520. doi: 10.4161/cc.10.15.16585. [DOI] [PMC free article] [PubMed] [Google Scholar]
- 19.Martinez-Outschoorn UE, Balliet RM, Rivadeneira DB. Oxidative stress in cancer associated fibroblasts drives tumor-stroma co-evolution: A new paradigm for understanding tumor metabolism, the field effect and genomic instability in cancer cells. Cell Cycle. 2010;9:3256. doi: 10.4161/cc.9.16.12553. [DOI] [PMC free article] [PubMed] [Google Scholar]
- 20.Pavlides S, Vera I, Gandara R. Warburg meets autophagy: cancer-associated fibroblasts accelerate tumor growth and metastasis via oxidative stress, mitophagy, and aerobic glycolysis. Antioxid Redox Sign. 2012;16:1264–1284. doi: 10.1089/ars.2011.4243. [DOI] [PMC free article] [PubMed] [Google Scholar]
- 21.Kennedy KM, Dewhirst MW. Tumor metabolism of lactate: the influence and therapeutic potential for MCT and CD147 regulation. Future Oncol. 2010;6:127–48. doi: 10.2217/fon.09.145. [DOI] [PMC free article] [PubMed] [Google Scholar]
- 22.Walenta S, Wetterling M, Lehrke M. High lactate levels predict likelihood of metastases, tumor recurrence, and restricted patient survival in human cervical cancers. Cancer Res. 2000;60:916–921. [PubMed] [Google Scholar]
- 23.Zhao Z, Wu MS, Zou C, Tang Q. Downregulation of MCT1 inhibits tumor growth, metastasis and enhances chemotherapeutic efficacy in osteosarcoma through regulation of the NF-κB pathway. Cancer Lett. 2014;342:150–8. doi: 10.1016/j.canlet.2013.08.042. [DOI] [PubMed] [Google Scholar]
- 24.Ghesquir Lett S, Zou W, Kuchnio A. Metabolism of stromal and immune cells in health and disease. Nature. 2014;511:167–176. doi: 10.1038/nature13312. [DOI] [PubMed] [Google Scholar]
- 25.Anderberg C, Li H, Fredriksson L. Paracrine signaling by platelet-derived growth factor-CC promotes tumor growth by recruitment of cancer-associated fibroblasts. Cancer Res. 2009;69:369–378. doi: 10.1158/0008-5472.CAN-08-2724. [DOI] [PMC free article] [PubMed] [Google Scholar]
- 26.Hsu TH, Kao YL, Lin WL. The migration speed of cancer cells influenced by macrophages and myofibroblasts co-cultured in a microfluidic chip. Integr Biol (Camb) 2012;4:177–182. doi: 10.1039/c2ib00112h. [DOI] [PubMed] [Google Scholar]
- 27.Pupo M, Pisano A, Abonante S. GPER activates Notch signaling in breast cancer cells andcancer-associated fibroblasts (CAFs) Int J Biochem Cell Biol. 2014;46:56–67. doi: 10.1016/j.biocel.2013.11.011. [DOI] [PubMed] [Google Scholar]
- 28.Ward PS, Thompson CB. Metabolic reprogramming: a cancer hallmark even warburg did not anticipate. Cancer Cell. 2012;21:297–308. doi: 10.1016/j.ccr.2012.02.014. [DOI] [PMC free article] [PubMed] [Google Scholar]
- 29.Son J. Glutamine supports pancreatic cancer growth through a KRAS-regulated metabolic pathway. Nature. 2013;496:101–105. doi: 10.1038/nature12040. [DOI] [PMC free article] [PubMed] [Google Scholar]
- 30.Vander Heiden MG, Cantley LC, Thompson CB. Understanding the Warburg effect: the metabolic requirements of cell proliferation. Science. 2009;324:1029–1033. doi: 10.1126/science.1160809. [DOI] [PMC free article] [PubMed] [Google Scholar]


