

Abstract
Nonalcoholic fatty liver disease (NAFLD) is often associated with dyslipidemia. Metabolic disequilibrium, resulting from being overweight and obesity, increases risk to cardiovascular system and chronic liver disease. Alanine aminotransferase (ALT), aspartate aminotransferase (AST) and gamma-glutamyl transferase (GGT) are standard clinical markers for liver injury. In this study, we examined association of body mass index (BMI) and metabolic markers with serum ALT, AST and GGT activity in an overweight and obese Chinese population. A total of 421 overweight and obese Chinese adults (211 males and 210 females) from The First Affiliated Hospital of Wenzhou Medical University were recruited in this study in 2014. All participants underwent anthropometric measures and phlebotomy after an overnight fast. Elevated ALT, AST and GGT levels were found in 17%, 5% and 24%, respectively. There were significant correlations between ALT and BMI, plasma triglycerides (TG), cholesterol, HDL and glucose, and between AST and plasma TG and cholesterol. GGT also correlated with plasma TG, cholesterol and glucose. The levels of ALT, AST and GGT could be predicted by BMI, plasma TG, cholesterol, HDL and glucose using the back propagation artificial neural network model (BP-ANN). These data suggest that abnormal metabolic markers could be used to monitor liver function to determine whether liver damage has occurred in overweight and obese individuals. This approach has clinical utility with respect to early scanning of liver injury or NAFLD based on routinely available metabolic data in overweight and obese population.
Keywords: ALT, AST, GGT, metabolic parameters, BP-ANN
Introduction
Non-alcoholic fatty liver disease (NAFLD) is a common, often “silent”, liver disease in which most people feel well and are not aware that they have ongoing liver injury. NAFLD is characterized by an excessive accumulation of fat in hepatocytes. NAFLD pathology includes steatosis and nonalcoholic steatohepatitis (NASH). The occurrence of NAFLD is closely associated with obesity, metabolic syndrome, and dyslipidemia. The prevalence of NAFLD is estimated to be 67%-75% in obese individuals [1]. Given that obesity is increasing at an alarming rate in the general population, NAFLD is currently the third most common cause of liver transplantation. Although not all patients with NAFLD are obese, obesity is considered the most important risk factor [2]. Therefore, an early awareness of potential liver injury in an obese or overweight population is important.
The liver is the most important metabolic organ of the body, and is involved in regulating blood glucose, breaking down fat compounds and lipids and degrading harmful substances and drugs. In the clinic, liver function is generally assessed by serum bilirubin, albumin, and liver enzymes [3]. Alanine aminotransferase (ALT), aspartate aminotransferase (AST) and gamma-glutamyl transferase (GGT) are the three most sensitive liver enzymes widely used as an indicator of liver injury [4] including viral hepatitis and primary liver cancer [5-7]. These liver enzymes can be altered during metabolic disease. For instance, ALT participates in gluconeogenesis and helps catalyze alanine to α-keto-glutarate, making pyruvate and glutamate [8] Elevated ALT has been demonstrated to be associated with occurrence of the metabolic syndrome [9,10]. Thus, the overweight and obese population, which has been growing worldwide, is at a higher risk for developing metabolic disease and, consequently, liver injury such as NAFLD, compared to healthy population. Early detection and diagnosis of liver injury is required for effective management of those patients with potential liver disease.
The aim of the present study was to investigate the relationship between metabolic markers with biochemical markers for liver injury and to establish a model for predicting liver injury in a total of 421 overweight and obese Chinese subjects.
Subjects and methods
Subjects
A total of 421 overweight and obese Chinese adults (211 males and 210 females) from The First Affiliated Hospital of Wenzhou Medical University were recruited in this study in 2014. Subjects were categorized as overweight or obese based on BMI>24. Individuals were excluded from this study if they had significant excessive alcohol consumption, hepatitis B, hepatitis C, iron overload or known diabetes. The study was approved by the Institutional Review Board of The First Affiliated Hospital of Wenzhou Medical University and conducted in accordance with the Declaration of Helsinki. Informed written consent was obtained from all subjects, or his/her guardians consented on the behalf of the subject, before taking part in this study.
Measurements
Blood samples were collected into separation gel tubes for biochemical measurement. Biochemical indexes including ALT, AST, GGT, plasma triglyceride (TG), total cholesterol (CHO), HDL cholesterol (HDL-c), LDL cholesterol (LDL-c), and fasting glucose (GLU) were determined using Hitachi 705/717 instrumentation.
Statistical analysis
The normal distribution was determined by One-Sample Kolmogorov-Smirnov Test. Statistical analysis was performed with Pearson and Spearman correlation for ALT, AST, GGT levels with all parameters and indexes. P-value<0.05 was considered statistically significant.
BP-ANN prediction model
All 421 subjects were analyzed. The ALT, AST and GGT levels of every subject and relevantly correlated indexes were input into the BP-ANN model. The correlated metabolic indexes were selected as the input layer. The output layer included ALT, AST and GGT levels. The node numbers of hidden layer were based on the formula of m = √(n + I) + a, where m is the number of the nodes in the hidden layer, and n is the number of nodes in the input layer, l is the number of nodes in the output layer and a is a constant from 1 to 10 [11]. The transfer function of the hidden layer nodes was tansig, and the transfer function of the output layer nodes was purelin. The BP-ANN was established with the software Matlab R2011a.
Results
Correlation between ALT, AST, GGT and metabolic parameters in the overweight and obese Chinese population
A total of 421overweight and obese Chinese subjects were recruited in this study. Liver function index ALT, AST, GGT and metabolic parameters were assayed in all subjects. The characteristics and One-Sample Kolmogorov-Smirnov Test are shown in Table 1 and the correlation analyses are shown in Table 2. ALT was associated with age, BMI, height, weight, TG, HDL and CHO. AST was associated with BMI, height, weight, TG and CHO, and GGT was associated with BMI, height, weight, TG, GLU, HDL and CHO (P<0.05). These results indicated that liver enzymes, ALT, AST and GGT, significantly correlated with metabolic parameters, and ALT and GGT may represent more sensitive indexes for abnormal metabolism in overweight and obese Chinese adults.
Table 1.
Characteristics of 421 subjects and One-Sample Kolmogorov-Smirnov (K-S) Test
| Mean ± SD | Minimum | Maximum | K-S Z | Asymp.Sig. (2-tailed) | |
|---|---|---|---|---|---|
| AGE | 45.77 ± 11.22 | 22.00 | 81.00 | 1.81 | 0.003 |
| BMI | 26.39 ± 1.92 | 24.00 | 35.10 | 2.32 | 0.000 |
| HEIGHT (cm) | 165.98 ± 8.44 | 125.00 | 183.00 | 1.99 | 0.001 |
| WEIGHT (kg) | 72.81 ± 8.38 | 44.00 | 101.00 | 1.01 | 0.257 |
| TG | 1.99 ± 1.60 | 0.33 | 14.17 | 3.57 | 0.000 |
| GLU | 5.90 ± 1.14 | 4.40 | 17.00 | 4.57 | 0.000 |
| LDL | 2.88 ± 0.70 | 1.28 | 5.85 | 0.95 | 0.331 |
| HDL | 1.27 ± 0.29 | 0.69 | 2.21 | 1.92 | 0.001 |
| CHO | 4.96 ± 0.88 | 2.72 | 9.97 | 1.24 | 0.093 |
| ALT | 33.90 ± 21.86 | 4.00 | 137.00 | 3.12 | 0.000 |
| AST | 24.65 ± 9.14 | 10.00 | 83.00 | 2.48 | 0.000 |
| GGT | 50.92 ± 55.70 | 8.00 | 564.00 | 4.65 | 0.000 |
Table 2.
Correlations of ALT, AST and GGT levels with physiological and biochemical parameters. Pearson’s and Spearman’s correlation coefficient (R) and the probability value of significance (P) are shown
| AGE | BMI | Height | Weight | TG | GLU | LDL | HDL | CHO | ALT | AST | GGT | ||
|---|---|---|---|---|---|---|---|---|---|---|---|---|---|
| ALT | Correlation Coefficient | -.165** | .192** | .262** | .253* | .289** | 0.075 | 0.082 | -.201** | .140* | 1 | .750** | .589** |
| Sig. (2-tailed) | 0.001 | 0 | 0 | 0 | 0 | 0.122 | 0.093 | 0 | 0.004 | . | 0 | 0 | |
| AST | Correlation Coefficient | 0.02 | .139** | .149** | .161* | .181** | 0.043 | 0.02 | -0.026 | .132* | .750** | 1 | .465** |
| Sig. (2-tailed) | 0.686 | 0.004 | 0.002 | 0.001 | 0 | 0.381 | 0.69 | 0.601 | 0.007 | 0 | . | 0 | |
| GGT | Correlation Coefficient | -0.019 | .199** | .341** | .228* | .448** | .166** | 0.053 | -.127** | .202* | .589** | .465** | 1 |
| Sig. (2-tailed) | 0.701 | 0 | 0 | 0 | 0 | 0.001 | 0.278 | 0.009 | 0 | 0 | 0 | . |
Pearson’s correlation coefficient.
Spearman’s correlation coefficient.
BP-ANN prediction model of ALT, AST and GGT
Using the results of the Pearson correlation of ALT, AST and GGT levels with metabolic parameters, three BP-ANN models were developed. 1) Model-ALT selected age, BMI, height, weight, TG, HDL and CHO as input layer to predict ALT level. 2) Model-AST selected BMI, height, weight, TG and CHO as input layer to predict AST level. 3) Model-GGT selected BMI, height, weight, TG, GLU, HDL and CHO as input layer to predict GGT level. The constructing parameters of three BP-ANN models were the same and the training epoch was set at 1000 replicas. After training, the sound prediction was determined from performing each of ALT, AST and GGT models, and the good fitness was indicated by following four values: mean square error (MSE), magnitude of the gradient, the number of validation checks, correlation coefficient, which are shown in Table 3. The predicted and measured profiles of ALT, AST and GGT in three models are respectively shown in Figures 1, 2 and 3.
Table 3.
The fitness index of the BP-ANN model of ALT, AST and GGT performed in 200 subjects
| Index | Model-ALT* | Model-AST* | Model-GGT* |
|---|---|---|---|
| Mean squared error | 1.43×10⁻⁵ | 1.49×10⁻⁵ | 9.67×10⁻⁶ |
| Magnitude of the gradient | 3.66×10⁻³ | 4.01×10⁻⁴ | 2.21×10⁻⁴ |
| Mu | 1×10⁻⁵ | 1×10⁻⁴ | 1×10⁻³ |
| Validation checks | 0 | 0 | 0 |
| Correlation coefficient (R) | 1 | 0.99989 | 0.99987 |
The input layer of Model-ALT consists of Age, BMI, Height, Weight, TG, HDL and CHO; Model-AST are BMI, Height, Weight, TG and CHO; Model-GGT are BMI, Height, Weight, TG, GLU, HDL and CHO.
Figure 1.
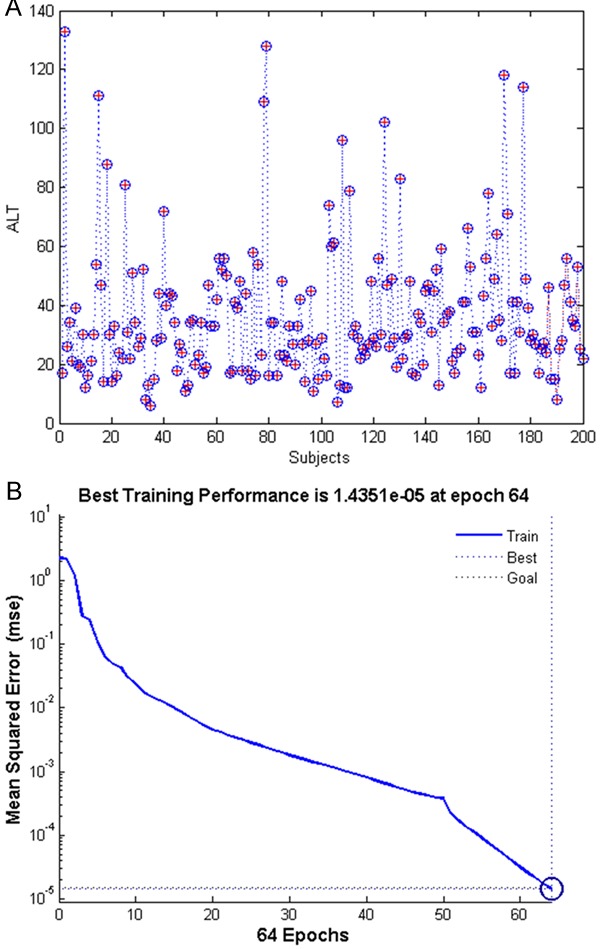
The Model-ALT prediction. The measured ALT concentrations (“+”) and predicted ALT concentrations (“o”) generated by Model-ALT in 200 subjects (A), the best training performances reached the training goal only at Epoch 64 (B). The training goal was set at 1.5×10⁻⁵.
Figure 2.
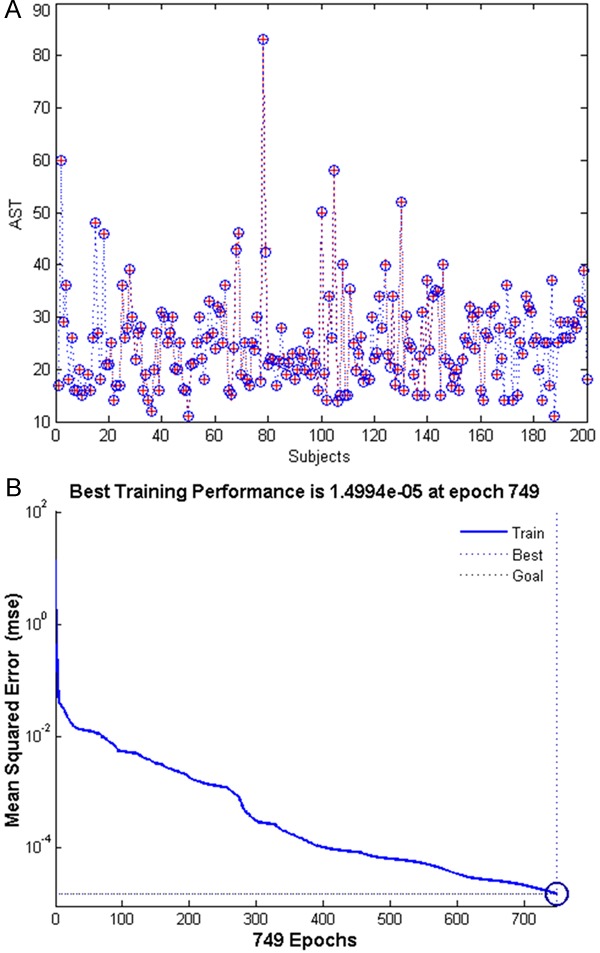
The Model-AST predication. The measured AST concentrations (“+”) and predicted AST concentrations (“o”) generated by Model-AST in 200 subjects (A), the best training performances reached the training goal only at Epoch 749 (B). The training goal was set at 1.5×10⁻⁵.
Figure 3.
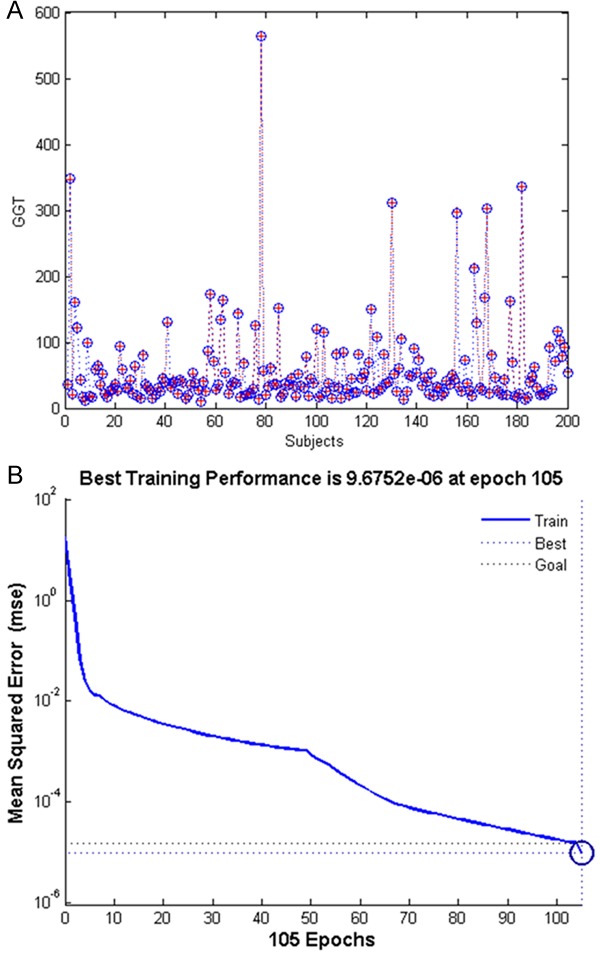
The Model-GGT prediction. The measured GGT concentrations (“+”) and predicted GGT concentrations (“o”) generated by Model-GGT in 200 subjects (A), the best training performances reached the training goal at Epoch 105 (B). The training goal was set at 1.5×10⁻⁵.
Discussion
The overweight or obese population continues to increase at an alarming rate worldwide. Metabolic disorder associated with this population not only likely increases risk for cardiovascular complications, but also liver injury. In order to provide early detection of patients with higher risk for liver disease we need to establish and expand the correlation studies between metabolic and liver injury markers. In the present study we investigated the correlation between three liver enzyme levels and BMI and the other metabolic indexes that are involved in carbohydrate and lipid metabolism in a group of overweight and obese Chinese adults. Our results showed significant correlations among ALT, AST and GGT levels (P<0.001), and that elevated liver enzymes significantly correlated with metabolic indexes including BMI, plasma TG, CHO, HDL and GLU (P<0.05). ALT correlated with BMI, TG, HDL and CHO, AST correlated with TG and CHO, and GGT correlated with TG, GLU, HDL and CHO (P<0.05). Importantly, the relative levels of ALT, AST and GGT can be predicted by BMI and metabolic parameters using our BP-ANN models.
ALT, AST and GGT are the three most sensitive liver enzymes routinely used for detecting liver injury and inflammation [4-7]. Elevated ALT has been shown to be associated with an occurrence of the metabolic syndrome [9,10]. It has been observed that liver injury, such as NAFLD, occurs more frequently in overweight and obese individuals than in those with a normal BMI. However, the exact relationship between BMI and liver injury remains to be clearly defined. Reliable indicators of possible liver injury are critical for early detection and diagnosis of liver damage in overweight and obese individuals. Elevated serum ALT along with fat accumulation induce liver injury and are routinely used markers for screening NAFLD in the general population. In the present study, ALT, AST and GGT levels correlated with BMI and metabolic parameters in a group of overweight and obese Chinese adults. Our data favored using abnormal BMI or overweight/obese outlook and including ALT in the lab tests as earlier indicators to initiate regular monitoring of liver injury.
Artificial neural networks are computational models inspired by a brain’s central nervous system that are capable of machine learning as well as pattern recognition. Back propagation is a common method of training artificial neural networks, which is used in conjunction with an optimization method such as gradient descent [12]. Its accuracy of prediction is largely determined by the correlation between input data and output data. The more relevant the vector factors are, which are selected for the input layer, then a higher accuracy of prediction will be generated in the BP-ANN model. In this study, the Model-ALT performed better than Model-AST and Model-GGT. Model-ALT reached a training goal at epoch 34, which was obviously shorter than Model-AST (epoch 346) and Model-GGT (epoch 85). The more vectors that are involved in the input layer then there will be a higher predicting efficiency of the model. Furthermore, the high predicting efficiency of Model-ALT clearly suggested that both increased age and BMI were closely related to abnormal ALT. Such correlation implies an alarming value of aging and abnormal BMI for liver injury, although they are not biochemical indexes, per se.
Conclusion and implication
Our results showed that ALT correlated with age, BMI, height, weight, TG, HDL and CHO. Thus, our data could likely provide physicians and patients with indicators of liver function to determine whether liver damage has occurred when dyslipidemia, and elevated BMI are noted. This method has clinical value with respect to early prediction of liver injury or NAFLD based on routinely available clinical and laboratory data in an overweight and obese population.
Acknowledgements
This work was partly supported by the Natural Science Foundation of China (81100993, 81300311, 81360212, 81571297 and 81560229), Zhejiang Natural Science Foundation (LY12H03001 and LQ13H280002), Wenling Foundation of Science and Technology (2011WLCB0109 and 2014C311051), Wenzhou Science and Technology Project (Y20140739), Henan basic and frontier technology research projects (142300410388 and 132300410048), Shaoxing Science and Technology Project (2012B70058 and 2013B70066) Ningbo Natural Science Foundation (2015A610234), Xiangshan Science and Technology Project (2015C6005), Project of Medical Technology of Zhejiang province (2015KYB234), and the Research Development Fund of Wenzhou Medical University (QTJ15001).
Disclosure of conflict of interest
None.
Abbreviations
- ALT
alanine aminotransferase
- AST
aspartate aminotransferase
- GGT
Gamma-glutamyl transferase
- TG
triglyceride
- BMI
Body Mass Index
- CHO
total cholesterol
- HDL-c
HDL cholesterol
- LDL-c
LDL cholesterol
- GLU
glucose
References
- 1.Browning JD, Szczepaniak LS, Dobbins R, Nuremberg P, Horton JD, Cohen JC, Grundy SM, Hobbs HH. Prevalence of hepatic steatosis in an urban population in the United States: impact of ethnicity. Hepatology. 2004;40:1387–1395. doi: 10.1002/hep.20466. [DOI] [PubMed] [Google Scholar]
- 2.Ruhl CE, Everhart JE. Determinants of the association of overweight with elevated serum alanine aminotransferase activity in the United States. Gastroenterology. 2003;124:71–79. doi: 10.1053/gast.2003.50004. [DOI] [PubMed] [Google Scholar]
- 3.Meng F, Yin X, Ma X, Guo XD, Jin B, Li H. Assessment of the value of serum cholinesterase as a liver function test for cirrhotic patients. Biomed Rep. 2013;1:265–268. doi: 10.3892/br.2013.60. [DOI] [PMC free article] [PubMed] [Google Scholar]
- 4.Ceriotti F, Henny J, Queralto J, Ziyu S, Ozarda Y, Chen B, Boyd JC, Panteghini M. Common reference intervals for aspartate aminotransferase (AST), alanine aminotransferase (ALT) and gamma-glutamyl transferase (GGT) in serum: results from an IFCC multicenter study. Clin Chem Lab Med. 2010;48:1593–1601. doi: 10.1515/CCLM.2010.315. [DOI] [PubMed] [Google Scholar]
- 5.Yu AS, Keeffe EB. Elevated AST or ALT to nonalcoholic fatty liver disease: accurate predictor of disease prevalence? Am J Gastroenterol. 2003;98:955–956. doi: 10.1111/j.1572-0241.2003.07485.x. [DOI] [PubMed] [Google Scholar]
- 6.Kapadia S, Hapani S, Choueiri TK, Wu S. Risk of liver toxicity with the angiogenesis inhibitor pazopanib in cancer patients. Acta Oncol. 2013;52:1202–1212. doi: 10.3109/0284186X.2013.782103. [DOI] [PubMed] [Google Scholar]
- 7.Hu C, Deng C, Song G, Zhang W, Zhang S, Li X, Li P, Zhang F, Li Y. Prevalence of autoimmune liver disease related autoantibodies in Chinese patients with primary biliary cirrhosis. Dig Dis Sci. 2011;56:3357–3363. doi: 10.1007/s10620-011-1756-1. [DOI] [PubMed] [Google Scholar]
- 8.Sakagishi Y. [Alanine aminotransferase (ALT)] . Nihon Rinsho. 1995;53:1146–1150. [PubMed] [Google Scholar]
- 9.Kunutsor SK, Seddoh D. Alanine aminotransferase and risk of the metabolic syndrome: a linear dose-response relationship. PLoS One. 2014;9:e96068. doi: 10.1371/journal.pone.0096068. [DOI] [PMC free article] [PubMed] [Google Scholar]
- 10.Oka R, Yagi K, Nakanishi C, Konno T, Kawashiri MA, Hayashi K, Nohara A, Inazu A, Yamagishi M. Relationships between alanine aminotransferase (ALT), visceral adipose tissue (AT) and metabolic risk factors in a middle-aged Japanese population. J Atheroscler Thromb. 2014;21:582–592. [PubMed] [Google Scholar]
- 11.Xu JF, Xu J, Li SZ, Jia TW, Huang XB, Zhang HM, Chen M, Yang GJ, Gao SJ, Wang QY, Zhou XN. Transmission risks of schistosomiasis japonica: extraction from back-propagation artificial neural network and logistic regression model. PLoS Negl Trop Dis. 2013;7:e2123. doi: 10.1371/journal.pntd.0002123. [DOI] [PMC free article] [PubMed] [Google Scholar]
- 12.Wesolowski M, Suchacz B, Konieczynski P. The application of artificial neural networks for the selection of key thermoanalytical parameters in medicinal plants analysis. Comb Chem High Throughput Screen. 2003;6:811–820. doi: 10.2174/138620703771826928. [DOI] [PubMed] [Google Scholar]